Future Geothermal Generation Stack - A report for the Ministry of Business, Innovation and Employment Authored by: Lawless Geo-Consulting Jim ...
←
→
Page content transcription
If your browser does not render page correctly, please read the page content below
Future Geothermal Generation Stack

        A report for the Ministry of Business, Innovation and Employment
                                   Authored by: Lawless Geo-Consulting
                             (Jim Lawless, Bart van Campen, Jim Randle)
                                                             Revision D
                                                            March 2020
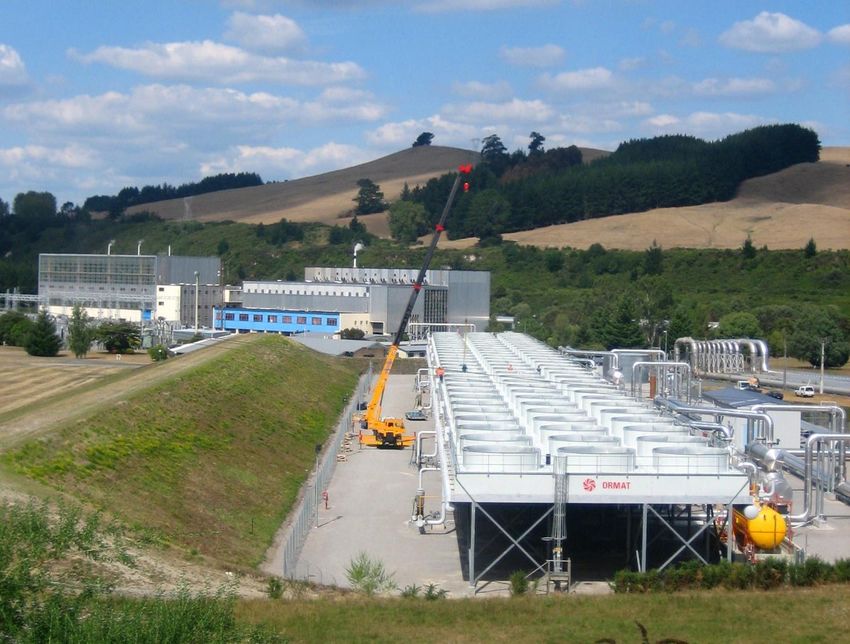
Cover page: The 14 MW (net) binary bottoming plant at Wairakei. Original A and B Stations in the
background. A good example of recent incremental brownfield development.
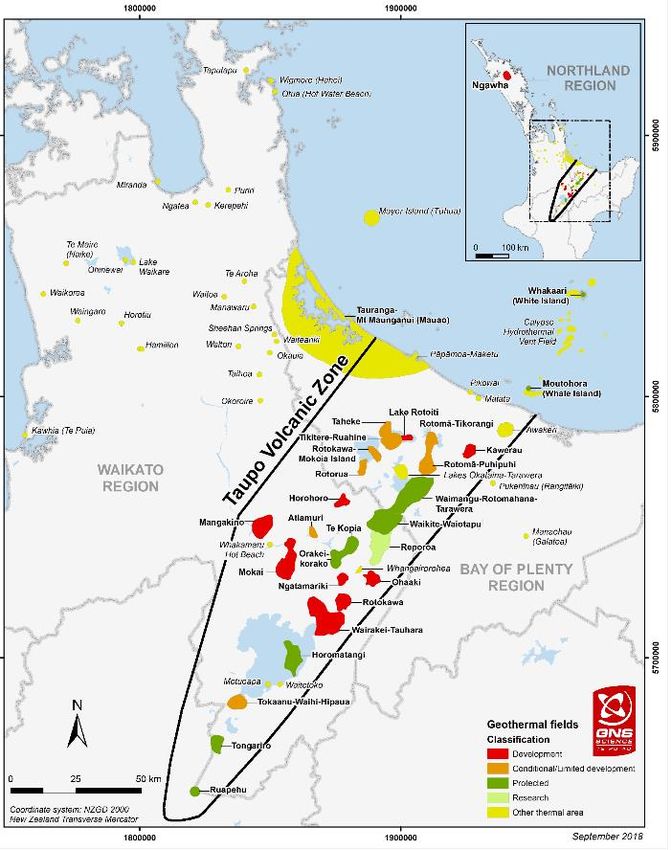
Table of Contents
  Disclaimer............................................................................................................................................ 5
  List of abbreviations ............................................................................................................................ 6
Executive Summary................................................................................................................................. 1
1.      Introduction .................................................................................................................................... 3
  1.1. Scope of work.......................................................................................................................... 3
  1.2. Background ............................................................................................................................. 3
2. Present generation, regulations and emissions.............................................................................. 6
     2.1. Present geothermal generation and location ......................................................................... 6
     2.2. Outline of geothermal technology .......................................................................................... 7
     2.3. Regulatory environment and impacts on development timing and feasibility ...................... 9
       Classification and preservation of geothermal systems ................................................................. 9
        Central government policy affecting geothermal development .................................................. 11
        Multiple operators ........................................................................................................................ 12
        Status of landowners .................................................................................................................... 12
        Maori interests .............................................................................................................................. 12
        Safety Regulations......................................................................................................................... 13
   2.4. Greenhouse gas emissions.................................................................................................... 13
3. Methodology adopted for estimating CAPEX and OPEX................................................................... 17
  3.1. CAPEX .................................................................................................................................... 17
  3.2. Foreign/USD and local cost shares........................................................................................ 19
  3.3. OPEX ...................................................................................................................................... 20
  3.4. Greenhouse gas emission costs ............................................................................................ 20
4. Other potential future developments .......................................................................................... 22
  4.1. Potential for new technology to increase existing geothermal generation capacity ................ 22
  4.2. Potential for geothermal generation to be extended to areas outside the existing Rotorua-
  Taupō and Ngāwhā areas.................................................................................................................. 23
  4.3. Potential for geothermal to generate in a load-following manner, to compensate for
  intermittency of other electricity sources ........................................................................................ 25
  4.4. Extent to which non-electric uses of geothermal energy will compete with, or complement
  generation ......................................................................................................................................... 26
5. Review of individual prospects ..................................................................................................... 28
        Decommissioning .......................................................................................................................... 28
     5.1. Northland ................................................................................................................................... 29
       Ngāwhā ......................................................................................................................................... 29
     5.2. Waikato Region .......................................................................................................................... 30
       Atiamuri ........................................................................................................................................ 30
        Horohoro ....................................................................................................................................... 31
        Ketetahi/Tongariro........................................................................................................................ 31
        Lake Taupō/Horomatangi ............................................................................................................. 31
        Mangakino .................................................................................................................................... 31
        Mokai ............................................................................................................................................ 32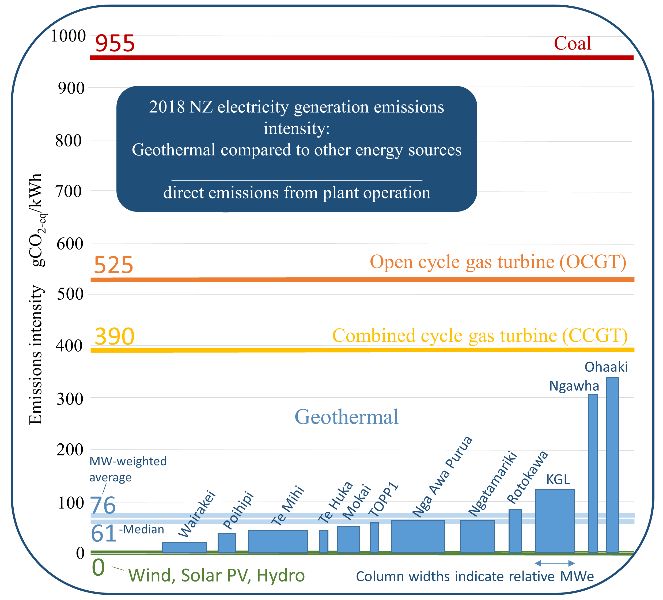
Ngatamariki ................................................................................................................................... 32
        Ohaaki ........................................................................................................................................... 33
        Orakei Korako................................................................................................................................ 34
        Reporoa ......................................................................................................................................... 34
        Rotokawa ...................................................................................................................................... 35
        Tauhara & Wairakei ...................................................................................................................... 36
        Te Kopia......................................................................................................................................... 38
        Tokaanu (+ Hipaua-Waihi) ............................................................................................................ 38
        Waimangu, Waiotapu and Waikite ............................................................................................... 38
     5.3. Bay of Plenty Region .................................................................................................................. 39
       Kawerau ........................................................................................................................................ 39
        Rotoma .......................................................................................................................................... 41
        Rotorua ......................................................................................................................................... 41
        Taheke and Tikitere....................................................................................................................... 41
     5.4. Summary future geothermal generation stack.......................................................................... 42
6.     Conclusions ................................................................................................................................... 45
References ............................................................................................................................................ 47
     Annex 1: List of persons consulted ................................................................................................... 50
     Annex 2: GHG emissions from NZ producing fields .......................................................................... 51
     Annex 3: Scope of work .................................................................................................................... 53

List of Figures
Figure 1: LRMC of new non-peak RE-generation according to EDGS-2016 (source: MBIE, 2016) ......... 4
Figure 2: Map of New Zealand’s high temperature geothermal resources (source: NZGA/GNS, 2019)
 ................................................................................................................................................................ 6
Figure 3: Graphical chart comparing the operational emissions intensity of geothermal power
stations in New Zealand to other types of electricity generation (source: McLean and Richardson,
2019) ..................................................................................................................................................... 15
Figure 4: Variation of power plant cost with size (source: GT Management, 2019) ............................ 18
Figure 5: Regions where
Disclaimer While every effort has been taken to ensure the information in this report is correct, the study has involved a degree of subjective judgement as to future events, which has included in some cases the weighing of the balance of probabilities of future events. Therefore, neither Lawless Geo-Consulting nor the individual authors take responsibility for future investment decisions which may be taken on the basis of results presented herein.
List of abbreviations

 BOPRC              Bay of Plenty Regional Council
 CCS                Carbon Capture and Storage
 CMA                Crown Minerals Act (2010)
 COD                Commercial Operation Date (date when a power plant is fully commissioned)
 EDGS               Electricity Demand and Generation Scenarios (published on a regular basis by
                    MBIE to inform electricity market and facilitate planning)
 GDL                Geothermal Developments Ltd
 GHG                Greenhouse gases
 IRR                Internal rate of return
 KGL                Kawerau Geothermal Limited (Kawerau Power Station owned by Mercury)
 MBIE               Ministry of Business, Innovation and Employment
 Mercury/MRP        Mercury NZ Limited (formerly Mighty River Power)
 MWe                Net Megawatts of electrical energy generated from a power station
 NCG                Non-condensable gases (like CO2, CH4 and H2S)
 NPS                National Policy Statement
 NST                Norske Skog Tasman
 NTGA(L)            Ngāti Tuwharetoa Geothermal Assets Limited
 NTST               Ngati Tūwharetoa (BOP) Settlement Trust
 NTEL               Ngati Tūwharetoa Electricity Limited
 NZGA               New Zealand Geothermal Association
 NZU                New Zealand carbon emissions trading unit
 PRP                Peer Review Panel
 RMA                Resource Management Act 1991
 RPS                Regional Policy Statements
 SAGS               Steamfield above ground system
 TAOM               Te Ahi O Māui Partnership
 TN2T               Tauhara North No. 2 Trust
 TPC                Tuaropaki Power Company
 TVZ                Taupō Volcanic Zone
 WACC               Weighted average cost of capital
Executive Summary
This review was commissioned by the Ministry for Business, Innovation and Employment (MBIE) in
consultation with Transpower. The principal objective of this work is to present estimations about the
possible timing and cost of future geothermal projects in New Zealand over a 40-year horizon.
The pace of geothermal development in New Zealand has been modest over the past five years, after
a period of rapid growth in response to declining gas reserves. There is now a more positive mood in
the industry following the government setting objectives for greatly reduced GHG emissions by 2050.
Direct use of geothermal heat can also make a significant contribution to reducing fossil fuel use,
though that is not the subject of the present study. The industry foresees on-going growth in the
geothermal generation sector, albeit at a modest pace.
Access to resources is more likely to constrain the pace of development than project cost and
electricity price. Around half of New Zealand’s high-temperature geothermal resources are currently
fully or partially protected. Regulatory and consenting difficulties may lead to delays for future
projects. For the present study, it is assumed that the current regulatory regime will remain more or
less as is, but it is conceivable that more permissive or more restrictive approaches are possible in the
future. The current draft NPS on Biodiversity, which is open for consultation at present, is an example
of regulation that in its initial draft form could limit future geothermal development if that is not taken
into account. It should not be assumed that all existing projects will automatically be re-consented,
and the consents for all existing projects expire within the 40-year horizon. On the other hand, a more
enabling regime and policy at the national level would accelerate the pace of geothermal
development, but would also presumably make it easier to consent new wind and solar and possibly
even small hydro projects so would not necessarily favour geothermal over other renewable sources.
It is not expected that new technology will greatly reduce the cost of future geothermal generation
nor, within what is likely to be economic in New Zealand, significantly extend the geographical spread
of its coverage to much lower-temperature resources. Thus, future large-scale development is likely
to be within the Taupō Volcanic Zone and at Ngāwhā in Northland. Some modest cost reductions and
gains in efficiency can be expected within the existing project areas, but to a lesser extent than the
less mature renewable industries such as solar, wind and storage.
From a technical perspective, geothermal generation can be made to run in a load-following manner,
but the most economic use of geothermal generation will remain as base load. It is conceivable that
government initiatives to minimise carbon emissions might lead to geothermal becoming more
important for load following, although the generators concerned would probably insist on a take-or-
pay or capacity charge type of compensation to take account of the very high proportion of fixed costs
of geothermal project operation. New geothermal has the potential to largely substitute for existing
thermal plant as baseload firming for other renewables.
Geothermal power projects do emit GHG, albeit in most cases at significantly lower rates per MWh
than fossil fuel plants. Previous studies in New Zealand have over-stated the emissions of existing and
future geothermal plants, in part because emissions have actually dropped over time in some cases.
More specific figures have been presented here for each prospect to a semi-quantitative level, based
on actual recent data. The present MW-weighted average emissions intensity for existing geothermal
projects is 76 g CO2eq/kWh (2018), which has been steadily declining (91 g CO2eq/kWh in 2015) and
is expected to continue to do so in the future. If much higher carbon prices eventuate in the future,
the pressure on geothermal plants will increase and the expected emissions intensity would likely drop
faster. In general, that would disadvantage new, higher emitting geothermal projects relative to other
renewables (but much less than fossil-fuelled plants). The CCS technology does exist for removal of
1GHG from geothermal plants and reinjection into nearby reservoirs, and likely at a lower cost than for
fossil fuel projects.
Greater future direct use of geothermal energy is generally expected to be complementary rather than
competitive to electricity generation or to be based on lower-temperature resources. A notable
exception to that could be at Kawerau where there is scope for expansion but the balance between
future industrial use and electricity generation is unclear. Another possible future “direct use” is
mineral recovery provided certain technical challenges can be overcome. Preservation of geothermal
activity for tourism is a form of “direct use” which precludes generation at Rotorua and some of the
protected systems in particular.
To derive capital costs of projects, scaling factors based on enthalpy and project size have been applied
to the power plant portion of the project cost, which is taken to be 40% of the total. On this basis
capital costs range from $4,734 to $9,767/kW with a weighted average of $5,782/kW. It is expected
that at least 50% of the project capital costs will be in New Zealand currency.
No significant net reduction in existing production is anticipated due to decommissioning over the
next 40 years (assuming any retirement of plant at Wairakei is met by an increase at Te Mihi), provided
all existing plants can be re-consented for the existing quantities of fluid take.
.
Taking likely earliest dates of COD into account yields an estimated sequence of future geothermal
projects as summarised in Table 6 (section 5.4). The total estimated available future geothermal
generation stack by 2060 is 1035 MW.
This total new geothermal generation stack is slightly higher than previously presented by MBIE
(2016), but it is likely that many projects will be commissioned later than previously assumed, for
reasons other than cost.
21. Introduction
1.1. Scope of work
This review was commissioned by the Ministry for Business, Innovation and Employment (MBIE) in
consultation with Transpower. The scope of work is presented in Annex 3. The principal objective of
this work is to present estimations about the possible timing and cost of future geothermal projects
in New Zealand over a 40-year horizon. The resulting ‘future geothermal generation stack’ should
assist MBIE in updating its 2016 Electricity Demand and Generation Scenarios for New Zealand, and
planning/modelling for future transmission requirements.
Differences between this review and that underlying the 2016 version include:
Greater attention to the issue of timing and consenting of geothermal projects, which will
inevitably lead to delays for some projects beyond the point that a simple LRMC comparison
would indicate;
More quantification of greenhouse gas emissions (GHG) from geothermal projects, based on
recent data from existing projects;
More consideration of the effects of scale and likely technology of projects on their capital
cost;
The split of CAPEX between local and overseas components.
The process has involved extensive consultation with the geothermal industry and relevant regulators
and well as review of published information. The willing participation of many people from the
industry and regulators is gratefully acknowledged (see Annex 1). However, the opinions and
assumptions expressed herein are entirely those of the authors.
This report has been authored by:
Jim Lawless (Lawless Geo-Consulting Limited)
Jim Randle (GT Management)
Bart van Campen (Geothermal Institute, University of Auckland)
1.2. Background
As part of the 2016 Electricity Demand and Generation Scenarios (EDGS), MBIE produced a likely
geothermal generation stack as follows:
Variable
Typical Capital Fixed O&M, LRMC
Project Type Status MW O&M,
GWh pa cost $m $/kW $/MWh
$/MWh
TikitereTaheke_generic2 Geo Generic 80 631 409 0.00 105.00 95.37
Tauhara_stage_2 Geo Fully Consented 250 1971 1184 0.00 105.00 97.65
Rotokawa_generic1 Geo Generic 130 1025 620 0.00 105.00 98.09
Ngatamariki_generic1 Geo Generic 100 788 479 0.00 105.00 98.32
Tauhara_generic1 Geo Generic 80 631 409 0.00 105.00 102.70
Tikitere_LakeRotoiti Geo Proposed 45 355 299 0.00 105.00 114.47
Kawerau_generic2 Geo Generic 30 237 219 0.00 105.00 122.56
Ngawha2_stage_1 Geo Fully Consented 25 197 183 0.00 105.00 122.76
Ngawha2_stage_2 Geo Fully Consented 25 197 183 0.00 105.00 122.76
Rotoma_LakeRotoma Geo Applied for Consent 35 276 256 0.00 105.00 123.05
Kawerau_TeAhiOMaui _KA22 Geo Fully Consented 20 158 147 0.00 105.00 123.08
Wairakei_generic1 Geo Generic 45 355 327 0.00 105.00 131.61
Mangakino_generic1 Geo Generic 40 315 291 0.00 105.00 131.70
Ohaaki_generic1 Geo Generic 40 315 291 0.00 105.00 131.70
Total 945
Table 1: EDGS-2016 geothermal generation stack (source: MBIE, 2016)
The MBIE’s EDGS models supposedly build the lowest LRMC plants first (many of which are geothermal
– see Figure 1 below), but from the above geothermal generation stack, it can be seen that some of
the fully consented plants (several now built or under construction) actually have higher LRMC than
3some of the other projects, still under consideration. It is therefore apparent that for geothermal
plants in New Zealand cost is not the only criterion as to when projects actually get built.
The above geothermal project list adds up to around 945 MWe of new geothermal projects (including
Ngāwhā, Kawerau-TAOM and Tauhara-II presently built or under construction). Many of the long-
term New Zealand electricity modelling scenarios (e.g. Productivity Commission (2018), ICCC (2019),
BEC2060 (2019), include much higher MWe of geothermal in their long-term (2050, 2060) scenarios,
which to the present authors appear unrealistic.
Most of these modelling exercises (including MBIE-EDGS, 2016) have used uniform, average emission
intensities (115 – 130 g CO2 eq./kWh) for historic, as well as future, new geothermal investment plant.
These figures are above the recent average. Recent new emissions data (McLean and Richardson
2019) and conceptual modelling (Van Campen et. al. 2020) show that varying assumptions on
geothermal emissions can have significant impact on the rate, timing and location of future
geothermal investment.
$MWh LRMC of new non-peak generation projects ($2014/MWh)
200
180 Wind
160
Geothermal
140
120 Hydro
100
Other
80
60 Gas baseload
40
Coal
20
0
Lignite
10000
0
2000
4000
6000
8000
Cumulative GWh for renewables and price indicator line for thermals
Figure 1: LRMC of new non-peak RE-generation according to EDGS-2016 (source: MBIE, 2016)
It is now timely to update the 2016 MBIE geothermal generations stack. Since then several
developments have taken place:
- No large new plants have been built or retired, but one new smaller project has been built:
the Te Ahi O Maui (TAOM) geothermal plant is a partnership between the Kawerau A8D Ahu
Whenua Trust and Eastland Generation. It uses both an older well previously drilled by the
New Zealand government, and several new dedicated wells. The plant, commissioned in
September 2018, is the latest generation of Ormat binary cycle technology and is delivering
25 MWe;
4- An expansion of the binary-only project at Ngāwhā in Northland by 50 MW has been
consented. The first phase (25 MWe) is still at the drilling and civil works stage, but can be
regarded as firmly committed, with a commercial operation date (COD) of mid-2021. The
remaining, second phase is expected to be installed by 2026 at the earliest;
- The current government has introduced the Climate Change Response (Zero Carbon)
Amendment Bill (2019) and presented ambitious plans to decarbonize the economy and the
electricity sector, including aiming for significant electricity demand rise from electric vehicles.
This is likely to significantly increase demand for renewable energy projects, including
geothermal. It is important therefore to have a more updated, detailed view of the
geothermal projects available.
52. Present generation, regulations and emissions
2.1. Present geothermal generation and location
Most of New Zealand’s known high enthalpy geothermal resources are located in the Taupō Volcanic
Zone (TVZ) in the central North Island, apart from the single occurrence in Northland at Ngāwhā near
Kaikohe (Figure 2). Because of the decentralized nature of the geothermal regulatory regime under
the Resource Management Act (RMA 1991), these high enthalpy systems fall under three different
regional regulatory regimes: Waikato Regional Council (with around 70% of the geothermal
resources), Bay of Plenty Regional Council (around 25%) and Northland Regional Council (Ngāwhā
only).
Figure 2: Map of New Zealand’s high temperature geothermal resources (source: NZGA/GNS, 2019)
6Geothermal generation in New Zealand started in the late 1950s and has grown over the decades,
with a strong new surge since the mid-2000s (see Table 2 below) to a total of 1,010 MWe after the
commissioning of the most recent Te Ahi o Maui plant in 2018. More plants are under construction.
Most of these geothermal systems were well explored by government drilling programmes from the
1950s-1970s, before electricity markets were deregulated and privatized. Most of the geothermal
power developments until recently have been in the Waikato Region, with resources/power plants
generally located close to the central transmission lines. With the notable exception of Kawerau,
geothermal systems in the Bay of Plenty region have been less developed, partially due to private/Iwi
landownership and restrictions in access, and partly due to the protection of geothermal surface
features. Hence less is known and more systems are classified as ‘conditional/limited development’
in Bay of Plenty (see 2.3). These systems also tend to be more remote and some transmission
upgrades might be needed to integrate any developments into the main grid.
Many of the present geothermal plants were (re)consented in the 2010s for up to 35 years, and will
have their consents expire around 2040-50. The first consents to expire are for Mokai (2024) and
Wairakei A and B/Te Mihi in 2026. This has generally been included as a decommissioning in electricity
modelling exercises like MBIE-EDGS (2016), but a different approach has been taken here. Mokai and
Wairakei A&B have been assumed to continue at around the same capacity or replaced by a similar
capacity. For example, in the case of Wairakei either by fully reconsenting Wairakei A and B stations,
re-configuring them with a smaller output and/or adding a third unit at Te Mihi. In effect, this would
cancel out the ‘decommissioning’ of Wairakei A and B, and is therefore not seen as a separate project.
For project consents expiring in the 2040s and beyond it is very uncertain what might happen, but it
has generally been assumed that projects will continue. If the requirement is to model the
decommissioning of geothermal plant explicitly, then these projects need to be studied and modelled
separately, but this is outside the scope of this work.
2.2. Outline of geothermal technology
Technology choices have environmental impacts that may affect the timing and feasibility of a project.
There are a number of different possible plant configurations for converting geothermal heat to
electricity. A range of these have been adopted in New Zealand, more so than in some other countries.
The originally-installed capacity of some of the power plants was greater than at present.
The reasons for the range are partly technical, in that the applicable temperature ranges of binary
plants and condensing turbines are different, but they have also been driven by regulatory issues and
consideration of environmental effects, which have changed greatly over time (Lawless et al. 2016).
The biggest differences in the effects of different types of plant configurations are in the waste
disposal and cooling systems adopted. The oldest plants, Wairakei and Kawerau, did not initially adopt
reinjection of separated brine but rather disposed of brine to rivers, though in both cases that has
since been reduced by partial reinjection (80% in the case of Wairakei). Condensing steam turbines
often use water passing through evaporative cooling towers (either natural draft or mechanical draft)
to maintain condenser vacuum. Therefore, a proportion of the steam condensate is lost to
evaporation rather than injected. In the special case of Wairakei, the Waikato river is used for direct-
contact cooling which results in contamination of the river. Binary plants usually use air cooling
systems, and so conserve water for reinjection. although in some circumstances the cooler reinjected
fluid and the fact that the reinjection load is increased, can produce a problem with reservoir cooling.
7Current
Plant COD Steam Supply Prime Mover Cooling
MW
Wairakei A&B 1958 127 Triple flash BPT & CST Water (river)
Kawerau 1966 8 Single flash BPT None *
Natural draft
Ohaaki 1988 57 Double flash BPT & CST
evaporative water
Kawerau binary 1989 &1993 4 Bottoming, retrofitted Binary Air
Wairakei BP 1996 19 (Topping) Triple flash BPT Water (river)
Mechanical
Poihipi 1996 50 Dry steam CST evaporative water
Rotokawa + extension 1997 & 2003 35 Single flash Combined cycle Air
Ngāwhā 1998 & 2008 25 IP steam and brine Binary Air
Wairakei binary 2004-2005 14 None - bottoming Binary Air
Mokai 1999, 2005, 2007 112 Single flash Combined cycle Air
Mechanical
Kawerau (KGL) 2008 & 2017 107 Double flash CST evaporative water
Kawerau-GDL 2008 8 None - bottoming Binary Air
Mechanical
Triple flash
Rotokawa - Nga Awa Purua 2010 140 CST evaporative water
Tauhara - Te Huka 2010 28 IP steam and brine Binary Air
Mechanical
Kawerau (TOPP1) 2013 21 Double flash CST evaporative water
Ngatamariki 2013 82 IP steam and brine Binary Air
Mechanical
Te Mihi
2014 166 Double flash CST evaporative water
Kawerau-Te Ahi O Maui 2018 25 IP steam and brine Binary Air
Total 1028
Table 2: Geothermal plant and generation technologies in New Zealand. Capacities are installed capacity, not necessarily
original capacity nor current generation e.g. Ohaaki was originally 108 MW, installed capacity is now 57 MW, currently
produces around 40 MWe. (source: NZGA, 2019 and authors’ input)
* Exhaust steam is used for industrial process heat
Mass loss through evaporation rather than returning it to the reservoir will generally reduce the
amount of pressure support provided by reinjection (though it could avoid enthalpy decline). Thus,
reservoir pressures can be expected to decline faster than would otherwise be the case. That in turn
could lead to accelerated production decline (arguably lesser sustainability) and unwanted surface
effects such as changes in thermal activity and subsidence.
The possibility of such effects was a significant factor in the adoption of a binary-only (i.e. no steam
turbines) plant and full reinjection at the recent Ngatamariki plant. It remains to be seen whether
this will be a major consideration for future power schemes, though it should be noted that the
plant selection in that case was voluntary on the part of the developer and there is no suggestion
that such should be in effect made mandatory through resource consent conditions. Wider
consideration of this issue would favour binary-only plants over condensing steam turbines which
would lead to an increased project cost per MW. On the other hand, for high enthalpy fields,
combined cycle plants such as Mokai and Rotokawa with steam turbines exhausting into binary
condensers can be very efficient and cost effective.
8Type Size CAPEX/MW Thermodynami Water Other issues
c efficiency conservation
Back Small to mid- Cheapest Low when stand- Lowest If stand alone, most
pressure range alone applicable at remote
turbine (BPT) locations (e.g. single
well) and/or early
stage resource testing
Condensing Largest Next High, but require Low if using Very efficient if using
steam turbines cheapest high grade evaporative multiple flash,
turbine (CST) resource cooling economies of scale
Binary Small and Most Not very High Can be used for small
modular expensive efficient per se, individual projects or
but can make larger modular
use of lower combinations
grade resources
Combinations Depends on Intermediate Can be very High Various configurations
combinations, efficient overall possible including
generally retrofitting
larger overall
Table 3: Characteristics of different plant types (source: Lawless et al, 2016)
2.3. Regulatory environment and impacts on development timing and feasibility
Classification and preservation of geothermal systems
The situation regarding regulation and classification of geothermal systems in New Zealand is complex
and differs from the regime in many other countries. The discussion here does not purport to be
exhaustive or definitive, but touches on a number of issues that need to be taken into account when
considering the course and especially the pace of further geothermal electricity development in this
country.
Geothermal resources in New Zealand are managed under the Resource Management Act 1991
(RMA). Previous analyses of the likely Generation Stack have been based principally on the long run
marginal cost (LRMC). That is logical, and LRMC is a key parameter, but it does not explicitly take into
account the geothermal regulatory environment in New Zealand. One of the fundamental principles
of the RMA is that of sustainable management, which in the geothermal context has been variously
interpreted to mean:
A proportion of New Zealand’s geothermal systems should remain undeveloped, or with
limited development, in order to protect or manage their intrinsic scientific, landscape,
ecological and cultural value. Other, “development” systems can be developed, although still
within the context of sustainable management. This has led to the classification of all
geothermal systems in the TVZ from Protection to Development, as described further below;
Even in systems where development is provided for, the rights of future generations should
be taken into account. Therefore, while extraction can exceed renewability in the short term,
a proportion of the resource must remain at the end of the consent period;
Even in systems where development is provided for, untoward surface effects should be
avoided, mitigated, or remedied as for any project. That can include effects on significant
surface geothermal features, but also other external effects such as subsidence and
hydrothermal eruptions.
9Both regional and district councils have roles and responsibilities relating to geothermal
developments. Regional Councils have the function of managing the take and use of geothermal fluid
and energy, and discharges to the environment, while district councils have a role managing the
effects of the use of land (e.g. earthworks, infrastructure, structures etc.). Most of New Zealand’s
geothermal resources are managed by the Waikato and the Bay of Plenty Regional Councils. The
Northland Regional Council manages the Ngāwhā geothermal system.
Since the introduction of the RMA, there has so far been little direction from central government on
geothermal development. There has been a National Policy Statement on renewable electricity
generation (2011), but in the view of the present authors it lacks specificity.
The RMA framework is specified by the regional councils in their Regional Policy Statements (RPS),
and specific policies and rules for activities within regional plans. The Waikato and Bay of Plenty
Regional Policy Statements take a broadly similar approach to sustainable management of geothermal
resources through classification of systems. Both have adopted a similar classification system for
geothermal areas. That for Waikato Regional Council is as follows:
“Classification is based on ranking each system’s characteristics and aims to balance
development with the protection of highly valued surface features. There is a different
management approach for each category.
In areas classified for Development, large-scale uses are allowed as long as they are
undertaken in a sustainable and environmentally responsible manner.
In Limited Development systems, takes that will not damage surface features are allowed.
Research systems are those where not enough about the system is known to classify it as
either Development, Limited Development, or Protected. In these systems, only small takes
and those undertaken for scientific research into the system are allowed.
Protected systems contain vulnerable geothermal features valued for their cultural and
scientific characteristics. Their protected status ensures that their underground geothermal
water source cannot be extracted and that the surface features are not damaged by
unsuitable land uses.
Small systems are isolated springs or sets of springs. These can only sustain small takes and
are not suitable for electricity generation” (WRC 2019).
Bay of Plenty Regional Council has a very similar classification policy with some differences in
terminology.
A significant proportion of New Zealand’s high temperature geothermal resources are currently fully
or partially protected from development. Lawless (2005) estimated that proportion to be 40-70%
depending on what assumptions are made. While some of the resource capacity estimates in that
paper need to be updated, the general conclusion remains valid.
Hence, a significant portion of the remaining resources are in categories which mean in effect that
only very limited development is possible pending further investigation, for example to demonstrate
whether abstraction would adversely affect significant surface features. It would, however, be
possible to develop a conditional or limited development system provided adverse effects on surface
features are avoided, remedied or mitigated. In “Development” systems, consenting (or reconsenting)
10would likely be via a notified consent process, hearings and potentially appeals, and can be a
protracted process.
It is possible to change the classification status of a system, most likely through a regional plan change
process, for example from “Research” to “Development” or “Conditional Development” to
“Development” if new information becomes available, but that has not been done so far and may turn
out to be a protracted process in practice.
Thus, absent a major revision of the RMA and/or a retreat from the principles of sustainability (which
seem unlikely within the time frame considered), there could be consequent delays in obtaining
consents for projects, especially where a change in their status needs to be taken into account as well
as their cost. There are likely to be geothermal projects which ultimately have a reasonably low LRMC
but which we know will be delayed by many years by the regulatory requirements.
The cost of delay could be taken explicitly into account by considering both the probable escalation in
major cost components1 and the financial effect of delay on the Net Present Value (NPV). That is the
methodology adopted in the recent work by GT Management for example (GT 2019). However, the
existing MBIE EDGS/GEM-model does not work that way and so for consistency with other renewable
sources which are being considered in parallel to but outside this study, the possible timing of projects
due to regulatory issues has been estimated, but has not been used to determine the LRMC.
Central government policy affecting geothermal development
Although allocation and management of geothermal resources takes place at the regional level, under
the RMA National Policy Statements (NPS) can provide national guidance and must be given effect by
RPS and regional plans.
As well as the existing NPS on renewable electricity generation (2011), the forthcoming draft NPS on
Biodiversity may be relevant to geothermal development. This is presently under development and
open for consultation. As presently worded, it would require strict preservation of geothermal
ecosystems and biodiversity in every geothermal system, even within geothermal systems classified
for development. The regional authorities have expressed the view that if passed in its present form
it could preclude all further geothermal development and/or the reconsenting of existing projects
even in “Development” systems.
Another potential concern is fresh water regulation. Geothermal energy is regulated as “water” under
the RMA. There is currently debate at a national level and development of policy relating to ownership
and administration of natural fresh water. That could lead to some uncertainty for future geothermal
development, especially around the aspect of royalties.
An area where the lack of involvement by central government is detrimental to geothermal
development in the view of the present authors, concerns the collection of exploration data. The way
in which access to geothermal resources, and the data resulting from geothermal exploration are
handled is in contrast to how minerals and petroleum are handled in New Zealand. Access to and
allocation of mineral resources is covered under the Crown Minerals Act (CMA 2010). A company can
apply for a Prospecting Permit or Exploration Licence over a specific area, and for a limited time. They
then have priority in terms of applying for a mining license (although not an automatic right to obtain
one). To keep their exploration right they have to fulfil a minimum programme of work and file regular
1Escalation of the several major cost components of a geothermal project is not straightforward, as they are controlled by different
factors. For example, the cost of pipelines etc. depends on world-wide steel prices, but the cost of drilling is far more dictated by the cost
of oil and hence demand for drilling rigs. For the present purposes an overall figure of 2.2% has been used, being an approximation to US
PPI.
11reports with New Zealand Petroleum and Minerals. That information enters the public domain after
an embargoed period. A very similar situation applies to petroleum, except that specific areas are
more often offered for tender by the Government rather than being granted in response to
exploration company initiatives.
In both those cases, the information that is collected about our natural resource endowment becomes
part of our national inventory, to the benefit of the country as whole. Most countries have a generally
similar regime for both mineral and geothermal resources.
In contrast, it is not possible in New Zealand to obtain priority of access during exploration to
geothermal resources, since those are allocated under the Resource Management Act. The only way
a company can obtain rights/consents to use geothermal energy is to obtain a resource consent to
extract it from a particular area. However, to obtain a resource consent requires a thorough
application which not only has to cover environmental effects, but also issues of sustainability. This
means that the applicant has to have a good idea of the size of the resource and how it could be
developed. This in turn, means that for a company to obtain a resource consent for geothermal
development, they need to undertake a thorough investigation at a minimum cost for geophysical
surveys of hundreds of thousands of dollars, and probably drilling at a cost of tens of millions of dollars,
but with no right of priority or access. Since geothermal exploration carries no rights of priority, there
is a strong incentive for the data collected to remain confidential. Hence, unlike petroleum and
minerals exploration, New Zealand Petroleum and Minerals (nor any other central agency) does not
collect information generated during the exploration phase, nor do they make any effort to collate or
publish existing data to attract investment. Regional Councils collect only data generated during the
exercising of a resource consent, which may come many years after exploration, by different parties,
or not at all.
Other issues that arise from the legal/regulatory environment and could also affect the timing or
feasibility of projects include the following.
Multiple operators
A feature of both the Waikato and Bay of Plenty regional policies is that multiple operators with
separate take and discharge consents are allowed on a single geothermal resource/system, e.g. there
are presently four developers on the Kawerau system. That is unusual on a world scale. It can and
has led to complications and delays, although it can also lead to opportunities for collaboration and
flexibility. The over-production and consequential severe decline of the Geysers geothermal resource
in the USA was a consequence of multiple tapper access, which was only resolved when one single
operator effectively remained in operation and took steps to recover the reservoir pressure through
supplementary injection.
Status of landowners
Landowners do not own underlying geothermal resources. However, they do control access to them,
so in practice, they have a considerable de-facto degree of control. That can lead to delays and
complications especially where there are multiple landowners over a particular resource/system.
Maori interests
Maori are involved in geothermal projects in several different ways, some of which at times can have
conflicting objectives. Some of these are:
As landowners. In practice, the land overlying many of our geothermal resources belongs to
Maori trusts. There is a range of models of engagement ranging from the Mokai project where
12the Tuaropaki Trust took the lead role and initially was the sole owner of the power scheme,
to those where the landowners are more passive and just receive a royalty.
As kaitiaki of the resource. A guardianship role for Maori is explicit in the RMA (and in some
Statutory Acknowledgements), but precisely what that means and who is responsible can
sometimes be unclear. In places, the local Maori landowners also are accepted as having the
mandate for kaitiakitanga, but in other areas, arrangements may be different or more
commonly overlapping.
As claimants to be owners or users of the resource. Under the Geothermal Energy Act (1953),
it was stated clearly that: “The sole right to tap, take, use, and apply geothermal energy on or
under the land shall vest in the Crown.” Ownership of some resources has however been
challenged with a number of Waitangi Treaty claims, some of which are unresolved, and some
of which have been brought by wider parties than the specific landowners. While in no case
has actual ownership of the resource been transferred to Maori as part of a Waitangi Tribunal
settlement, the Crown has in cases recognized access to the resource and ownership of assets
such as wells. For example, in the case of Ngāti Tūwharetoa Geothermal Assets (NTGA) at
Kawerau (a wholly owned subsidiary of Ngāti Tūwharetoa Settlement Trust), as holders of
Statutory Acknowledgements by the Crown, Ngāti Tūwharetoa (Bay of Plenty) is recognised
by the Crown as having particular cultural, spiritual, historical, and traditional association with,
and use of, the geothermal energy and geothermal water located in the Kawerau Geothermal
System.
Past history has shown that Maori landowners are not averse to geothermal development in principle
and have acted as a springboard in many cases, although experience suggests that Maori landowners
are more likely to take a long term and holistic view of the resource than a more strictly economically-
driven developer. The combination of the above factors, the tensions between them, and
complexities of land ownership can lead to delays that need to be considered in the potential timing
of new geothermal generation projects.
Safety Regulations
There is a general view in the industry that recent revisions in national safe working, in some cases,
do not take account of the specifics of geothermal operations, and can be a hindrance to development.
The leading developers are, however, working pro-actively with MBIE on rationalising these aspects
and longer-term this will hopefully not lead to delays.
No attempt has been made to take all the above-mentioned issues into account for specific projects
in this report, but they need to be considered as representing possible factors in lower geothermal
growth/availability scenarios.
2.4. Greenhouse gas emissions
Geothermal generation is not free of Green House Gas (GHG) emissions as the produced underground
fluids contain many dissolved, non-condensable gases, especially carbon dioxide (CO2) and hydrogen
sulphide (H2S), and in some cases traces of methane (CH4) (ESMAP, 2016). The CO2 and CH4 are GHGs.
A large part of these GHGs will be emitted to the atmosphere, even if the majority of the produced
fluids is subsequently reinjected into the ground. Geothermal power plants have to account for their
GHG emissions by closely monitoring/sampling the emissions from their produced vs their reinjected
fluids (e.g. under the NZ Emissions Trading Scheme - ETS).
Geothermal fluids and reservoir rocks vary considerably from field to field, as well as variations in
power plant technology (low-temperature, closed loop binary systems), efficiency, reinjection,
management, etc. Hence emission intensity (generally expressed as g CO2/kWh or g CO2eq/kWh)
13varies significantly, from 18-21 g CO2eq/kWh for some Icelandic plants and Wairakei in New Zealand,
to 1,640 gCO2 /kWh in Alasehir-Kavaklidere, Turkey (Layman (2017). Bertani and Thain (2002)
calculated a weighted world average of around 122 g CO2eq/kWh.
In comparison, GHG emissions for fossil-fuel fired power plants are closely monitored and reasonably
standardized/similar around the world, with around 390 g CO2eq/kWh for CCGT and 955 g CO2eq/kWh
for coal-fired generation (McLean and Richardson 2019).
In contrast to many renewable energy plants, geothermal plants provide baseload generation, with
capacity factors of 90-95% or more, particularly in New Zealand. Hence most geothermal power plants
will replace much higher emitting baseload fossil-fuel generated electricity and serve to reduce
emissions significantly. In terms of life-cycle emissions geothermal power plants tend to have lower
life-cycle emissions (excluding direct, operational, field emissions) than solar PV, but higher than wind
(IPCC 2014).
Until recently, limited geothermal field emissions data was publicly available in New Zealand. What
was publicly available, were aggregated data from MBIE on fugitive emissions from the geothermal
power generation sector. This resulted in an estimated average of 115-130 g CO2eq/kWh over recent
years. As those were the only available, public data sources, these were the data used in several
recent modelling efforts for New Zealand’s future low-emission electricity/energy sector, including
BEC (2015), MBIE-EDGS (2016), Vivid (2017), Sapere (2018), Productivity Commission (2018), ICCC
(2019). In general, these studies acknowledged a variation of emissions between different existing
plants (from 32 – 597 gCO2/kWh), but they generally modelled (future) geothermal investments with
a single constant emission intensity of 115 (BEC-2015, MBIE-2016) – 130 (ICCC, 2019) g CO2eq/kWh.
Recently, however, the NZ Geothermal Association managed to gather confidential company
emissions data and publish almost 10 years’ worth of geothermal emissions data (McLean and
Richardson 2019 – see Annex 2 for details). Relevant conclusions from this review include:
1. The mw-weighted average emissions intensity in 2018 was estimated at 76 g CO2eq/kWh. This
was down from 91 g CO2eq/kWh in 2015. As a cross-check that can be compared to a figure
for Indonesia (where all resources tapped are volcanic, similar to New Zealand) of 63 g
CO2eq/kWh (Yuniarto et al. 2015);
2. A large variation in emission intensities between fields: in 2018 from 21 gCO2eq/kWh for
Wairakei A&B to 341 g CO2eq/kWh for Ohaaki;
3. All NZ geothermal field/plant emissions are considerably lower than gas- or coal-fired
emissions (at 390, and 955 g CO2/kWh respectively, see Figure 3 below);
4. A general, long-term trend towards lower emission intensities for each individual field, as well
as in aggregate, weighted average (see point 1). For individual fields at times long term
degassing trends might be interrupted by new wells taken into production, added capacity or
operational changes;
5. Generally lower emissions intensity for newer, more efficient geothermal plants.
The NZGA data is detailed and seems accurate, but the emissions intensity averages and totals do not
seem to match data from MBIE (fugitive emissions from geothermal generation going back to 1990).
This would need further comparison and investigation.
14Figure 3: Graphical chart comparing the operational emissions intensity of geothermal power stations in New Zealand to
other types of electricity generation (source: McLean and Richardson 2019)
For the present modelling purposes, a semi-quantitative approach is proposed, classifying (new)
geothermal plants in 4 categories. The cost implications are discussed in 3.4:
- Very low emissions (< 40 g CO2eq /kWh)
- Low emissions (40 –80 g CO2eq/kWh)
- Medium emissions (80 –150 g CO2eq/kWh)
- High emissions (> 150 g CO2eq/kWh)
For the long-term future (especially under high carbon price scenarios), improved technologies, higher
efficiencies, better reinjection management and even Carbon Capture and Storage (CCS) are all
options to further reduce geothermal emissions. CCS for geothermal is likely to be easier/cheaper
than for some power sources as the sequestration area (the geothermal reservoir that the fluid and
emissions came from originally) is co-located with the power station; much more so than for most coal
or gas-fired power plants. Additionally, the gas stream to be processed is predominately CO2, rather
than a nitrogen/CO2 mix in a fossil fuelled plant.
15Although a separate issue from GHG, it is noteworthy that New Zealand has some of the most
permissive air emission limits for toxic geothermal gasses in the world2, most notably H2S. Elsewhere
where tougher limits apply, geothermal plants have continued to operate economically despite H2S
removal being required (e.g. in the USA).
2Noting again that resource consent conditions in New Zealand are region, and project, specific, not in accordance with an overall national
standard.
163. Methodology adopted for estimating CAPEX and OPEX
3.1. CAPEX
Estimating costs for future geothermal investments faces many uncertainties and the variation in
capital costs (CAPEX) can easily be as much as 20-30% depending on project specifics. When using
publicly declared costs of projects, project-specific issues need to be considered. CAPEX can also vary
depending on the financial assumptions with regard to how sunk costs are treated. For example, some
of the existing projects took over several highly productive historical wells drilled by the government
decades before, but at significantly less than replacement cost. Given the very long history of some
New Zealand projects before COD, the differences can be significant.
The NZ dollar exchange rate can also have a significant effect as a large portion of the project cost
consists of overseas components, as discussed below. For the present study, an exchange rate of 0.65
to the US dollar is assumed (slightly higher than the rate at time of writing), but noting that this has
varied by at least 15% over the past decade. Therefore, CAPEX can be reasonably accurately estimated
for plants in the near future when the project is well-defined, but becomes less clear for projects in
the more distant future. However, experience indicates that changes in exchange rates are to a large
extent cancelled out by changes in national inflation rates, and it is therefore appropriate to undertake
all long-term cost estimating in a single currency.
GT Management (2019) produced a detailed Production Cost Model, which incorporates a large
number of factors to estimate geothermal CAPEX. That model has the advantage of having been based
on extensive consultation with the international industry, and peer review by the World Bank. It was
originally developed using funding from the New Zealand Ministry of Foreign Affairs and Trade (MFAT).
While that modelling was specific to Indonesia, and some of the specific costs and financial
assumptions (WACC, IRR) will differ from those in New Zealand, it included a number of useful
empirical cost correlations which are used here.
As in many energy projects, there is a tension in geothermal projects between the desire by developers
and regulators on the one hand to proceed cautiously in a staged or modular fashion, and the fact that
the cost of geothermal power projects has significant economies of scale. That applies particularly to
the power plant cost: the number and cost of wells and SAGS (steamfield above ground system) tend
to be more simply, linearly dependant on the MW. The effect of size on power plant cost was
quantified by GT Management (2019), based in part on earlier work by SKM (2009). That correlation
was developed further with Indonesian cost data and extensive feedback from developers.
While the correlation is specific to Indonesia, it should also be applicable in New Zealand to a sufficient
degree of accuracy for the purposes of this report. It has been used in developing the capital cost
estimates, assuming that the power plant is roughly 40% of the total project cost.
Figure 4 shows three correlation ratios/formulas, in case multiple plants/units are ordered or built
around the same time. For the present report, the single unit correlation is used unless stated
otherwise. The authors have assumed that the remaining 60% CAPEX has a fixed cost per MWe, and
that it scales linearly with MW capacity.
17You can also read