ENERGY STRATEGY REPORT - YORKDALE SHOPPING CENTRE SITE - Yorkdale Master Plan
←
→
Page content transcription
If your browser does not render page correctly, please read the page content below

OXFORD PROPERTIES GROUP

ENERGY STRATEGY REPORT
YORKDALE SHOPPING CENTRE SITE

NOVEMBER 24, 2017

PHOTO COURTESY OF OXFORD PROPERTIES GROUP

ENERGY STRATEGY
REPORT
YORKDALE SHOPPING
CENTRE SITE
OXFORD PROPERTIES GROUP

PROJECT NO.: 171-13021-00
DATE: SEPTEMBER 2017

WSP
2300 YONGE STREET
SUITE 2300
TORONTO, ON
M4P 1E4

TEL.: 416-487-5256
FAX: 416-487-9766
WSP.COM

SIGNATURES

PREPARED BY

Kristen Jaczko, M.A.Sc., LEED GA
Project Associate

REVIEWED BY

Eric Chisholm, P.Eng., CEM, LEED AP
Project Manager

COMMUNITY ENERGY STRATEGY REPORT               WSP
Project No. 171-13021-00              November 2017
OXFORD PROPERTIES GROUP                      Page i

1          EXECUTIVE SUMMARY .................................................... 1
TABLE OF
CONTENTS                           2          INTRODUCTION .................................................................. 2
                                   2.1        PURPOSE ................................................................................................2

                                   3          BACKGROUND .................................................................... 3
                                   3.1        YORKDALE SHOPPING CENTRE ...................................................3

                                   3.2        NEIGHBOURHOOD ............................................................................. 5

                                   3.3        UTILITIES ................................................................................................ 6

                                   4          BASELINE ENERGY PERFORMANCE ....................... 7
                                   4.1        BASELINE CASE ...................................................................................7

                                   4.2        POTENTIAL ENERGY REDUCTIONS ............................................ 9

                                   4.3        SYSTEM SIZING ................................................................................. 10

                                   4.4        FUTURE READY DESIGN.................................................................. 11

                                   5          EVALUATION CRITERIA ................................................. 11

                                   6          HIGH PERFORMANCE OPPORTUNITIES .............. 12
                                   6.1        ANALYSIS OF SELECTED STRATEGIES .................................... 13

                                   7          FUNDING OPTIONS ..........................................................17
                                   7.1        DISTRICT-LEVEL EFFICIENCY INITIATIVES ............................ 17

                                   7.2        BUILDING-LEVEL EFFICIENCY INITIATIVES ..........................20

                                   8          NEXT STEPS ........................................................................ 21

                                   TABLES
                                   TABLE 1: EMISSIONS FACTORS AND ENERGY PRICES
                                                  USED IN THIS REPORT ............................................................... 6
                                   TABLE 2: THE DIFFERENCE OF THE END-USE
                                                  BREAKDOWN PERCENTAGES FOR
                                                  OPTIONS 2 AND 3. ......................................................................... 8

COMMUNITY ENERGY STRATEGY REPORT                                                                                                                      WSP
Project No. 171-13021-00                                                                                                                     November 2017
OXFORD PROPERTIES GROUP                                                                                                                             Page i
TABLE 3: HEATING SYSTEM SIZES ........................................................................ 10
                                   TABLE 4: COOLING SYSTEM SIZES ....................................................................... 10
                                   TABLE 5: ELECTRICAL AVERAGE MONTHLY PEAK
                                                 DEMAND ............................................................................................ 10
                                   TABLE 6: OPPORTUNITY TABLE .............................................................................. 12
                                   TABLE 7: EXPECTED SYSTEM ENERGY IMPACT ......................................... 14
                                   TABLE 8: EXPECTED SYSTEM ENERGY IMPACT ......................................... 14
                                   TABLE 9: EXPECTED SYSTEM ENERGY IMPACT ......................................... 15
                                   TABLE 10: EXPECTED SYSTEM ENERGY IMPACT FOR
                                                 OPTION 1 ............................................................................................. 16
                                   TABLE 11: EXPECTED SYSTEM ENERGY IMPACT FOR
                                                 OPTION 2 ............................................................................................ 16
                                   TABLE 12: EXPECTED SYSTEM ENERGY IMPACT FOR
                                                 OPTION 3 ............................................................................................ 17
                                   TABLE 13: CLIMATE CHANGE ACTION PLAN INITIATIVES ................. 17
                                   TABLE 14: HEATING SYSTEM SIZES FOR OPTION 2 .................................... 6
                                   TABLE 15: COOLING SYSTEM SIZES FOR OPTION 2 ................................... 6
                                   TABLE 16: ELECTRICAL AVERAGE MONTHLY PEAK
                                                 DEMAND FOR OPTION 2 .......................................................... 7
                                   TABLE 17: HEATING SYSTEM SIZES FOR OPTION 3 .................................... 7
                                   TABLE 18: COOLING SYSTEM SIZES FOR OPTION 3 ................................... 7
                                   TABLE 19: ELECTRICAL AVERAGE MONTHLY PEAK
                                                 DEMAND FOR OPTION 3 .......................................................... 7

                                   FIGURES
                                   FIGURE 1: OPTION 1 (RESIDENTIAL) CONCEPT PLAN FOR
                                                  SUBJECT PROPERTY ................................................................... 4
                                   FIGURE 2: OPTION 2 (OFFICE) CONCEPT PLAN FOR
                                                  SUBJECT PROPERTY ................................................................... 4
                                   FIGURE 3: OPTION 3 (NORTHERN MALL EXPANSION)
                                                  CONCEPT PLAN FOR SUBJECT PROPERTY ................ 5
                                   FIGURE 4: DEVELOPMENT AND NEIGHBOURS WITH
                                                  POTENTIAL FOR ENERGY EXCHANGE OR
                                                  SYNERGIES ......................................................................................... 6
                                   FIGURE 5: ESTIMATED END-USE BREAKDOWN FOR
                                                  OPTION 1 (WHOLE DEVELOPMENT) ................................. 7
                                   FIGURE 6: ESTIMATED END-USE GHG EMISSION
                                                  BREAKDOWN OPTION 1 (WHOLE
                                                  DEVELOPMENT) .............................................................................. 8
                                   FIGURE 7: RANGE OF POTENTIAL TOTAL ENERGY
                                                  CONSUMPTION ............................................................................... 9
                                   FIGURE 8: RANGE OF POTENTIAL CARBON EMISSIONS ....................... 9

COMMUNITY ENERGY STRATEGY REPORT                                                                                                                       WSP
Project No. 171-13021-00                                                                                                                      November 2017
OXFORD PROPERTIES GROUP                                                                                                                             Page ii
FIGURE 9: TORONTO'S FUTURE WEATHER (SOURCE: CITY
                                                  OF TORONTO WEBSITE AND “TORONTO’S
                                                  FUTURE WEATHER AND CLIMATE DRIVER
                                                  STUDY, 2011”) .................................................................................... 11
                                   FIGURE 10: EMERGENCY POWER FOR RESILIENT
                                                  BUILDINGS (SOURCE: CITY OF TORONTO) ................ 12
                                   FIGURE 11: THE ENERGY INTENSITY AND EMISSIONS
                                                  INTENSITY IMPACT FOR THE 2ND
                                                  DEVELOPMENT OPTION (OFFICE). .................................... 5
                                   FIGURE 12: THE ENERGY INTENSITY AND EMISSIONS
                                                  INTENSITY IMPACT FOR THE 3RD
                                                  DEVELOPMENT OPTION (MALL
                                                  EXPANSION). ..................................................................................... 6

                                   APPENDICES
                                   A           METHODOLOGY
                                   B           ESTIMATES OF ENERGY USE
                                   C           DETAILED OPPORTUNITY DESCRIPTIONS
                                   D           UTILITIES CURRENT AND FUTURE ENERGY CONTEXT
                                   E           LIMITATIONS
                                   F           REFERENCES

COMMUNITY ENERGY STRATEGY REPORT                                                                                                                    WSP
Project No. 171-13021-00                                                                                                                   November 2017
OXFORD PROPERTIES GROUP                                                                                                                          Page iii
1       EXECUTIVE SUMMARY
Oxford Properties Group retained WSP to undertake an Energy Strategy assessment for the lands known as the “Yorkdale
Lands”. The Yorkdale Lands are bordered by Dufferin Street to the west, Yorkdale Road to the north and east and a low-
density residential neighbourhood to the south. The site is approximately 30 hectares in size, and includes the existing
shopping centre (250,000 m²), adjacent office building, and GO bus terminal (9,125 m²) and is connected via an elevated
pedestrian passageway to the Yorkdale TTC Subway Station. Three conceptual land uses scenarios were submitted with
the applications which propose potential development of the Yorkdale Shopping Centre site over the next 20+ years. The
three land use concepts propose a similar configuration along the Dufferin Street frontage. Each option differs in the
manner in which proposed residential, office, hotel and retail development address Yorkdale Road to the north of the site.
The purpose of this Energy Strategy is the early identification of opportunities to integrate energy solutions that are
efficient, low carbon and resilient.
Oxford Properties Group is currently considering three conceptual block master plan options that comprise of a range of
retail, office, hotel and residential uses and an internal private street. As a result, the design of this site remains
preliminary.
We evaluated 30 energy, carbon, and resilience strategies of potential benefit for the proposed development. These were
compared using a matrix analysis approach. Four strategies have significant potential or interest for this development
site, and were analyzed more deeply. These were:
—   Low Window-to-Wall Ratios
—   Geo-Exchange Systems
—   Thermal Energy Storage
—   District Energy Thermal Energy Network
Development Option 1 (residential) is predicted to have lower energy consumption and the impact of the first three
measures is investigated for this option only, conservatively reflecting the lowest volume of savings possible from these
measures. The impact of these measures is not expected to change drastically based on the development option that is
pursued; if development reflects Option 2 or Option 3, implementing these measures would save more energy. Thermal
energy storage has the potential reduce the emissions of greenhouse gases but is only a cost and energy saving measure
for retail and office buildings. The energy savings and cost of the last measure listed, District Energy Thermal Energy
Network, is more likely depending on the mix of retail, office, hotel and residential development and the height of these
buildings and as a result this measure was investigated for all three development options.
Together these strategies can potentially reduce building energy use and emissions by more than 50%, when implemented
in collaboration with remaining viable measures. The image below illustrates the energy intensity impact and emissions
intensity impact for development Option 1 (residential), similar figures for the second and third options can be found in
Appendix B.

COMMUNITY ENERGY STRATEGY REPORT                                                                                        WSP
Project No. 171-13021-00                                                                                       November 2017
OXFORD PROPERTIES GROUP                                                                                               Page 1
As outcome of these findings, we recommend next steps towards a low energy/carbon/cost development. This includes
further investigation of design strategy suggested, establishing energy targets and adopting integrated design
methodologies. The contents of this report provide options, for consideration only, during the detailed design
development of this project. Final decisions on what measures are explored and implemented remain with Oxford
Properties Group for the development of the Yorkdale lands.

2 INTRODUCTION
2.1      PURPOSE
The purpose of the Energy Strategy is the early identification of opportunities to integrate local energy solutions that are
efficient, low carbon and resilient. The findings will inform later studies including the Toronto Green Standard Energy
Modelling Report.
The report is intended to align with the City of Toronto’s new Energy Strategy requirement which applies to new
development including residential, non-residential and/or mixed use and may apply to industrial development:
—   With a total gross floor area of 20,000 square metres or more; or
—   Within a Community Energy Plan area approved by Council.
It is required in association with the following application types:
—   Official Plan Amendment;
—   Zoning By-Law Amendment; or
—   Plan of Subdivision.
We understand that the proposed development meets these criteria, and so an Energy Strategy Study is required as part of
the application for zoning by-law amendment and Official Plan amendments.

COMMUNITY ENERGY STRATEGY REPORT                                                                                          WSP
Project No. 171-13021-00                                                                                         November 2017
OXFORD PROPERTIES GROUP                                                                                                Page 2
The Energy Strategy is intended to contribute to achieving the City's objectives to reduce energy consumption and GHG
emissions and become more resilient. Official Plan policy 3.4.18 states that "innovative energy producing options,
sustainable design and construction practises ... will be supported and encouraged in new development … through: d)
advanced energy conservation and efficiency technologies and processes that contribute towards an energy neutral built
environment".
Undertaking an Energy Strategy at the application stage for a Official Plan or Zoning Bylaw Amendment facilitates the
following key outcomes:
—   Opportunity for site buildings to take advantage of existing or proposed energy infrastructure, energy capture and/or
    solar orientation at the conceptual design stage.
—   Consideration of potential energy sharing for multi-building development and/or neighbouring existing/proposed
    developments.
—   Consideration of opportunities to increase resiliency such as strategic back-up power capacity.
—   Identification of innovative solutions to reduce energy consumption in new construction and retrofit of existing
    buildings (if part of new development).
—   Exploration of potential to attract private investment in energy sharing systems.
The contents of this report provide options for consideration during the design phase of development of this project. Final
decisions on what measures are explored and implemented remain with Oxford Properties Group.

3 BACKGROUND
3.1     YORKDALE SHOPPING CENTRE
The Yorkdale lands are bordered by Dufferin Street to the west, Yorkdale Road to the north and east and a low-density
residential neighbourhood to the south. The site is approximately 30 hectares in size, and includes the existing shopping
centre (250,000 m²), adjacent office building, and GO bus terminal (9,125 m²) and is connected via an elevated pedestrian
passageway to the Yorkdale TTC Subway Station.
A Block Master plan with three conceptual land use scenarios have been submitted with the applications which propose
potential development of the Yorkdale Shopping Centre site over the next 20 years. The three conceptual block master
plan options propose to:
—   Establish a network of private internal roads and connections;
—   Include the potential expansion of the existing enclosed Yorkdale Shopping Centre to Dufferin Street;
—   Locate a large Privately Owned Publicly Accessible Space fronting on to Dufferin Street;
—   Reconfigure the existing McAdam Avenue loop to include an intersection with a pedestrian crossing and public park
    at grade; and
—   Conceptually organize additional proposed retail, hotel, office and residential buildings surrounding the edges of the
    site that would range in height from 2 to 30 storeys.
Below are the three proposed development options concept plans.

COMMUNITY ENERGY STRATEGY REPORT                                                                                        WSP
Project No. 171-13021-00                                                                                       November 2017
OXFORD PROPERTIES GROUP                                                                                              Page 3
Figure 1: Option 1 (Residential) Concept Plan for Subject Property

                         Figure 2: Option 2 (Office) Concept Plan for Subject Property

COMMUNITY ENERGY STRATEGY REPORT                                                                    WSP
Project No. 171-13021-00                                                                   November 2017
OXFORD PROPERTIES GROUP                                                                          Page 4
Figure 3: Option 3 (Northern Mall Expansion) Concept Plan for Subject Property 3.2 NEIGHBOURHOOD The area surrounding the Site, south of Highway 401 and north of Lawrence Avenue West is beginning to intensify as a number of mixed use, residential and commercial developments build on the existing, largely low to mid-rise density character of the area. The area is defined by residential neighbourhoods located south of the Subject Property, the 401 highway and Allen Road along the north and east borders respectively, and an industrial and mixed use area to the west. Beyond the 401, there is a number of big box retail storages and a grocery store as well as a data centre and Downsview Airport. Baycreat Arena is located east of Allen Road and the Yorkdale TTC/GO Station is on the south-east corner of the site. From an energy perspective, the following existing and planned uses are adjacent to the Subject Property: West The area west of the site accommodates several commercial and retail buildings, including a hotel. Several residential and office building have either been approved for rezoning or are under consideration. Key neighbours are noted on the map below. COMMUNITY ENERGY STRATEGY REPORT WSP Project No. 171-13021-00 November 2017 OXFORD PROPERTIES GROUP Page 5
Figure 4: Development and Neighbours with Potential for Energy Exchange or Synergies

3.3 UTILITIES
The site is serviced by Toronto Hydro for electricity, Enbridge for natural gas, and by the City for domestic potable water.
An understanding of Ontario-specific factors affecting costs of and carbon emissions from, electricity and natural gas is
important for decision-makers when selecting site energy strategies. A detailed discussion is included in Appendix D.
To simplify calculations, we have prepared this report using the emissions factors and costs for utilities found in the table
below. We have accounted for the cost savings associated with load-shifting & demand response strategies using on-peak
and off-peak consumption pricing and emissions factors, which account for decreased demand charges and the cleaner
electricity generation mix associated with load-shifting & demand response strategies.

Table 1: Emissions Factors and Energy Prices Used in this Report

                                                 G CO2E/KWH             $/KWH            $/KW/MONTH
Electricity Base load                                  50                 0.11                  -
Electricity Marginal Reduction Rate                   146                 0.16                  -
Electricity Peak Hours Use                            146                 0.16                  -

COMMUNITY ENERGY STRATEGY REPORT                                                                                          WSP
Project No. 171-13021-00                                                                                         November 2017
OXFORD PROPERTIES GROUP                                                                                                Page 6
G CO2E/KWH $/KWH $/KW/MONTH
Electricity Demand Charges (/month) - - $10.50
Natural Gas 181 0.04 -
The cost used for domestic potable water is $3.66/m³, and the associated emissions are 150g CO2e/m³ (Toronto
Atmospheric Fund, 2016)
4 BASELINE ENERGY PERFORMANCE
The expected energy consumption of the proposed development (what is normal, and what is possible for a low-carbon
development) is presented here. The expected energy consumption will be broken down into major end uses.
4.1 BASELINE CASE
The baseline case selected for this report is a building meeting Ontario’s code requirements, typical of the market’s
approach to this kind of construction, and provided with a high efficiency central chilling plant and high efficiency
natural-gas fired condensing gas plant. Savings in cost and greenhouse gas emissions presented throughout the report are
in reference to this baseline. Further information regarding the assumptions used to prepare our baselines is presented in
Appendix B. (All intensity calculations exclude parking area from the GFA.)
Figure 5 shows our estimated end-use breakdown for the first development option, calculated based on typical loads for
offices, retail, residential building and hotels. We assume no significant data centres will be included. The difference
between option 1 and the other two development options is very minimal, as shown in Table 2.
Figure 5: Estimated End-Use Breakdown for option 1 (whole development)
COMMUNITY ENERGY STRATEGY REPORT WSP
Project No. 171-13021-00 November 2017
OXFORD PROPERTIES GROUP Page 7Figure 6: Estimated End-Use GHG Emission Breakdown option 1 (whole development)
GHG intensity targets for the buildings sector are less established than energy targets. We suggest two benchmarks for
comparison:
— The Toronto Green Standard may adopt GHG intensity targets as part of their next major update. TGS version 3
minimum threshold for office buildings has been proposed at 20 kgCO2e/m², with the Tier 2 threshold set at 15
kgCO2e/m².
— A leading methodology for corporate GHG reduction target setting, the Sectoral Decarbonisation Approach, has
identified an emissions intensity target for the global services/commercial buildings sector of 13 kg CO2e/m² by 2050.
Table 2: The difference of the End-Use Breakdown percentages for options 2 and 3.
ENERGY GHG
Option 2 Option 3 Option 2 Option 3
Load
(Office) (Mall Expansion) (Office) (Mall Expansion)
Heating (Gas) 2% 2% 0% 0%
Plug Loads -1% -1% -1% -1%
A/C 0% 0% 0% 0%
Lights 0% 0% 0% 0%
Pumps, Fans, Process -4% -4% -2% -2%
Site Lighting 0% 0% 0% 0%
Cooking 0% 0% 0% 0%
Domestic Water Heating (gas) 3% 3% 4% 4%
COMMUNITY ENERGY STRATEGY REPORT WSP
Project No. 171-13021-00 November 2017
OXFORD PROPERTIES GROUP Page 84.2 POTENTIAL ENERGY REDUCTIONS
To determine reasonable assumptions for building energy uses, we referred to a variety of energy performance resources,
including code, recent projects, energy studies and energy models. Further details on this process are presented in
Appendix B.
We have identified a range of potential energy consumption profiles the community might have, depending on what level
of energy performance is targeted during design, construction, and operation, shown in Figure 7.
Figure 7: Range of Potential Total Energy Consumption
The associated carbon reductions are shown in Figure 8. (Note that the substantial incremental decrease from the higher
performance to low carbon target project is associated with a fuel switch away from natural gas space heating, to heat-
pump based electrical heating.)
.
Figure 8: Range of Potential Carbon Emissions
COMMUNITY ENERGY STRATEGY REPORT WSP
Project No. 171-13021-00 November 2017
OXFORD PROPERTIES GROUP Page 94.3 SYSTEM SIZING
Overall, the estimated heating and cooling system sizes which could be required for option 1 to serve the whole
development are shown below. Additional tables showing the values for options 2 and 3 and shown in Appendix b.
Table 3: Heating System Sizes
MINIMUM
RECOMMENDED HIGH PERFORMANCE LOW CARBON
ENERGY TARGETS ENERGY TARGETS TARGETS
Type of Building Heating Demand (KW)
Retail 4,100 3,500 3,300
Hotel 240 200 190
Office 2,900 2,400 2,300
Residential 3,200 2,700 2,600
Total: 10,000 8,800 8,400
Table 4: Cooling System Sizes
MINIMUM
RECOMMENDED HIGH PERFORMANCE LOW CARBON
ENERGY TARGETS ENERGY TARGETS TARGETS
Type of Building Cooling Demand (tons)
Retail 1,400 1,100 600
Hotel 40 28 16
Office 880 510 370
Residential 530 380 210
Total: 2,800 2,000 1,200
Although separate from electrical service sizing, the estimate below shows the anticipated average utility monthly
electrical demand peaks for each of the design cases, in KW. Note that in the low-carbon target case, average monthly
demand does not reduce as significantly as system sizing does, since electricity is now used for building space
conditioning in both winter and summer months.
Table 5: Electrical Average Monthly Peak Demand
MINIMUM
RECOMMENDED HIGH PERFORMANCE LOW CARBON
ENERGY TARGETS ENERGY TARGETS TARGETS
Type of Building Electricity Demand (KW)
Retail 1,200 990 940
Hotel 68 58 55
Office 810 690 660
Residential 910 780 740
Total: 2,959 2,515 2,389
COMMUNITY ENERGY STRATEGY REPORT WSP
Project No. 171-13021-00 November 2017
OXFORD PROPERTIES GROUP Page 104.4 FUTURE READY DESIGN Toronto’s Future Weather and Climate Driver Study, produced in 2011, predicts possible increases in hot weather; heat waves, and daily rainfall. One way to assess how the proposed development will perform over time is to include an assessment of future, as well as current energy and stormwater management performance referring to climate change models to ensure that the development will be low impact the year it is occupied, and, at the end of the mechanical systems’ lifespans. Figure 9: Toronto's Future Weather (source: City of Toronto website and “Toronto’s Future Weather and Climate Driver Study, 2011”) 5 EVALUATION CRITERIA The following criteria were used to assess the effectiveness of potential measures with respect to meeting the City of Toronto goals for this study: Reduced Energy Use and/or Demand Response: Opportunities which have the potential to achieve lower energy use intensities (EUIs) and reduced energy demand, through passive as well as active system design. Reduced Carbon Solutions: Opportunities which have the potential to result in building reduced greenhouse gas emissions during operation. Health and Wellbeing: Opportunities which have the potential to improve occupant health, including positive impacts on features including: temperature and humidity control, reduced drafts and local temperature fluctuations, indoor air quality, access to daylight and views, and reduced glare. Energy Resilience and Durability: Opportunities to improve the building’s resilience to area-wide power outages (see Figure 7.) This includes meeting all emergency power (life safety) requirements, as well as providing for 72 hours (at a minimum): — Domestic water (hot and cold); — Elevator service; and — Space heating, lighting and receptacle power to the central common area/amenity space/lobby, where applicable. COMMUNITY ENERGY STRATEGY REPORT WSP Project No. 171-13021-00 November 2017 OXFORD PROPERTIES GROUP Page 11
Figure 10: Emergency Power for Resilient Buildings (source: City of Toronto)

     6 HIGH PERFORMANCE
       OPPORTUNITIES
     The following high performance building strategies were considered, to identify how the development might achieve the
     evaluation criteria noted:
     —   Building Form and Passive Elements: Integrated Design, Life Cycle Assessment, Massing: Tower Form &
         Orientation, Daylighting, Low Window-to-Wall Ratios, High performance windows, Wall and roof insulation, Air
         Tightness Design and Testing, Transpired solar thermal collectors
     —   HVAC and Lighting Design: Plug and Process Load Management, Minimizing Parking Conditioning, High efficiency
         lighting, High Efficiency HVAC, On-site waste heat recovery, Air sourced heat pumps & variable refrigerant flow
         systems (VRF), Geo-exchange systems, Thermal energy storage, High-Efficiency Combined Heat and Power, Biomass
         Heating, Battery storage, Solar thermal water heating, Photovoltaic collectors, and, Low-flow Fixtures.
     —   Shared Services and District Connection: Shared HVAC & backup power service, District-Energy Thermal Energy
         Network, District Deep lakewater cooling systems, District Energy Steam systems, Wastewater Heat Recovery, and
         Micro-grid(s) for islanding.
     Each of these opportunities is described in greater detail in Appendix C. Viability of each measure was evaluated within
     the context of the Subject Property using the selected criteria. A summary of this viability is provided below. Measures
     were dismissed (shown in grey text) if they were considered infeasible, or would impede the development from achieving
     one of the criteria. Measures that are considered an integral part of current design practises were labeled ‘Fundamental’.
     Table 6: Opportunity Table

                                                                                         Impact
               Strategy                   Feasible                                                      Resilience
                                                        Reduced          Reduced        Health and                        Financial
                                                                                                            &
                                                         Energy           Carbon        Well-Being                        Viability
                                                                                                        Durability
Building Form & Passive Elements
Integrated Design                             Y        Fundamental      Fundamental     Fundamental     Fundamental           +++
Life-Cycle Assessment of Design               Y             +                +               +               +                 +
Massing: Tower Form & Orientation             Y             +                +               +               +                ++
Daylighting                                   Y        Fundamental           +          Fundamental     Fundamental

     COMMUNITY ENERGY STRATEGY REPORT                                                                                          WSP
     Project No. 171-13021-00                                                                                         November 2017
     OXFORD PROPERTIES GROUP                                                                                                Page 12
Impact
Strategy Feasible Resilience
Reduced Reduced Health and Financial
&
Energy Carbon Well-Being Viability
Durability
Low Window-to-Wall Ratios Y Fundamental Fundamental + + +++
High performance windows Y Fundamental Fundamental ++ Fundamental +
Wall and roof insulation Y Fundamental Fundamental + Fundamental
Air Tightness Design and Testing Y Fundamental Fundamental Fundamental Fundamental +++
Transpired solar thermal collection Y + + + ++
HVAC & Lighting Design
Plug and Process Load Management Y Fundamental Fundamental + ++
Minimize Parked Car Space Conditioning Y ++ + ++
High efficiency lighting Y Fundamental Fundamental + + +++
High efficiency HVAC Y Fundamental Fundamental + + ++
On-site waste heat recovery Y ++ ++
Air sourced heat pumps and VRF Y + +
Geo-exchange systems Partial + + +
Peak Shifting Thermal energy storage Y + +++ ++ +
High-efficiency Natural-Gas Combined Heat,
Y --- --- ++ ++
Cooling and Power Generation
Additional
Central Biomass Combined Heat & Power
Perhaps + +++ management + --
Generation
required
Battery storage Y + + + +
Solar thermal water heating Y + + + -
Photovoltaic collectors Y + + + +
Low-flow fixtures Y + + + +
Shared Services & District Connections
Shared HVAC & backup power service Y ++ + +
District Energy: Thermal Energy Network Y ++ ++ ++ ++
District Energy System: Deep Lakewater N + + +
District Energy System: Steam N - - --
District Wastewater Heat Rejection Systems Y ++ ++ +
Micro-grid(s) for islanding Perhaps + + ++
Positive Negative
Table Legend
Impact Impact
+++ ++ + - -- ---
6.1 ANALYSIS OF SELECTED STRATEGIES
Many of the identified strategies that will be necessary to achieve a high performance development are already well
established in good design and construction practice (e.g.: high efficiency lighting), or are considered as a matter of course
as code and Toronto Green Standard compliance is investigated (e.g. building insulation measures.) These strategies
should be implemented, but do not require further detail regarding viability. As such, they are not further developed in
this report.
From the potential strategies considered, the following were selected for deeper analysis. These are considered to have
potential to influence a low/no-carbon development strategy at the Subject Property, or, are of interest to Oxford
Properties Group to understand relative impact. These are:
— Low Window-to-Wall Ratios
— Geo-exchange systems
— Thermal energy storage
— District Energy: Thermal Energy Network
COMMUNITY ENERGY STRATEGY REPORT WSP
Project No. 171-13021-00 November 2017
OXFORD PROPERTIES GROUP Page 13We analyzed the potential for each activity, reporting energy, carbon, and cost benefit of the first three measures for the
first proposed development option. The first option was chosen for this analysis as it is predicted to have lower energy
consumption than the other two options. It is expected however, that the trends found in analyzing the first three
measures will be consistent across all the development options. The fourth measure was analyzed for all three
development options under consideration as it was considered to have a higher dependency on the mix of residential,
retail, hotel and office development.
6.1.1 LOWER WINDOW-TO-WALL RATIOS
Architectural details can maintain a glazed look-and-feel while increasing wall R-value. The table below shows the
potential energy impacts of moving from a highly glazed façade to a more modestly glazed one. Because glazing systems
are high cost, this is typically a design decision that can be made without adding significant construction costs. Savings are
based on a 20% window-to-wall ratio reduction versus typical practice. Absolute savings will vary based on the actual
reduction.
The impact of this measure can be explored cooperatively by Oxford Properties Group, architectural team and energy
simulation at the design stage for each new building.
Table 7: Expected System Energy Impact
% Cost GHG Savings First
Energy Savings Energy Savings (Tonnes % GHG Cost Simple
Site (eMwh/year) Savings ($/year) Coe2/year) Savings ($) Payback
Retail 2,600 11% $180,000 430 16% $0 Immediate
Hotel 280 12% $21,000 45 15% $0 Immediate
Office 1,200 10% $89,000 190 16% $0 Immediate
Residential 3,800 12% $280,000 610 20% $0 Immediate
Total: 7,900 11% $570,000 1300 18% $0 Immediate
6.1.2 GEO-EXCHANGE SYSTEMS
A geo-exchange system installed beneath the building has the potential to provide valuable thermal energy savings and
carbon savings. Based on the size of facility, and ground area available below building or on the adjacent site, we have
estimated the savings potential for a geo-exchange system of 800 deep closed-loop boreholes, which is estimated to be able
to serve a significant portion of the development’s total thermal heating and cooling demand.
Geo-exchange wells can be installed below the building, or, on adjacent land. Well casings can be used to avoid interaction
with the overburden. In addition to providing heating, geo-exchange typically improves the efficiency of cooling up to
17%, and reduces or eliminates cooling towers and associated water use from the site.
Table 8: Expected System Energy Impact
Cost GHG Savings
Energy Savings % Energy % GHG First Cost Simple
Site Savings (Tonnes
(eMwh/year) Savings Savings ($) Payback
($/year) Coe2/year)
Retail 9,000 37% $470,000 1600 60% $5,200,000 11
Hotel 1,100 49% $60,000 200 67% $150,000 3
Office 3,800 33% $200,000 680 56% $3,300,000 17
Residential 15,000 49% $1,000,000 2700 89% $2,000,000 2
Total: 29,000 42% $1,700,000 5200 72% $11,000,000 6
COMMUNITY ENERGY STRATEGY REPORT WSP
Project No. 171-13021-00 November 2017
OXFORD PROPERTIES GROUP Page 14The payback and cost savings calculated above include the avoided water costs and cooling tower maintenance. Peak
heating capacity and cooling tower capacity would need to be installed to back-up the geothermal system. Further
feasibility assessment would be required to assess long-term seasonal ground heat balance and confirm any additional
costs associated with the site’s ground conditions. For this development type, anticipated simple paybacks exceed
typically acceptable thresholds.
6.1.3 THERMAL ENERGY (ICE) STORAGE
Much like battery storage, ice storage allows a facility to reduce on peak electricity demand by storing energy. The chiller
producing ice consumes more electricity overnight, but, does not run on peak when the facility should be conserving
energy. This measure does not save energy, but by shifting the energy demand to off peak hours there are significant
reductions in the emission of GHG as the emission factors associated with peak electricity production are much higher
compared to baseload energy production.
Because the ice tanks allow the facility’s chiller size to be reduced, early selection of ice storage means that electrical
distribution can be reduced, minimizing servicing costs. Additional interior space will be required to accommodate the
tanks, as well as structural support for the tanks. However as residential buildings do not have a high cooling load, this
measure will only payback for the office and retail development. Across all of the buildings there are significant GHG
reductions.
Table 9: Expected System Energy Impact
GHG
% Cost
Energy Savings Savings % GHG First Cost Simple
Site Energy Savings
(eMwh/year) (Tonnes Savings ($) Payback
Savings ($/year)
Coe2/year)
Retail (330) -1% $11,000 140 5% $89,010 8
Hotel (110) -5% -$10,000 6.4 2% $2,543 (0.3)
Office (49) 0% $27,000 94 8% $55,949 2
Residential (1,700) -6% -$91,000 130 4% $33,697 (0.4)
Total: (2,200) -3% -$64,000 370 5% $181,200 (3)
6.1.4 DISTRICT ENERGY THERMAL ENERGY NETWORK
According to the City of Toronto (Environment & Energy Division, City of Toronto, 2016) District energy-ready buildings
include ability to supply thermal energy from ground level; an easement between the mechanical room and the property
line to allow for thermal piping; a low temperature hydronic heating system that is compatible (i.e. large temperature
differential or ∆T) with a district energy system in order to reduce the pipe sizes and associated valves, fittings, etc.; and
appropriate thermal energy metering.
In the case of a multi-building development, developers have an opportunity to establish a small DES on their own site by
designing a single, slightly larger mechanical room in one building and connecting the other buildings through a thermal
energy distribution network. The mechanical room would include the equipment necessary to serve other buildings being
constructed on the site, and connected buildings would be designed to be DE-ready.
The Yorkdale site Block Plan contemplates an underground parking and loading structure in which piping could be routed
between structures for the purpose of a district energy thermal network.
Advantages to designing for combined energy supply from one mechanical room on the Subject Property would include
the following:
— improved efficiency due to plant scale
— Reduced overall mechanical room space
COMMUNITY ENERGY STRATEGY REPORT WSP
Project No. 171-13021-00 November 2017
OXFORD PROPERTIES GROUP Page 15— Flexibility to locate main mechanical space near ground level (e.g. in the proposed below-grade structures), thereby
liberating highly valuable rooftop and/or penthouse areas. Advantages of liberating this space includes: decreasing
the number of rooftop units, making roof space available for solar panels and/or a green roof.
District energy networks are particularly valuable where thermal diversity between facilities sums to be well served by a
steady generation source. The Yorkdale site Block Plan presents a diverse mix of retail, office and residential uses, and is
likely to be well-suited to a district energy network application.
We have calculated the likely first cost change and efficiency impacts of moving to a district approach to heating and
cooling for the Subject Property, with savings resulting from improved efficiency at a centralized level, and costs
associated with installation of the district pipework and construction of mechanical energy transfer station rooms near
ground level (e.g. in the proposed below-grade structures).
A district energy system is often managed by one entity who generates and distributes heating/cooling to facilities owned
by multiple entities, which may currently or in the future be separate from the district provider. A long-term service
agreement is established to define the terms of heating/cooling delivered and agreed cost. The costs and paybacks shown
below assume that the district energy provider can provide competitive rates (cost-neutral to each individual facility
regardless of ownership, versus owning and operating their own heating and cooling plant.)
While not required, connecting additional external facilities (like parts of Yorkdale Mall) to the network could provide
even greater diversity and benefit to this development, as well as to the external sites that connect. This is particularly
true if the system is designed for thermal exchange between facilities, allowing buildings requiring cooling (like offices in
winter) to trade heat with buildings requiring heating (like residential buildings in winter).
Table 10: Expected System Energy Impact for option 1
GHG
Energy Cost Savings
Savings % Energy Savings (Tonnes % GHG First Cost Simple
Site (eMwh/year) Savings ($/year) Coe2/year) Savings ($) Payback
Retail 700 3% $54,000 78 3% $66,000 1
Hotel 78 3% $6,300 8.3 3% $88,000 14
Office 340 3% $27,000 35 3% $440,000 16
Residential 1,100 4% $85,000 110 4% $1,100,000 13
Total: 2,200 3% $170,000 230 3% $1,700,000 10
Table 11: Expected System Energy Impact for option 2
GHG
Energy Cost Savings
Savings % Energy Savings (Tonnes % GHG First Cost Simple
Site (eMwh/year) Savings ($/year) Coe2/year) Savings ($) Payback
Retail 700 3% $54,000 78 3% $66,000 1
Hotel 67 3% $5,400 7 3% $88,000 16
Office 1,200 3% $95,000 120 3% $790,000 8
Residential 780 3% $63,000 83 2% $630,000 10
Total: 2,700 3% $220,000 290 3% $1,600,000 7
COMMUNITY ENERGY STRATEGY REPORT WSP
Project No. 171-13021-00 November 2017
OXFORD PROPERTIES GROUP Page 16Table 12: Expected System Energy Impact for option 3
GHG
Energy Cost Savings
Savings % Energy Savings (Tonnes % GHG First Cost Simple
Site (eMwh/year) Savings ($/year) Coe2/year) Savings ($) Payback
Retail 680 3% $52,000 76 3% $66,000 1
Hotel 67 3% $5,400 7 3% $88,000 16
Office 1,000 3% $82,000 100 3% $790,000 10
Residential 670 3% $54,000 71 2% $660,000 12
Total: 2,400 3% $190,000 260 3% $1,600,000 8
7 FUNDING OPTIONS
Many of the opportunities identified have longer paybacks than typically desired. However, funding for high-performance
features may be available from a number of agencies. Major opportunities for funding of high performance opportunities
have been described below.
7.1 DISTRICT-LEVEL EFFICIENCY INITIATIVES
7.1.1 ONTARIO’S CLIMATE CHANGE ACTION PLAN: BUILDINGS & ENERGY
Proceeds from the province’s cap and trade will go to fund Ontario’s climate change action plan, which includes the
following potential funding measures, which may be accessible for Oxford Properties Group. All actions noted below are
scheduled to launch in 2017 or 2018, but the details of how to access these funds are to be yet to be confirmed. Significant
details on the Climate Change Action plan implementation will be available in the second half of 2017.
Table 13: Climate Change Action Plan Initiatives
POTENTIAL THE YORKDALE
SHOPPING CENTRE FUNDING FUNDING
Help companies transition to low-carbon: The The Green Bank is intended to be the $875M to $1,100M
government will help Ontario businesses and primary source of funding from the
industries increase their use of low-carbon Cap and Trade program for developers
technologies. Programs and services will be designed of new buildings and neighborhoods.
and delivered by the green bank to help reduce
greenhouse gas pollution while also reducing costs.
Establish low-carbon content for natural gas: Ontario The Yorkdale Shopping Centre may $60M to $100M
will introduce a renewable content requirement for explore funding off-site production of
natural gas and provide supports to encourage the renewable natural gas. This measure
use of cleaner, renewable natural gas in industrial, may support that off-site
transportation and buildings sectors. infrastructure.
COMMUNITY ENERGY STRATEGY REPORT WSP
Project No. 171-13021-00 November 2017
OXFORD PROPERTIES GROUP Page 17POTENTIAL THE YORKDALE
SHOPPING CENTRE FUNDING FUNDING
Strengthen the low-carbon clean-tech sector: Ontario The Yorkdale Shopping Centre may $140M to $235M
will encourage the development and growth of its explore funding for district energy
clean-tech sector by supporting research in low- thermal network system, or other
carbon technologies; developing low-carbon clean innovative measures.
technology accelerators and clusters in sectors where
Ontario has a competitive edge; supporting proof-of-
concept projects for low-carbon technologies; and
helping emerging low-carbon companies increase
scale.
Consider accelerated capital cost allowance: The This may provide modest incentives $0 to $1M
province will work with the federal government to for Oxford Properties Group to invest
explore possible opportunities for accelerated in technology through increased ROI.
capital cost allowance for technologies that reduce
greenhouse gas pollution.
Establish a Challenge Fund: The government will A Challenge Fund is a competitive $250M to $300M
establish a greenhouse gas pollution reduction financing facility. The objective of a
challenge fund or program. challenge fund is to provide the
smallest possible financial
contribution to a socially worthwhile
project consistent with making it less
risky and more financially sustainable
to the private promoter. Successful
application to this fund could help
improve the ROI of economically
marginal measures to within Oxford
Properties Group’s risk tolerance.
7.1.2 TORONTO ATMOSPHERIC FUND: LOW CARBON ENTERPRISE
The Atmospheric Fund’s investment strategy is driven by a double bottom line: they invest in initiatives that advance their
mandate by reducing greenhouse gas emissions and generating a risk-adjusted market rate of return. The returns help
fund TAF’s initiatives to address climate change and air quality; TAF does not receive any funding from the City’s tax base.
TAF offers financing to both non-profit and for profit clients, including building owners, real estate developers, renewable
energy companies, and other enterprises that support their mandate.
TAF’s financing does not follow a rigid template. Rather, they structure their financing to fit your business needs and
circumstances. Their Financing FAQs contains information to learn more about what they look for. All transactions are
subject to stringent due diligence, are reviewed quarterly by TAF’s Investment Committee and are contingent on TAF
Board approval.
Low-carbon district energy system, geothermal heat pump systems, photovoltaic systems, solar thermal energy systems,
and several other measures contemplated in this report would be eligible for financing.
7.1.3 TAX CREDITS
The Government of Canada makes clean energy projects, such as solar energy, wind energy and energy from waste, more
fiscally attractive for industry by providing business income tax incentives.
COMMUNITY ENERGY STRATEGY REPORT WSP
Project No. 171-13021-00 November 2017
OXFORD PROPERTIES GROUP Page 18Under Classes 43.1 and 43.2 in Schedule II of the Income Tax Regulations, certain capital costs of systems that produce energy by using renewable energy sources or fuels from waste, or conserve energy by using fuel more efficiently are eligible for accelerated capital cost allowance. Under Class 43.1, eligible equipment may be written-off at 30 percent per year on a declining balance basis. In general, equipment that is eligible for Class 43.1 but is acquired after February 22, 2005 and before year 2020 may be written-off at 50 percent per year on a declining balance basis under Class 43.2. Without these accelerated write-offs, many of these assets would be depreciated for income tax purposes at annual rates between 4 and 30 percent. In addition to Class 43.1 or 43.2 capital cost allowance, the Income Tax Regulations allow certain expenses incurred during the development and start-up of renewable energy and energy conservation projects [Canadian renewable and conservation expenses (CRCE)] to be fully deducted in the year they are incurred, carried forward indefinitely and deducted in future years, or transferred to investors through a flow-through share agreement. To qualify as CRCE, expenses must be incurred for a project for which it is reasonable to expect at least 50 percent of the capital costs incurred for the project would be the capital costs of equipment described in Class 43.1 or 43.2, which include the following equipment considered for this development: — Cogeneration and Specified Waste-Fuelled Electricity Generation Systems — Active Solar Equipment and Ground-Source Heat Pump Systems — Heat Recovery Equipment — Photovoltaic Electrical Generation Equipment — Specified Waste-Fuelled Heat Production Equipment — District Energy Systems/Equipment 7.1.4 SUSTAINABLE DEVELOPMENT TECHNOLOGY CANADA Sustainable Development Technology Canada funds demonstration projects for new technologies that are not completely market ready. If innovative energy storage and distribution systems prove to form a part of the community energy strategy, SDTC may be the correct funder for the project. 7.1.5 ENERGY SERVICE COMPANIES Energy and renewable energy service companies (ESCO or ESCos) are commercial businesses providing a range of energy solutions, including designs and implementation of energy savings projects, energy infrastructure outsourcing, power generation and energy supply, and risk management. The ESCO usually finances the energy conservation element of the project, and the savings in energy costs are often used to pay back the capital investment of the project over a five- to twenty-year period. If the project does not provide returns on the investment, the ESCO is often responsible to pay the difference. ESCOs may have better risk tolerance for certain energy efficiency technologies and/or access to investors interested in reliable lower-return investments. However, the net benefits of the investment also accrue primarily to the ESCO, leaving the building owner with operating costs fees similar to those they would have paid for a less efficient system. 7.1.6 NEW DISTRICT ENERGY UTILITIES The City of Toronto issued on November 19, 2016 a request for qualifications (RFQ) for organizations / consortia interested in partnering opportunities for large-scale development of low-carbon/renewable thermal energy networks (district energy). The purpose of this RFQ was to establish a list of up to five pre-qualified respondents and get advice from the market place on partnership approaches. Rather than financing a district energy system itself, if development of such a utility on site was desired, Oxford Properties Group has the option of partnering with a district energy consortium to construct and operate the system as a utility. COMMUNITY ENERGY STRATEGY REPORT WSP Project No. 171-13021-00 November 2017 OXFORD PROPERTIES GROUP Page 19
7.1.7 CAP AND TRADE MARKET
Carbon emission reductions also have a direct value in cap-and-trade markets. However, the “quality” (verifiability) of
carbon reductions has an impact on their price. At typical market rates the value of carbon savings projected at the
Subject Property is not expected to exceed $100,000/year, if the low carbon target were pursued. In general, the
experience in cap-and-trade markets outside of Ontario has been that reductions attributable to energy efficiency
measures in buildings tend to be difficult to verify, and, tend to be below the minimum quantity required to enter the
market.

7.2 BUILDING-LEVEL EFFICIENCY INITIATIVES

7.2.1 IESO HIGH PERFORMANCE NEW CONSTRUCTION PROGRAM
The Independent Electricity System Operator (IESO) High Performance New Construction initiative provides design
assistance and incentives for building owners and planners who design and implement energy efficient equipment within
their new space. In 2009 alone, the Canadian industry saved $6.2 billion in energy costs through harnessing energy
efficiency improvements.
Incentives are available for a variety of energy saving measures, as detailed within the prescriptive and engineered
application tracks. The custom application track provides participants the flexibility to submit applications for innovative
energy efficient measures not listed within the prescriptive or engineered tracks.
—   Up to 10% above Building Code: The greater of either $400/kW of verified demand savings, or $0.05/kWh of verified
    electricity savings.
—   Between 10% to 25% above Building Code: The greater of either $600/kW of verified demand savings, or $0.075/kWh of
    verified electricity savings.
—   Greater than 25% above Building Code: The greater of either $800/kW for verified demand savings, or $0.10/kWh of
    verified electricity savings.
By implementing the selected energy efficiency measures described in this report, up to 55% energy consumption savings
will be achieved, on average, by the development, which may make it eligible for up to $1,500,000 in HPNC funding for
the Yorkdale Shopping Centre (based on calculations for the first development option). Note that changes to the
program are anticipated over time.

7.2.2 ENBRIDGE SAVINGS BY DESIGN PROGRAM
The Savings by Design program was developed to help builders improve energy and environmental performance in new
construction projects. The program is available to Ontario builders in the Enbridge Gas Distribution franchise area. There's
no cost to participate.
Incentives of up to $30,000/building (over 50,000ft²) are available, for a total incentive of $450,000, plus, a package of
free energy modelling and integrated design assistance for the design teams valued at up to an additional $450,000.

7.2.3 TORONTO GREEN STANDARD TIER 2 DEVELOPMENT CHARGE REFUNDS
Projects achieving TGS Tier 2, which sets more stringent environmental targets, are eligible for a development charge
refund when construction of the buildings is complete. The current refund rate cap is $33.78/m ² for non-residential
buildings and $1496/dwelling unit for residential buildings, or, about $8,400,000 for the Yorkdale lands. However, as
development charge rebates may already be pursued through other means, the refund may not provide as much financial
benefit as shown.

COMMUNITY ENERGY STRATEGY REPORT                                                                                          WSP
Project No. 171-13021-00                                                                                         November 2017
OXFORD PROPERTIES GROUP                                                                                               Page 20
8 NEXT STEPS
To meet the challenges of rapid urbanization and climate change, this development should further explore carbon-neutral
solutions as the design for each Site progresses.
This is a long-term plan, and there is no defined timeline for development or phasing.
We recommend the following steps be considered for further evaluation at the time of development approval for each of
the future development blocks on the site:
— Select the design strategies to further investigate on this development, using the list provided;
— Coordinate with utility and City offices if district connectivity is of interest;
— In co-operation with your architectural and sustainability teams, develop final energy use intensity targets for the
development;
— Establish targets, and include these in a Basis of Design document to instruct the Design Team on the desired
development outcomes;
— Adopt integrated design methodologies and set standards for reporting during design, construction and operation to
ensure buildings meet or exceed the targets;
— Explore high efficiency solutions in more detail to develop a menu of solutions that will work together to meet or
exceed the targets set; and
— During initial design development for each individual building, validate and adjust design strategies for the building
using whole-building energy simulation.
COMMUNITY ENERGY STRATEGY REPORT WSP
Project No. 171-13021-00 November 2017
OXFORD PROPERTIES GROUP Page 21APPENDIX A METHODOLOGY
APPENDIX A

Work completed for this assessment included:

1   Preliminary Community Energy Consumption Review: using data provided by the developer about anticipated building
    density, space uses, preliminary architectural form and building areas, we calculated the likely energy consumption for
    baseline and high-performing development types in the development.
2   Technology Review: using a literature review and internal engineering expert interviews, our team assembled technology
    profiles for solutions which could improve energy use at a district scale.
3   Feasibility Assessment: Based on engineering experience and literature recommendations, a roll-out scenario was selected for
    strategies with high potential. From published efficiency data and real-life operating cost experiences, expected energy
    impacts for each technology type were calculated and the benefits presented.
APPENDIX
B ESTIMATES OF
ENERGY USEAPPENDIX B
We have presented a range of possible energy consumption options for each building component. Recent technology
improvements allow new construction to have lower energy consumption at modest additional investment, making “average” or
“typical” energy consumption inappropriate for sizing new low-carbon developments. To determine reasonable assumptions for
these building energy uses, we referred to the following resources:
— Code Compliance Energy Models – our team reviewed the results of simulation of archetype buildings (office buildings, and,
retail buildings) which have been modelled to just meet Ontario Building Code (SB-10.) The models reviewed were prepared
using Energy Plus, a modern energy modelling software.
— Proposed Future Code Energy Target Models – our team reviewed the results of simulation of archetype buildings (office
buildings, and, retail buildings) which have been prepared using parametric energy modelling (runs with a wide variety of
inputs) to show what energy use reductions could be achieved using current technologies in combination. The parametric
energy modelling reviewed was prepared using Energy Plus, a modern energy modelling software.
— Real Building Energy Use – our team reviewed the results of measurement and verification exercises recently completed by
our project teams on high performance LEED Gold and LEED Platinum office building projects.
— New Project Energy Simulation – our team reviewed the results of measurement and verification exercises recently
completed by our project teams on high performance LEED Gold and LEED Platinum office building projects.
— Comparisons of Simulated to Real Building Energy Use – our team reviewed the results of measurement and verification
exercises completed by our project teams on a variety of building projects to estimate the likely variation between code
compliance modelling results and real-world energy consumption.
After reviewing all these resources together, our team decided on the following energy metrics for predicting demand. For each
major occupancy type, our team is recommending:
— A Simulation Target – during the building design phase, energy simulation software can be used alongside standard
assumptions about building occupancy, hours of operation, and design information to predict building performance and likely
energy use. In our experience, simulation targets can be up to 30% lower than actual energy use (although when exact
occupancy is known and building performance is tested, real use can match or even improve on predicted use.)
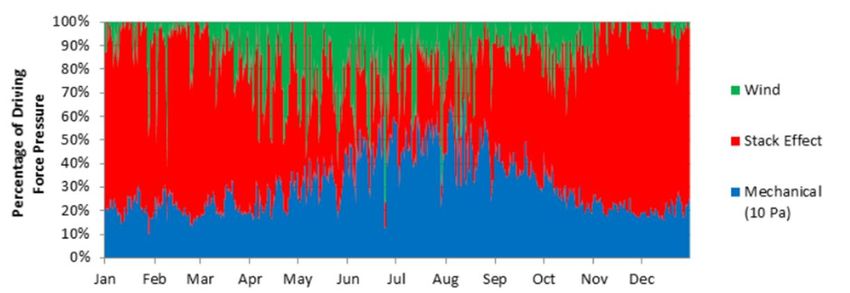
— An Operational Target – in real operation, particularly of buildings designed for leasing, many factors including actual
influence of stack effect and building traffic; occupant density; operating hours, and exact occupancy can impact real building
energy consumption. The range of possible impacts of typical variables on energy use is shown below.
Operational targets for energy use intensity should be considered at 130% of simulation targets, in line with our experience that,
when following standard occupancy and code assumptions, there is a tendency for energy uses on the lower side of the likely
anticipated outcomes to be predicted by standards energy simulation methodologies required by code or LEED systems.
Due to the variations in reliability; level of detail; age; and reductions in the number of high performance peer buildings currently
in operation as we looked at higher performance levels, engineering judgement was applied to use all the references available to
select reasonable targets and recommendations. (In our opinion, no single reference is appropriate to apply to the development
for all performance levels.)
8.1.1.1 SELECTION OF METRICS
Energy Use Intensity (Kwh/m²) and Thermal Demand Intensity (W/m²) were selected for this report, rather than, for instance,
percent improvement over a code target, because these targets allow the design teams to determine a fixed peak energy use and
thermal demand for each phase, and for the whole facility.
8.1.1.2 ENERGY SIMULATION TARGETS
ENERGY USE PEAK COOLING PEAK HEATING
INTENSITY DEMAND DEMAND (THERMAL)
(KWH/M²) (THERMAL) (W/M²) (W/M²)
Minimum Energy Targets (OBC Compliant Construction)
Retail 270 54 103
Office 200 54 79You can also read