Invasive Species Monitoring and Predator Control via Innovative AI Technology - Sapphire Hampshire - The Cacophony Project, Christchurch, New Zealand
←
→
Page content transcription
If your browser does not render page correctly, please read the page content below
Invasive Species Monitoring and Predator Control
via Innovative AI Technology
The Cacophony Project, Christchurch, New Zealand

                     Sapphire Hampshire

                      Georg-August-Universität Göttingen
                             Student ID: 21915150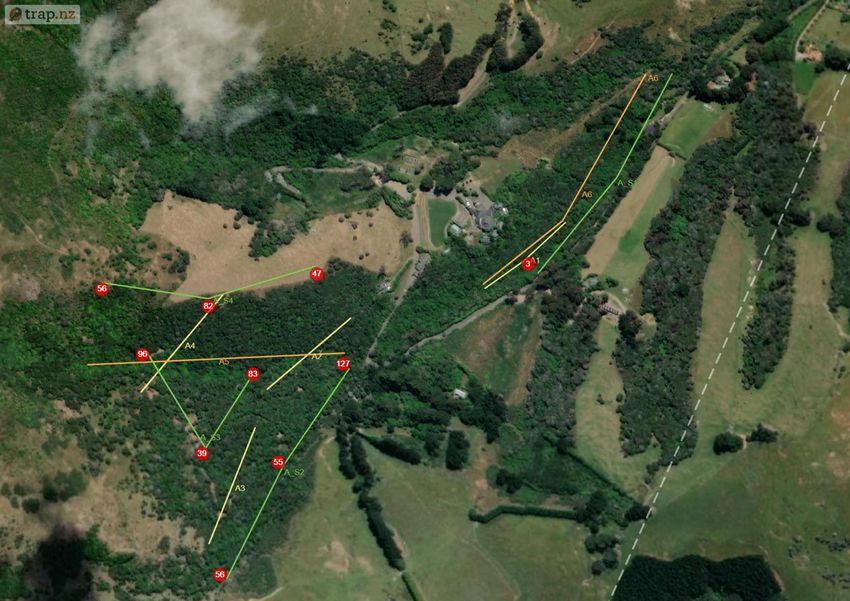
Contents

CHAPTER 1 AN INTRODUCTION: INVASIVE SPECIES AND CONSERVATION IN NEW ZEALAND
1.1 NATIVE FAUNA AND FLORA .........................................................................................2
1.2 INVASIVE SPECIES ....................................................................................................3
1.3 THE CACOPHONY PROJECT........................................................................................4
1.4 BANKS PENINSULA AND LIVING SPRINGS .....................................................................5

CHAPTER 2 PROJECT ONE: MONITORING INVASIVE SPECIES AT LIVING SPRINGS
2.1 INTRODUCTION .........................................................................................................8
2.2 OBJECTIVES .............................................................................................................9
2.3 METHODOLOGY ........................................................................................................10
2.4 RESULTS ..................................................................................................................12
2.5 OUTCOMES AND CONCLUSIONS .................................................................................15

CHAPTER 3 PROJECT TWO: PROTOTYPE TRAP EXPERIMENT
3.1 PEST CONTROL IN NEW ZEALAND ...............................................................................20
3.2 TRAPPING EFFICIENCY ..............................................................................................22
3.3 AIMS ........................................................................................................................23
3.4 TRAP DESIGN............................................................................................................23
3.5 TRAP SET-UP ............................................................................................................24
3.6 TRAP SCHEMATICS ....................................................................................................25
3.7 RESULTS ..................................................................................................................27
     3.7.1 TRAP MECHANICS.......................................................................................................... 27

     3.7.2 BEHAVIOURAL OBSERVATIONS ........................................................................................ 27

     3.7.3 INTERACTION RATE ....................................................................................................... 28

3.8 CONCLUSIONS ..........................................................................................................29
ACKNOWLEDGMENTS ..............................................................................................30
REFERENCES ............................................................................................................31
              CHAPTER ONE ............................................................................................................. 31

             CHAPTER TWO ............................................................................................................. 33

             CHAPTER THREE .......................................................................................................... 35

APPENDIX I .................................................................................................................37

Page | 1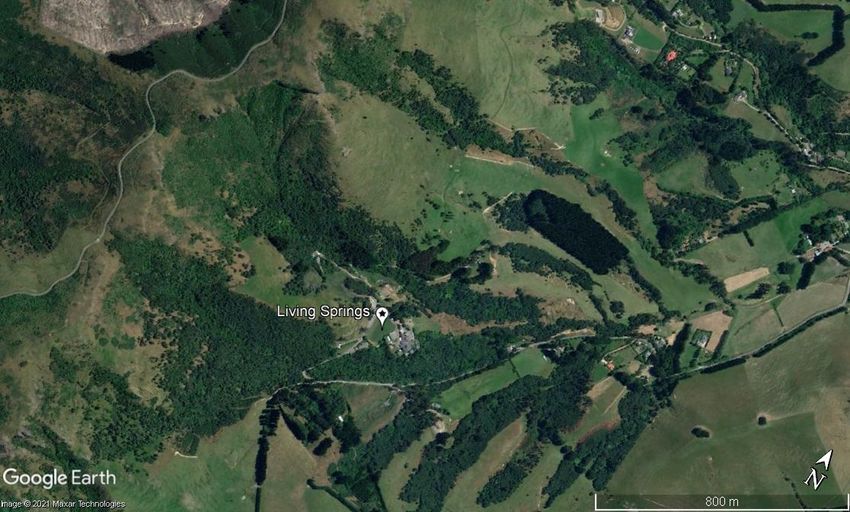
Chapter 1
An Introduction: Invasive Species and Conservation in New Zealand
1.1 Native Fauna and Flora
Surrounded by the Pacific Ocean, New Zealand totals 268,680 km2 in landmass, distributed across two
main islands (North Island and South Island) and a plethora of tiny offshore islands (~600) (World Atlas,
2021). Whilst similar in size to the UK, the population is 15 times lower with a population of 5.1 million
(StatsNZ, 2021).

Figure 1. New Zealand Population Density (Stats NZ). The most densely populated areas are the Auckland
region and Wellington region on North Island, whereas South Island is sparsely populated, and density decreases
towards the southern point of the island. However, the lowest populated area across New Zealand is along the
West Coast of South Island.

Due to its isolated geography, New Zealand is home to many unique, endemic species. Native flora
varies from podocarp forests housing giant Rimu trees, to alpine landscapes dominated by native scrub
and tussocks. These trees and plants are integral to their ecosystems and play major roles in sustaining
the fauna of New Zealand. For instance, the Kōwhai tree, with their distinctive yellow flowers provide
nectar to seven native bird species (DOC, 2021b). Despite its importance, native vegetation now only
covers 10-15% of New Zealand’s total land mass due to land use change and introduced flora (DOC,
2021g).
Unlike most large islands, native mammals are uncommon on New Zealand, with bats being the only
solely terrestrial mammal to have evolved. The two extant species are prone to risk from anthropogenic
disturbance resulting in the long-tailed bat considered endangered and the short-tailed bat classed as
critically endangered. Most native mammal species on New Zealand dominate marine habitats and
include: the Hector’s dolphin (Cephalorhynchus hectori), the New Zealand Fur Seal, (Arctocephalus
forsteri), the New Zealand Sea Lion (Phocarctos hookeri) and several whale species (DOC, 2021c).
Due to the lack of mammals Avifauna are the largest vertebrate group in New Zealand, with ~200
native species. Unfortunately, the synergetic impact of habitat loss, hunting, predation and resource
competition has resulted in multiple previous extinctions and leaving many current species vulnerable
(Innes et al., 2009). Arrival of the Māori tribes in the 14th Century resulted in the loss of ~40 species
including Moa (Dinornithiformes), and their natural predator, the Giant Hasst’s Eagle (Robertson et al.,
2017; Allentoft et al., 2015). Further spread of the Māori, as well as the European colonisation in the
19th Century led to a further loss of 19 species. Therefore, the country has seen a total loss of 59
(~40%) of their endemic birds since first human contact (Lal, 2008; DOC, 2021g; Robertson et al.,
2017). Several forested areas are now lacking the dawn and dusk choruses from songbirds, and many
flightless ground-dwelling birds such as the Takahē (Porphyrio hochstetteri) are on the verge of

Page | 2
extinction. Of the 200 species remaining 35% fall into the top three national conservation categories.
Within the Nationally Critical class are currently 23 species, meaning they face an immediate threat of
extinction. Another 15 are defined as Nationally Endangered and 33 are defined as nationally
vulnerable. Therefore, the Department of Conservation (DOC) have worked relentlessly towards the
conservation of birds in New Zealand (DOC, 2021g).
The second largest vertebrate group are reptiles. New Zealand has ~110 native lizard species,
exclusively skinks and gecko, which is considered uniquely diverse for a temperate landmass
(Hitchmough et al., 2016). Lizards play important ecosystem roles for their associated flora, natural
prey and predators. Facing threats such as habitat loss and predation from invasive species, most
species are classed as vulnerable/at risk. Additionally, many species are considered data deficient due
to a lack of suitable surveying methods. Despite this, conservation has prevailed and is ongoing within
New Zealand. (DOC, 2021f). One of New Zealand’s rarest reptiles is the Tuatara (Sphenodon
punctatus), a 200-million-year-old native. Due to their rapid decline after European colonisation, they
have been protected by law since 1895. Their main threats include habitat loss and poaching for the
pet trade. Their small population size poses additional challenges such as low genetic diversity (DOC,
2021m). Regarding amphibians, New Zealand is host to three native species of frog (Leiopelma).
These small, nocturnal frogs have been highly susceptible to environmental change (e.g. habitat loss)
and a deadly chytrid fungal disease. Intensive conservation to combat these threats has resulted in an
upgrade to their conservation status, however they remain vulnerable (DOC, 2021d). New Zealand is
also rich in endemic invertebrates such as the widely recognisable Wētā, distinct for their large bodies,
curved tusks, and spiny legs. These nocturnal, herbivorous invertebrates occupy multiple ecological
niches, comprising of >100 species. The introduction of non-native mammals has caused a sharp rise
in predation rate, thus leaving them very vulnerable (DOC, 2021e).
With a wide range of taxa and genera-specific threats, conservation in New Zealand is crucial to
preserve the biodiversity. One commonality in threats is the introduction of invasive species, therefore
one of the branches of conservation is looking into pest eradication.

1.2 Invasive Species
Alien species are prevalent in New Zealand and most are described as invasive, due to their ability to
outcompete natives. For example, New Zealand now has the largest number of established non-native
plants (excluding cultivation) on any island globally (Hulme, 2020). DOC highlights invasive mammalian
predators as a large threat for most native fauna in the country and thus an issue needing urgent
resolution. The earliest known non-native mammals were rats and dogs, introduced in the 13th Century
by Polynesian settlers (Lowe, 2008). However, most invasive species arrived in the 1800s with the
arrival of Europeans. Large species such as goats, sheep and red deer were introduced for food and
hunting by James Cook are now widely established (DOC 2020i; Curnow and Kerr, 2017). Forest
clearance for pastureland and resource competition now threaten many natives, including vulnerable
ground-dwelling bird species (DOC, 2020i). Smaller invasive have since established also including
rats, mice, mustelids, hedgehogs, possums, and rabbits. Most of these pest species are detrimental to
native species either directly (predation) or indirectly (altering ecosystem services) (DOC 2020i).
European whaling ships are the main culprit for rodent invasion in New Zealand. Ship rats (Rattus
rattus), Norway rats (Rattus norvegicus) now inhabit nearly every landscape in NZ (PFNZ, 2019). Their
rapid breeding, resource use and incessant predation on natives has had dire impacts to food webs
(Curnow and Kerry, 2017). Another invader, the House mice (Mus musculus) are considered a major
limiting factor in native lizard survival. Mice are in direct competition with skinks both for food (e.g. fruit
and invertebrates) and habitat (e.g. obstructing basking) (Norbury et al., 2014; Lettink, 2009). Rabbits
(Oryctolagus cuniculus) arrived with voyagers to establish a meat and fur trade. However, with short
gestation periods, large litter sizes and producing multiple litters per year, this led to a major invasion.
Rabbits established in dryland and semi-arid habitats and due to their destruction of pastureland are
considered agricultural pests (DOC, 2021k). To control rabbits, several mustelid species (stoats,
weasels, and ferrets) were introduced in 1879. Relentless hunters, these mustelids pose significant

Page | 3
threats to native bird and lizards, able to target diurnal and nocturnal species across multiple habitat
types (DOC 2021l).
Another major invasion was of Brushtailed possums (Trichosurus vulpecula), introduced from Australia
in 1837 for the fur trade (Curnow and Kerr 2017). These nocturnal mammals are now widespread, with
a population size of ~30 million even after heavy pest control measures. Able to inhabit most
environments, they thrive in podocarp forests, an important niche for many endemic birds. As
opportunistic omnivores they predate on lizards, birds and their eggs (Figure 2). They also induce
interspecific resource competition as they also eat fruit, berries, and nectar (DOC 2021j)

                         .
Figure 2. Brush-tailed possum (Trichosurus vulpecula) eating the egg of a Kererū/NZ Pigeon (Hemiphaga
novaeseelandiae) (© Ngā Manu Images)

 The European Hedgehog (Erinaceus europaeus) was introduced deliberately by the British in the late
19th Century and are prevalent country--wide (DOC 2021a). Being primarily insectivorous, they undergo
resource competition with diurnal skink species which occupy the same ecological niche. There are
also multiple reports of hedgehogs eating lizards, therefore high densities could have a larger scale
impact to local reptiles than previously thought (Jones, Moss and Sanders, 2005).
All invasive mammals have significant impacts on native flora and fauna; therefore, several
organisations have implemented control measures to combat pests in New Zealand. As of 2016, the
government announced the formation of Predator Free 2050, which aims to eradicate all non-native
predators within the next 30 years (Peltzer et al., 2019). Predator Free 2050 encompasses multiple
organisations (e.g. DOC), regional councils and Iwi, which are working both individually and
collaborating to achieve the goal. One of these organisations is the Cacophony project, which has
taken a unique approach by focusing on innovative technology to tackle the pest problem in New
Zealand.

1.3 The Cacophony Project
Founded by Grant Ryan in 2016, the Cacophony project is a not-for-profit organisation based in
Christchurch, South Island. The project aims to eradicate pests by developing modern technology to
enhance pest control measures in New Zealand. The team are a collaboration of engineers, mechanics
and IT technicians, working alongside key conservation groups (e.g. DOC) and university institutions
(e.g. Lincoln University). As a non-for-profit organisation the project are paired with a sister company,
2040, to sell their products. With a focus on conservation the products are sold to cover manufacturing
costs, and profit is restricted to wages for the teams involved. Additionally, the project wants to ensure
anyone can use and/or improve the technology. Therefore, the software is open source, meaning it is
publicly accessible, which invites an inclusivity feeling to the project (The Cacophony Project, 2021).
Able to view conservation from a technological perspective, the project initially aimed to quantify bird
population change. The first product developed was the Cacophonometer, an acoustic bird monitor
which uses a microphone linked to a smart-phone application where data can be uploaded to a server
(‘cloud’) and easily accessed online. The main goal of this device is to create an index to measure
effectiveness of restoring bird populations by determining the success of conservation measures.
Page | 4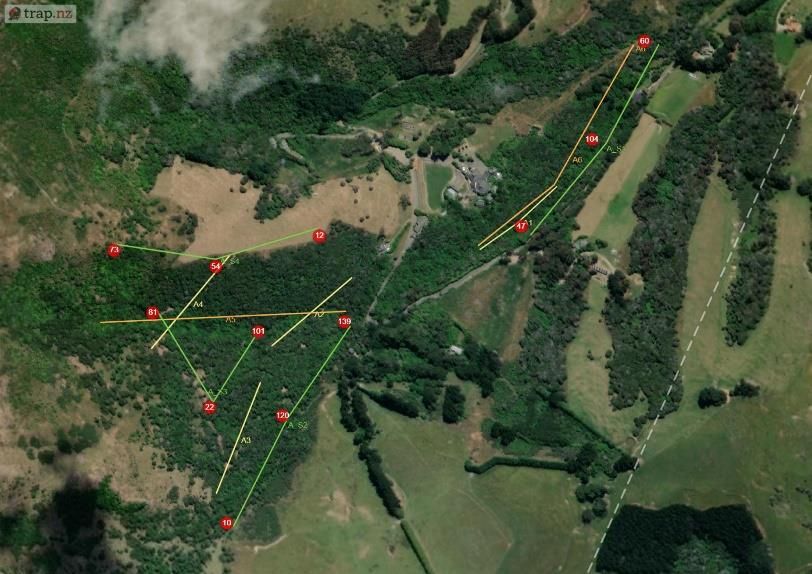
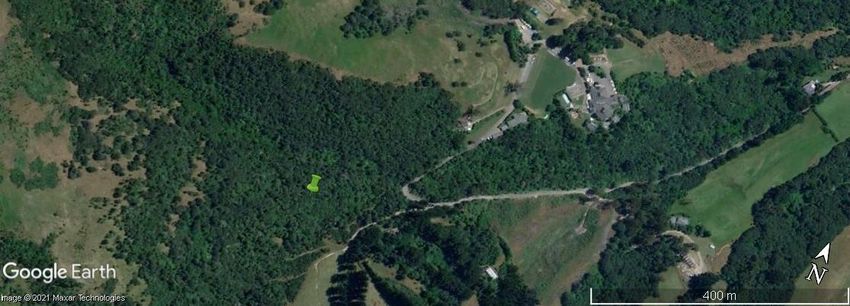
Figure 3. Neural Network concept showing the different Cacophony technologies developed for optimal
monitoring and pest control programmes (© The Cacophony Project)

Furthermore, the project expanded its online system to incorporate pest monitoring and a new
monitoring device was developed (Figure 3). Noticing a gap in the market, a standalone thermal
camera was developed, which aims to efficiently monitor nocturnal predators in the field using thermal
imaging. The cloud allows automatic data uploads, which can be immediately accessed and
downloaded by the user. Simultaneously the team have developed machine learning software, which
teaches computers to recognise patterns. The intention is to train the software to identify and
automatically tag species in recordings from the thermal cameras. This would heavily reduce human
labour needed for wide-scale monitoring. Preliminary tests using the software and equipment have
already shown to 200x increase in analysis speed already (Ross and Ryan, 2019, unpub.; Ross et al.,
2020). Both devices are now in field-testing to improve the products and train the AI. Furthermore,
audio lures have been developed to increase success rate of species presence and are in their
preliminary test phase.
In conjunction with monitoring, the project is designing an innovative AI-based trap. This aims to use
smart design with AI to target multiple pest species, eliminate non-target capture and significantly
improve interaction rate (up to 30x higher than current traps). The design is important to appeal to
multiple species and reduce trap shyness to eradicate individuals’ other traps fail to. The first few
prototypes have been manufactured and are amid vigorous field testing. After testing and refinement,
the Cacophony project aim to integrate these technologies into standard monitoring and trapping
practices country-wide. Thus, coming to the forefront of pest eradication conservation and contributing
significantly to the predator free goal before 2050. For testing, the project uses private land owned by
Living Springs on the perimeter of Banks Peninsula.

1.4 Banks Peninsula and Living Springs
East of Christchurch, the most prominent volcanic feature on South Island protrudes into Pacific Ocean
(McLintock, 1966). Geologically formed 10-15 mya by two shield volcanoes, Lyttleton and Akaroa,
climatic influence has eroded and shaped the 1165 km2 of connected remnants known as Banks
Peninsula (Figure 4) (McLintock, 1966, CCC, 2014; Hampton and Cole, 2009).

Page | 5
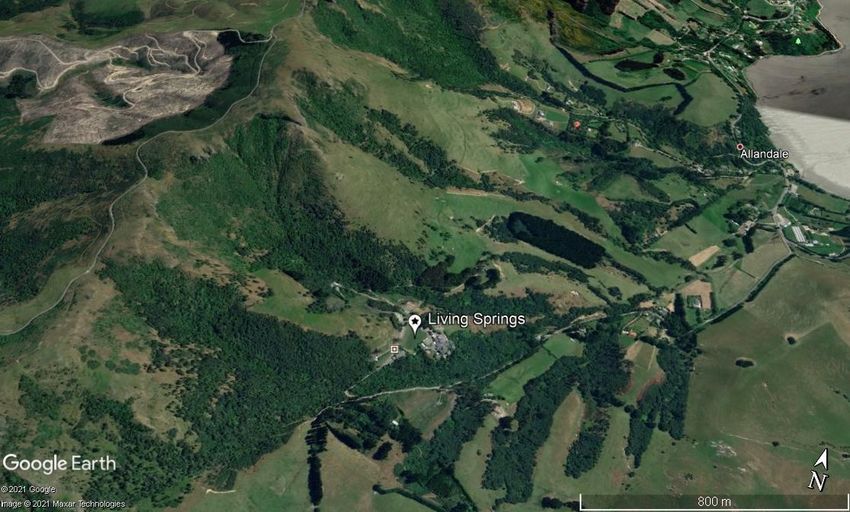
a)                              b)
Figure 4. a) Satellite view of South Island, New Zealand with Banks Peninsula highlighted. b) Zoomed view of
Banks Peninsula. The location of Living Springs (the field site) is pinned as well as the location of Christchurch
(© Google Earth Pro 2021).

Originally covered by podocarp forests surrounded by rocky shores, Banks Peninsula has suffered
significant land conversion. Between 1850 and 1900 over 99% of the forests were felled or burnt for
pasture-land (Wood and Pawson, 2008). Of the 1% of forest left, predominately native vegetation
remains, however ~15 species have been lost (Environment Canterbury, 2010). This severe habitat
fragmentation has negatively impacted the native fauna.

Despite the habitat fragmentation ~47 bird species are present including: 12 native bush bird species
e.g. translocated populations of Tūī (Prosthemadera novaeseelandiae) and Kererū/NZ Pigeons
(Hemiphaga novaeseelandiae), as well as 12 native coastal species e.g. the nationally vulnerable
Southern White-fronted Tern (Sterna striata) (Schmechel, 2010). Lizards also contribute to the
biodiversity of Banks Peninsula, where there are currently five confirmed species. The skink species
include the Common Skink (Oligosoma polychroma) and McCann’s Skink (Oligosoma maccanni) as
well as the rare Central Canterbury Spotted Skink (Oligosoma lineoocellatum). The two gecko species
are the Jewelled Gecko (Naultinus gemmeus) and Canterbury Gecko (Woodworthia brunnea) (Lettink,
2008). There is also speculation about the Forest Gecko (Mokopirirakau granulatus) as there is trace
evidence of its presence on Banks Peninsula (Bowie, Barker and Troup, 2010).

Other than habitat loss, the main threat for natives on Banks Peninsula are the invasive mammals.
Currently 15 introduced species roam free including rodents, mustelids, rabbits and possums (Curnow
and Kerr, 2017). Predator Free NZ is split into region, with the branch ‘Pest Free Banks Peninsula
(PFBP)’ set-up in 2018 by a collaborative of 14 founding local organisations. The programme focuses
on widespread predator control to preserve endemic biodiversity. PFBP have funded field-testing for
the Cacophony Project, which takes place on private land owned by Living Springs.

Living Springs is a camp site and conference centre located in the Port Hills at the head of the Allandale
Valley on the western perimeter of Banks Peninsula (Figure 5). This privately owned land stems 420ha
with three major gullies descending west to east. The highest elevations of 450 masl drops to ~30 masl
at the lowest point. The landscape is a mixture of native bush and pastureland. A long-term goal is to
create contiguous bush linking to surrounding land, owned by private stakeholders and the council.
The location is good for field-testing due to its abundance of invasive and native species. For monitoring
the field site is split into three sections (A,B and C) using the gullies as natural divides (Figure 6).

Page | 6
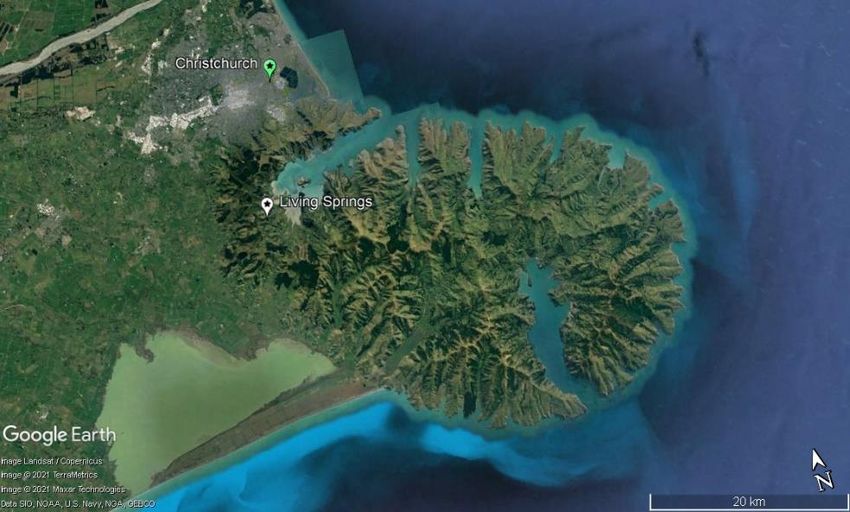
Figure 5. Location of Living Springs: the field-testing site for the Cacophony Project (43°39'11.37"S
172°38'02.78"E). Pinned is the location of the camp and conference facilities. The three gullies are prominent
features of the landscape and the mixed vegetation (native bush and pastureland) can be seen. (© Google Earth
Pro and Google Maps 2021).

Figure 6. The three field-testing locations at Living Springs. Section A, B and C are split into the three natural
gullies and highlighted on the map.

Over the course of the 12 weeks of my internship I undertook two projects with the field aspect of each
centred at Living Springs: 1) Monitoring Pests and 2) Testing the prototype trap for a) interaction rate
b) behaviour. Chapters 2 and 3 focus on each project individually.

Page | 7
Chapter 2
Project one: Monitoring Invasive Species at Living Springs
2.1 Introduction

The Department of Conservation (DOC) is responsible for the majority of New Zealand’s monitoring as
establishing good, standardised practise allows clear overviews of the ecological health of the country.
Monitoring exists at three levels: 1) Broadscale, 2) Nationally Managed Places and 3) Research (Local-
scale). All three segments provide a framework to assess performance and guide policy making.
Regarding pest control, both biodiversity inventories and long-term monitoring programs need
implementing (DOC, 2021a). As monitoring uses parameters at predetermined frequencies to measure
trends in populations, it is a key element for predator control programmes as the success of
interventions can be quantified. Several methods have been established to optimise monitoring across
the wide range of pest species in New Zealand (Table 1).
Table 1. Main monitoring methods used for different pest species in New Zealand (DOC 2021b).

             Tracking     Chew       Waxtags   Trap      Faecal      Distance       Night       CPUE
             Tunnels      Cards                Catch     Pellets     Sampling       Counts      Indices
 Rodents          ✔          ✔
 Mustelids        ✔          ✔
 Possums                     ✔         ✔         ✔
 Deer                                                        ✔
 Wallabies                                                                ✔
 Rabbits                                                                               ✔
 Goats                                                                                             ✔

For smaller pests, excluding rabbits, the most common techniques are tracking tunnels and chew
cards. These are cheap, easy to use, and target multiple species thus are considered efficient to
monitor pest distribution (NZ Landcare Trust, 2014). Tracking tunnels are principally used for rodent
and mustelid detection. They consist of corflute plastic folded into a tunnel with middle section covered
with tracking ink. To entice animals’ tunnels are baited with food (e.g. peanut butter). Tracking tunnels
are placed along transects spaced 50 m apart and deployed for up to a week. The resulting footprints
can be identified and tracking rates calculated (Gilles and Williams, 2013; Ruffell, Innes and Didham,
2014). Chew cards are another commonly used monitoring method. These channelled cards are filled
with scented baits such as peanut butter, aniseed paste or soft meats. They are then attached to trees
or posts for up to a week. The resulting bitemarks can be analysed using guides to identify rodents,
mustelids or possums. Chew cards have higher detection rates than tracking tunnels and are relatively
inexpensive therefore are often used for large-scale monitoring (Ruffell, Innes and Didham, 2014;
Sweetapple, 2011).
Despite their wide usage, these methods are extremely labour intensive and limited in data output.
Therefore, to achieve pest eradication by 2050 other methods are needed to optimise wide-scale
monitoring with reduced labour costs. Trail cameras are increasingly used globally due to their ability
to study mammal occupancy, abundance, behaviour and distribution (Rovero et al., 2013). The
advanced development of infra-red trail cameras has greatly improved data output, with high quality
photographs/videos stored onto memory cards and able to work nocturnally (Kucera and Barrett,
2011). Despite their high cost, it has been evidenced that their use is cost-effective over long-term
studies (e.g. 5 years). Long-term studies also enable higher data output, thus explaining the method’s
popularity for large-scale monitoring programmes (O’Connell, Nichols and Karanth, 2011; Sam, 2011).
Although conventional trail cameras have evolved significantly in sensitivity due to their high resolution,
and are available for relatively cheap prices, they still present some major flaws. Trail cameras assume
that detection is constant, however imperfect detectability is a common sampling error (Anderson,
2001; Yasuda, 2004). This has been highlighted in a study in North Carolina where the Passive Infrared
Motion (PIR) detection in a model of trail camera often did not trigger and missed up to 14–16% of

Page | 8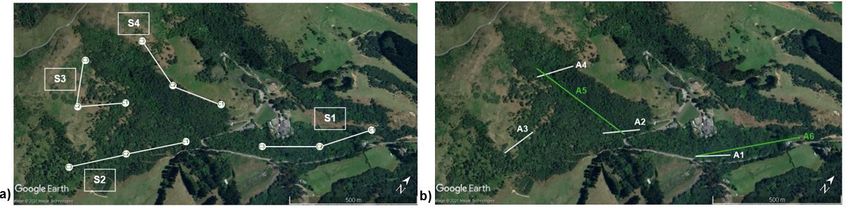
events with large, identifiable mammals (Urbanek et al., 2019). Smaller species also cause a challenge
as identification is difficult unless they remain still, unobstructed by vegetation and at close range.
Several smaller mammals and birds often evade detection altogether as the PIR is not triggered
(Urbanek et al., 2019; Yasuda, 2004).
To reduce imperfect detectability yet maintain the advantages trail cameras provide, the Cacophony
Project has focused on creating a standalone thermal camera to integrate into standard monitoring
practises. Thermal cameras have been used in wildlife studies since the 60s and many handheld
devices are widely available on the market (Karp, 2020). Thermal cameras work by detecting infrared
radiation emitted by objects, which provides a heat signature against the background (Havens and
Sharp, 2016). As the ambient temperature is significantly lower at night, the contrast in heat signatures
easily highlights animal presence. The basic build is a simple camera, covered with thermal material
and attached to a sensor. The sensor is a grid of pixels, which react to changes in thermal energy
emission. These signals are then processed by the camera, producing a colour map which is used to
render the display the user sees providing a simple yet effective device (FLIR®, 2021).
Recent technological advancements have seen the shift from handheld to drone and stand-alone
thermal cameras. In 2016 a study to identify koalas from drones provided a 100% accuracy from up to
60 m distance, however this was dependant on low forest cover (Corcoran et al., 2019). In New
Zealand, Landcare Research demonstrated that these aerial thermal cameras have been successful
for identifying large mammals, such as tahr, but that canopy cover poses a challenge for smaller
species. For accurate detection of smaller mammals higher sensitivity is needed (Dymond et al., 2000;
Wilde and Trotter 1999).
Therefore, the new land-based thermal camera developed by the Cacophony Project in 2018 aimed to
increase sensitivity and provide accurate multiple-species detection. Preliminary tests highlighted the
high sensitivity (5x) compared to trail cameras for multiple pests including mustelids, rodents, and
possums (Murphy et al., 2019). Other aims included providing a low maintenance device, which yields
both high quantity and quality data to optimise monitoring at a national scale. Integration of advanced
software allows automated video uploads alongside their associated base data (e.g. date and time)
and incorporation of Ai will eventually allow automatic species identification, thus reducing human
labour and bias significantly. The lowered data-collection costs allow videos to be favoured over
photos, which is often the opposite with trail cameras. Another advantage is that continuous uploads
to serves via a cellular network means study areas can be monitored at an almost real-time level. The
combination of these factors has meant preliminary field tests for the equipment have increased
analysis speed by up to 200x (Ross and Ryan, 2019, unpub; Ross et al., 2020). The device’s first
extensive monitoring experiment was conducted in Winter and Spring of 2020 looking to define a
standardised methodology for the equipment and assess its successes and highlight its limitations.
2.2 Objectives

The main aim of the study is to establish a baseline dataset using a standardised methodology for the
Cacophony thermal cameras. This field test will be completed with additional datasets produced in
Summer and Autumn 2021. The overall objective is to use these datasets to guide the documentation
for the equipment, which will be published for standardised use across New Zealand.

Individual objectives of this study were outlined as:

   1.   Determining data output quality and use in analysis
   2.   Training the AI and determining its accuracy
   3.   Highlighting differences between thermal camera monitoring and traditional methodologies
   4.   Understanding the limitations and assumptions of the study design
   5.   Noting issues with hardware or software and implementing improvements accordingly

Page | 9
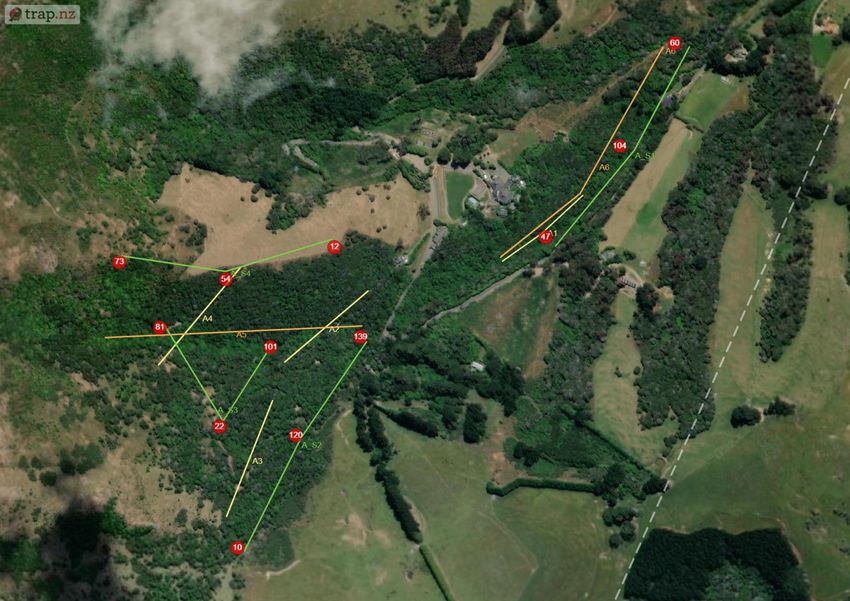
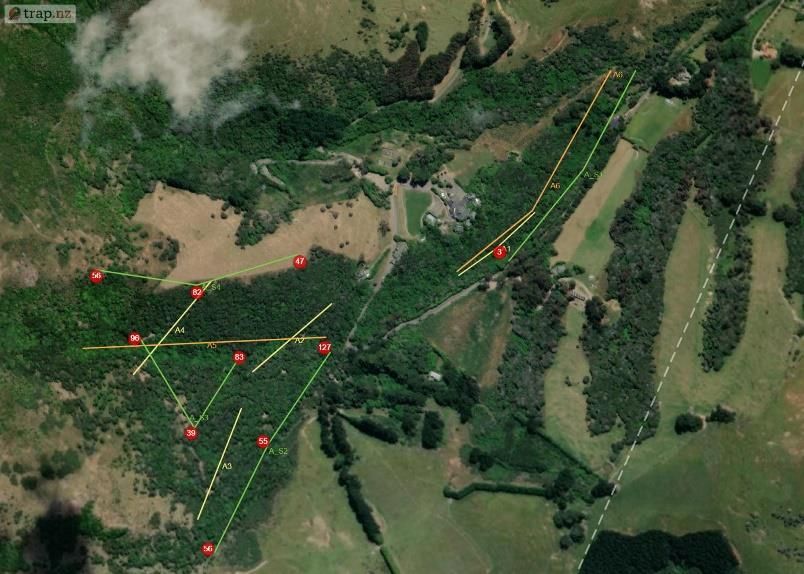
2.3 Methodology

Prior to this experiment traditional monitoring was undertaken from the 16th June-23rd June 2020. Six
transects were chosen in Section A avoiding overlap with proposed locations for the thermal camera
transects. Forty baited chew cards were deployed along four transects at 20 m spacing (10 cards per
line). Twenty tracking tunnels were deployed along two transects for tracking tunnels spaced at 50 m
(10 tunnels per line). Both were baited with peanut butter and left for 7 days before collection. The data
was then uploaded into Trap NZ and the Chew Card Index, Tracking Tunnel Index and Predator
Abundance Index calculated (See Table 2).
The study site was Living Springs (Chapter 1) and monitoring was limited to Section A (~48 hectares)
due to thermal camera availability and time constraints. The first half of the study was conducted across
two periods: Winter (5th-26th August 2020) and Spring (2nd-30th September 2020), each survey lasting
4 weeks. In advance to the main study, software was downloaded, and camera trigger times were
prepared. The thermal cameras were active from one hour before sunset and one hour after sunrise
(adjusted automatically using software linked to local solar data).

Systematic sampling was chosen using four transect lines at sampling intervals of 200 m randomly
placed in areas of native bush in Section A at varying elevations. To avoid saturation of the reserve
with multiple cameras, a technique created by Matthew Hellicar (Project Lead) called “set deployment”
was implemented. A “set” was defined as the number of cameras needed for one transect, calculated
based on area of study. “Set deployment” was defined as the movement of a set across a
predetermined number of transects over a specific period. The method recommends seasonal
deployments to provide annual patterns of seasonal variation.

Figure 1. a) Location of the four transects for the thermal camera sets, labelled S1-4 to indicate the order for set
deployment. Circles represent GPS location of each camera within a set. b) Location of traditional monitoring
experiment prior to the study. Highlighted are the transects for chew cards (A1-4) and tracking tunnels (A5 and
A6) (The Cacophony Project).

For this experiment three thermal cameras were installed on posts/tripods along transects at 200 m
intervals. In total there were 12 locations across Section A for both winter and spring, with each
monitoring their surrounding 4 hectares (Figure 1a). Elevation ranged from lowest (S1) – highest (S4)
with varying vegetation: S1 = native contiguous bush (by stream) S2 = native contiguous bush, S3 =
native patchy bush, S4 = forest edge.

Page | 10
a)                                      b)
Figure 2. a) Cacophony Thermal Camera attached to a post. b) View of Camera 1 on transect S3 during the
week start 12th August. View faces towards a baited chew card attached to a tree as a lure (The Cacophony
Project).

Installation involved angling the thermal camera to ensure a lure (usually attached to a tree) was in the
centre of the cameras view (Figure 2). The main lure was chew cards baited with peanut butter.
Additional bait (e.g. dried rabbit meat) were also used to expand range of species attracted. Every
Wednesday afternoon the cameras was moved to the next transect providing seven nights of data per
transects per set. A detailed field protocol was produced and then refined during the experiment and
can be found in Appendix I (A1).
The thermal camera was triggered if a heat source appeared and immediately recorded a video. Once
deployed these recordings were automatically uploaded to the Cacophony Cloud. Recordings could
then be classified by the Cacophony AI and sorted into both recordings and visits. Visits were defined
as a predetermined period where the AI determines the recordings to include the same individual. With
the AI still in training, manual tagging was necessary to check the accuracy, which was then calculated
using excel to assist future AI learning. This also ensured data were spot-checked before analysis
(Figure 3).

Figure 3. Example of a recording uploaded by Camera from transect S3 showing a possum, identified correctly
by the AI and confirmed by the user for AI training and to ensure accurate monitoring results (The Cacophony
Project).

Animals identified during the study were rodents, mustelids, hedgehogs, possums, cats, dogs, humans,
sheep, birds and invertebrates. Videos with obstructions or fast movement were categorised as
‘Unknown’.
Page | 11
After each month, the datasets were downloaded as csv files, automatically produced by the server,
and manipulated to fit into Trap NZ. TrapNZ is a free online service allowing monitoring records to be
uploaded from multiple sources to store, present and analyse data. A guide for uploading into Trap NZ
was created to assist anyone using Cacophony thermal cameras.
Presence/absence tables were made to calculate occupancy of each transect line per pest and non-
target species. Occupancy per species across the study site was calculated as the Predator Presence
Index (PPI). In addition, a simple Visit Abundance Index (VAI) was calculated. The results that previous
traditional monitoring yielded also had basic statistics calculated including the Chew Card Index (CCI),
Tracking Tunnel Index (TTI), and Predator Abundance Index (PAI) (Table 2).
Table 2. Indices calculated for all monitoring methods including their abbreviation, associated methodology,
definition, and source (Ruffell, Innes and Didham, 2014; Blackwell et al., 2002; DOC, 2021c, The Cacophony
Project).
      Indices                   Method                           Definition                            Source
                                                Proportion of chew cards bitten by a given        Ruffell, Innes and
 Chew Card Index     CCI   Chew Cards (CTC)
                                                                    species                        Didham, 2014
  Tracking Tunnel           Tracking Tunnels       Proportion of tunnels with tracks by a
                     TTI                                                                         Blackwell et al., 2002
       Index                      (TT)                         given species
                                                     Proportion of relative abundance
    Predator                Chew Cards and
                     PAI                        calculated for all transect lines in the study       DOC, 2021c
 Abundance Index            Tracking Tunnels
                                                  (both chew cards and tracking tunnels)
 Predator Presence         Cacophony Thermal     Proportion of presence of given species           The Cacophony
                     PPI
        Index                  Cameras                     across the study area                       Project
  Visit Abundance          Cacophony Thermal      Mean number of visits to a device by a           The Cacophony
                     VAI
        Index                  Cameras                         given species                           Project

Analysis was limited as only halfway into the study, but per season basic Trap NZ reports were
produced and examined. A portion of data from the winter monitoring were extracted to compare with
the traditional monitoring. The datasets were then discussed to prompt the initial documentation of a
protocol for the thermal camera.
The assumptions the methodology made were noted: 1) Target species will walk in front of camera if
in proximity 2) Target species will be clearly identifiable, 3) No pseudoreplication occurs 4) Populations
are closed (no immigration or emigration), 5) Sets cover a range of animal territories, therefore multiple
species will be recorded if present, 6) Sets are representative of nature as account for seasonal
variability, 7) the sampling area is representative of wider habitat occupied by pest species, 8) All users
can easily install the equipment, operate the online software and identify the animals accurately.
2.4 Results

In total the two seasons yielded 2026 results with 978 across the winter period and 1048 during spring.
For analysis, several data were excluded including insects, sheep, dogs, humans and false positives.
The remaining results gave a total of 975 visits in winter and 1041 in spring (including ‘Unknown’ data).
These were used to create pivot tables in excel for both seasons. These data were displayed as a bar
graph for visual representation (Figure 4). The data shown included the main pest species identified
(Rodents, Mustelids, Rabbits, Hedgehogs, Possums and Cats), non-target species (Birds) and data
tagged as ‘Unknown’ (presence of a species but unidentifiable). The results show high overall species
occupancy during both winter (88%) and spring (75%), with the graph highlighting rodents having the
highest no. of visits in both seasons. During winter rabbits were the only species not recorded, whereas
during spring no mustelids nor cats were recorded. Unidentified recordings were also displayed to
highlight imperfect detectability within the methodology.

Page | 12
Possum
Rodent
Mustelid
SPECIES TYPE
Hedgehog
Rabbit
Cat
Non Target (Birds)
Unspecified Winter Spring
0 100 200 300 400 500 600 700
NUMBER OF VISITS
Figure 4. Total number of visits per season (Winter and Spring) by given species across all four transect lines in
Section A. Rodents and possums were the most prevalent pests recorded during both seasons. Mustelids and
cats were only present in winter, whereas rabbits were only recorded during spring. Unspecified shows the largest
visible difference between seasons with 136 recorded in spring vs. 38 in winter.
Basic occupancy and abundance indices were calculated for each species per season (Table 3). The
Visits Abundance Index shows rodents as having the highest abundance, followed by possums. Every
other species had low values using this statistic. Occupancy was calculated by the Predator Presence
Index showing full detection of rodents during winter, with only one location (S2, Camera 3) not
detecting any rodents. The lowest PPI value of a present species were rabbits, with only one camera
(S4, Camera 1) detecting an individual across both seasons.
Table 3. The total visits and calculated VAI (Visit Abundance Index) and PPI (Predator Presence Index) values
for each species during both winter and spring results. Unknown data was removed, but one non-target species
(birds) was included.
Total Visits Mean VAI Mean PPI
Species Winter Spring Winter Spring Winter Spring
Possums 196 148 16.3 12.3 75% 67%
Rodents 621 668 51.6 55.7 100% 92%
Mustelids 2 0 0.17 0 17% 0%
Hedgehogs 17 6 1.42 0.5 17% 17%
Rabbits 0 1 0 0.08 0% 8%
Cats 2 0 0.17 0 17% 0%
Birds 56 82 4.7 6.9 58% 75%
Page | 13Once uploaded into Trap NZ, maps were produced to display areas of high pest occupancy (hotspots). Two maps were produced (winter and spring) for presentation to Pest Free Banks Peninsula and other organisations associated with predator control in New Zealand (Figure 5a and b). Full size of the maps at high resolution can be found in Appendix I (A2). Additional maps also including traditional monitoring results were also produced for reporting albeit are not included. Figure 5. Total number of visits at each location from all pest species across S1-4 transects over monitoring periods of a) Winter (5th-26th August 2020) and b) Spring (2nd-30th September 2020) (Map Courtesy of Trap NZ). Maps were also produced for each target pest species for each season individually and combined. These were used to identify high occupancy of a particular species for analysis. For example, Figure 6 shows the resulting map for possums (over both seasons) highlighting the highest occupancy was at the location of S4 Camera 2. Transect S1 shows full absence at the location for Camera 1 and 3 of possums across both seasons. Figure 6. Total number of visits of possums at each location across S1-4 transects over both seasons. The highest occupancy is at S3 Camera 2, whereas the lowest is at S1 with only one sighting at Camera 2 (Map Courtesy of Trap NZ). The traditional monitoring data were then analysed. Abundance indices including the Chew Card Index (CCI), Tracking Tunnel Index (TTI) and the Predator Abundance Index (PAI) were calculated for the Page | 14
three species of pest identified. The CCI results indicate a higher abundance of possums across the
A1-4 than both rats and mice. TTI results show similar abundance levels of both rodent types, whereas
rats were lower than mice, although this was not tested for significance.
Table 4. Abundance indices results for traditional monitoring (June 2020). Indices calculated were the Chew
Card Index (CCI), Tracking Tunnel Index (TTI) and the Predator Abundance Index (PAI) for the three identified
species (Possum, Rat and Mouse).

                                              Mean CCI         Mean TTI        Mean PAI

                             Possum             68%              N/A             68%

                               Rat              3%               35%             13%

                             Mouse              10%              40%             20%

Additionally, a table was produced to provide a visual comparison of the thermal camera data with the
traditional monitoring (Table 5). Data were chosen following the criteria: 1) similar transect length and
location and 2) same data collection length. The resulting datasets were the S1 transect consisting of
three cameras (5th-12th August) and the A6 tracking tunnel transect consisting of 10 tracking tunnels.
Table 5. Comparative table showing interaction data collected from the transect S1 (thermal cameras) and A6
(tracking tunnels). NI = Not identified using this monitoring method.

                                                         S1               A6

                                     Rodents             195              6*
                                      Birds               1               NI
                                     Possums              2               NI
                                  Unspecified             2               NI
                                     Total              200              6
                                *could be identified as 5 mice and 1 rat

2.5 Outcomes and Conclusions

The study achieved its main aim as baseline data for two seasons were produced using a standardised
methodology created for the Cacophony thermal cameras. In turn this led to multiple outcomes for the
project. Being in preliminary stages of field testing, presenting, and documenting the data was the most
crucial result. The results were presented to Pest Free Banks Peninsula to attract further funding as
well as to introduce the monitoring methodology and equipment to other organisations and initiate
collaboration. Developing the methods and highlighting limitations allowed for documentation. A field
guide was created and can be refined with further field testing. Another important step was the creation
of a protocol and with these results several aspects could be suitably documented. However, this is in
draft and will need iterations after the study is completed.
Objective 1: Data Output
One objective was to determine data output quality and its use for analysis. Occupancy data was the
most valuable output at this stage. Occupancy is defined as the proportion of a total area where a
target species is present (Bailey, Simons and Pollock, 2004; MacKenzie and Royale, 2005). For this
study, the Predator Presence Index was used to calculate occupancy as the proportion of species
present at any of the 12 monitoring stations. Areas of high occupancy were deemed hotspots and
regarded as top priority for pest control measures. As the goal of monitoring was to understand
distribution of predators, using occupancy rather than relative abundance allows several limiting
assumptions to be disregarded (e.g. pseudoreplication). For example, occupancy accounts for

Page | 15
imperfect detectability by being robust to false absences (MacKenzie et al., 2005). Therefore, absence of a species can be often attributed to factors other than detection probability. The results showed similarities of presence between both seasons for all species, however the actual variance was not statistically calculated as part way through the study. Overall, the top pest hotspot was Camera 1 on S2 for both seasons. There was a high presence of rodents across Section A regardless of season, vegetation, or elevation. Using the thermal cameras, it was near impossible to distinguish between mice and rats, however both are pests, thus fulfilling the purpose of monitoring anyway. Regarding possums, transects S2-4 had high presence, whilst S1 had one visit over both periods. Possums typically den in thick forested areas within tree hollows of large diameter (Ji et al., 2003). At Living Springs this habitat type is found at the higher elevations, which could explain the distribution. However, there could be multiple other reasons (e.g. human disturbance or food source) and as these factors were not analysed no solid conclusion can be drawn. However, it does highlight that pests are present in areas of low occupancy and should be considered when assessing control measures. Hedgehog occupancy was low, as anticipated due to the time of season. However, the two monitoring locations found activity in both winter and spring, indicating early emergence. There are multiple possibilities, such as climate change or disturbance of the hibernation site and with long-term monitoring in the area, these factors could be assessed to gain a better understanding. Signs of mustelids are present at Living Springs, however only one video-capture occurred. In New Zealand stoats exhibit predominantly diurnal behaviour, thus making their detection probability extremely low in this study. However, ferrets and weasels display nocturnal behaviour and have been found in high abundance on Banks Peninsula, therefore it is unknown why the occupancy was low, therefore further data collection is needed (Curnow and Kerr, 2017). Mustelids have high movement speeds and therefore some of the ‘unknown’ videos could have been ferrets or weasels, although this cannot be verified either. There is also the possibility sensitivity of the cameras needs to be increased to improve detectability of mustelids. A cat was also detected during this study, although whether feral or not could not be identified. Therefore, the thermal cameras could be used for targeting feral cats in areas where pets are known to be absent. At Living Springs, most birds are passerine species including the introduced common blackbird (Turdus merula), the native bellbird (Anthornis melanura) and the reintroduced native NZ pigeon (Hemiphaga novaeseelandiae). Several birds were detected during this study but could not be identified (to 100% accuracy). However, several of New Zealand’s endangered ground-dwelling birds which remain at highest threat from predators could be identified even at a high-level (Innes et al., 2009). Using cacophony thermal cameras to monitor these species could highlight areas for protection, dispersal and establishment of translocated populations and assist in decision-making for pest control measures. For more thorough analysis, occupancy of species could be calculated per transect for comparison of varying habitat type and elevation. Incorporating covariates into future field tests is important as time of night, home range, temperature, humidity, rainfall, and wind impact detection probability. Occupancy is also impacted by environmental factors (e.g. food sources) and disturbance (e.g. human activity) and is important to note if obtaining low occupancy results. Occupancy estimation provides more reliable results with repeated data (MacKenzie et al., 2005). Therefore, after completion of this study it is recommended that baseline data for Section B and C are also collected to create a robust sample size for further statistical modelling. A larger sample size and incorporation of covariates would allow temporal and spatial population trends to be assessed. Measuring absolute abundance of small mammal populations is extremely difficult (Blackwell et al., 2002). Therefore, within traditional monitoring DOC encourages using the CCI, TTI or PAI for direct comparison of habitat types, pre- and post-treatment studies or as a relative abundance estimate over time (DOC 2021). For the thermal cameras the Visit Abundance Index (VAI) did provide a basic statistic and often abudnance usually positively correlates with occupancy, however without the inclusion of covariates and noting that occupancy probability is resistant to abundance change, the current abundance results are not reliable (Karanth et al., 2011; Tobler et al., 2015). Although a relative abundance index in future studies could help understand population trends pre-and-post pest control measures and quantifying their success. Page | 16
There were other important factors found about the data output. Data volume was high, yet limited
labour was needed. The automation of uploads to the server provided an organised and fast way to
access data. The ability to download data into a universal format (e.g csv file) also provides an easy
option for people to store and analyse their data, and not rely solely on Cacophony software. The ease
of reduced labour yet high data volume results in a high scalability, which is needed if to be
implemented nationally. Multiple species detection was the other key advantage. The range of species
was high, from tiny rodents to sheep. Additionally, all pest species known at Living Springs were
detected, even if at a low occupancy (e.g. mustelids or rabbits). Not only were pests detected, but non-
target species (e.g birds) were recorded. Traditional chew cards were used as lures, yet many
recordings showed individuals never interacting with the lure. Therefore, highlighting the problem of
imperfect detectability in traditional methods and evidencing improved interaction rate for the thermal
cameras. Other factors contributing to improved interaction rate were identified as minimal habitat
disturbance, lack of light source and high sensitivity to triggering. The Cacophony project has recently
compared the main aspects of monitoring methodologies using data provided by DOC and Cacophony
itself (Table 6).
Table 6. Monitoring method aspects and their associated rating in New Zealand as determined by DOC and the
Cacophony Project.

                                        Data
                     Deployment                       Interaction      Data        Data
      Device                          Collection                                              Scalability
                       Effort                            Rate         Quality     Volume
                                        Effort
    Chew Card          Medium          Medium            Low           Low          Low          Low

 Tracking Tunnel       Medium          Medium          Very Low        High         High         Low
                                                                     High-Very   High-Very
   Trail Camera        Medium            High        Medium-High                               Medium
                                                                       High        High
    Cacophony
                       Medium            Low           Very High     Very High   Very High    Very High
     Camera

Despite having a lower resolution than advanced trail cameras, behavioural observation could still
occur at a small scale. Individual behaviours (e.g. movement) and inter/intra-species interactions (e.g.
predation) could be described. For example, Camera 2 on transect S4 captured a mustelid chasing a
rodent during the winter period. Thus, showing there are additional uses for the thermal cameras than
basic occupancy. Overall, this preliminary experiment showed high data quality and quantity without
compromise to labour efforts, inferring its’ importance for predator control in New Zealand.
Objective 2: AI Efficiency
The second objective was to train the AI and determine its accuracy. The current version of the device
already provides a more sensitive and automated way of analysing monitoring data than other
monitoring methods. The AI is also more advanced than many other AI-integrated trail cams (often
used by hunters). However, manual tagging was still needed as AI accuracy varied per species. For
example, in a Cacophony Project dataset of 112 videos tagged as possums by humans, the AI had
correctly tagged 69%. With more data there can be further AI training and improved accuracy.
Despite needing manual tagging to ensure accurate results, the process was speedy and efficient. The
ability to daily with automated sorting of the videos with associated data (e.g date/time/GPS) and a
user-friendly interface vastly reduced human labour. Future automation in tagging will also eliminate
human bias once refined. Having worked with trail camera data in the past, I can confirm these was
extremely fast to analyse in comparison – able to surpass 1000-2000 videos easily in a day with
minimal worry of human error and bias skewing the results. Thus, the thermal cameras offer many of
the advantages of trail cameras provide with the addition of reduced human labour. One downside of
the current system is the inability to recognise multiple individuals of the same species in a video,
however a tag can be added to train the AI further to refine this feature.

Page | 17
Another refinement needed is with the “visits” system in the Cacophony software. Currently the visits are classed by including any recording of the same species within five minutes. With the AI accuracy currently below 80% for most species, the recordings require tagging before the visits feature can be used. Sorting videos into visits is still beneficial over analysing recordings as it accounts for a level of pseudoreplication. It should be considered that species’ biology varies, and standardised lengths of visits could be altered to fit different species for more reliable results. Objective 3: Comparison with Traditional Monitoring The third objective was to highlight differences between the Cacophony thermal cameras and traditional monitoring. Each monitoring method yielded abundance/presence indices, however due to their differing value type, they cannot be directly compared statistically. Therefore, to visualise the differences in data volume/quality between thermal cameras and traditional monitoring, data were manually compared. The traditional monitoring carried out only lasted 7 days but with the set deployment each thermal camera location was monitored for only 7 days during the month. Therefore, data could easily be extracted from one transect for comparison. Transects S1 and A6 were chosen due to their similar location (same elevation, terrain and habitat type). Important differences found were that tracking tunnels can only identify rodents and mustelids but have the benefit of identifying diurnal species. However, thermal cameras can identify a wider range of species as well as providing behavioural observation. Whilst tracking tunnels could differentiate between rodents (mice and rats), this is often irrelevant in pest control measures as both are caught using the same trapping techniques. However, it is important to note if unable to distinguish then both rats and mice needed to be targeted due to their own interspecies relationships (Curnow and Kerr, 2017). The largest difference between the methods was data volume, with the quantity of thermal camera data was 3333x higher than for the tracking tunnels over the same collection time. These magnitudes of difference in data volume are likely due to imperfect detection and interaction rate of the traditional methods. Further comparisons of traditional vs. thermal camera monitoring should be carried out in future research to evidence the validity of this result for use a key advantage over current methods used in New Zealand. Objective 4: Limitations Understanding limitations are key parts of any study and vital when developing surveying methods. The main limitation of thermal cameras is their ability to only identify warm-blooded, nocturnal animals. Fortunately, several pest species in New Zealand fall into this category and were detected during the study (Curnow and Kerr, 2017). Currently other organisations are using Cacophony equipment to monitor larger pests such as wallabies in other habitat types (e.g. open planes) and have highlighted a limitation. During installation the camera must not encompass any sky as this affects the thermal imaging thus skewing the data, but can be difficult if needing a wider scope of view for larger animals. The Cacophony thermal cameras have a high cost (NZ$3000) due to their advanced technology. However limited devices are needed per site the cost thus can be considered an investment for long- term monitoring projects. It is also important to note the concept of Moore’s Law, which states that the number of transistors on a chip doubles every two years (Padua et al., 2011). This is relevant as it outlines the ideology that every few years technology becomes more advanced, yet the relative cost is reduced. Therefore, the price of the thermal cameras will reduce as their technology is improved further evidencing their cost-effectiveness, similar to the trend with trail cameras (Sam, 2011). The numerous other advantages of the device could negate the cost especially for large funding bodies such as Pest Free Banks Peninsula. The assumptions listed in the methodology need to be accounted for if conducting occupancy and abundance studies using Cacophony thermal cameras. Assuming a population is closed in a wild population is near-impossible and will inevitably reduce precision of the study. However, several statistical models (e.g N-mixture) can account for this, thus can be incorporated into analysis when the study is complete (Dénes, Silveira and Beissinger, 2015). Imperfect detectability is a known challenge for most monitoring technique (Archaux, Henry and Gimenez, 2012). Despite the thermal cameras’ high sensitivity and capture rates, there are still issues with unidentified data. Approximately 11% (8% Page | 18
You can also read