FLASH DROUGHT
CURRENT UNDERSTANDING & FUTURE PRIORITIES
←
→
Page content transcription
If your browser does not render page correctly, please read the page content below
FLASH DROUGHT CURRENT UNDERSTANDING & FUTURE PRIORITIES
LEAD AUTHORS CONTRIBUTING DESIGN & LAYOUT
Molly Woloszyn AUTHORS Fiona Martin
CIRES (University of Visualizing Science
Veva Deheza
Colorado Boulder), NOAA
NOAA National Integrated
National Integrated Drought
Drought Information System
Information System
Mike Hobbins
Marina Skumanich
CIRES (University of
UCAR (University
Colorado Boulder), NOAA
Corporation for Atmospheric
Physical Sciences Laboratory
Research), NOAA National
Integrated Drought Andy Hoell
Information System NOAA Physical Sciences
Laboratory
Joel Lisonbee
CIRES (University of Jason Otkin
Colorado Boulder), NOAA University of Wisconsin-
National Integrated Drought Madison/Space Science and
Information System Engineering Center
Mark Svoboda
University of Nebraska-
Lincoln/National Drought
Mitigation Center
Hailan Wang
NOAA Climate Prediction
Center
SUGGESTED CITATION
Woloszyn, M., M. Skumanich, J. Lisonbee, V. Deheza, M. Hobbins, A. Hoell,
J. Otkin, M. Svoboda, H. Wang. 2021. Flash Drought: Current Understanding
and Future Priorities; Report of the 2020 NIDIS Flash Drought Virtual
Workshop. NOAA National Integrated Drought Information System.
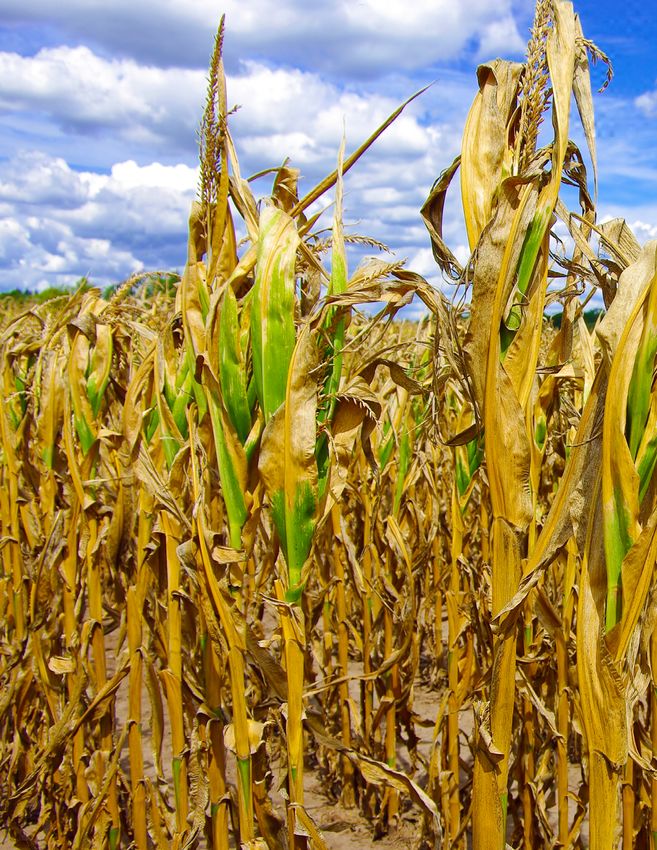
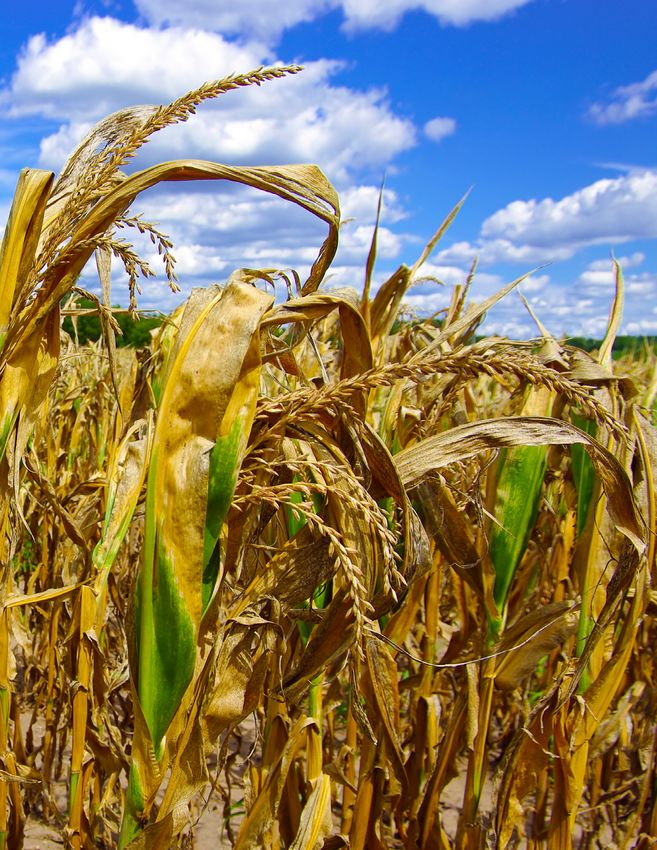
◀ ON THE COVER Drought-
damaged cornfield on a
farm in southern Wisconsin.
Credit: Earl D. Walker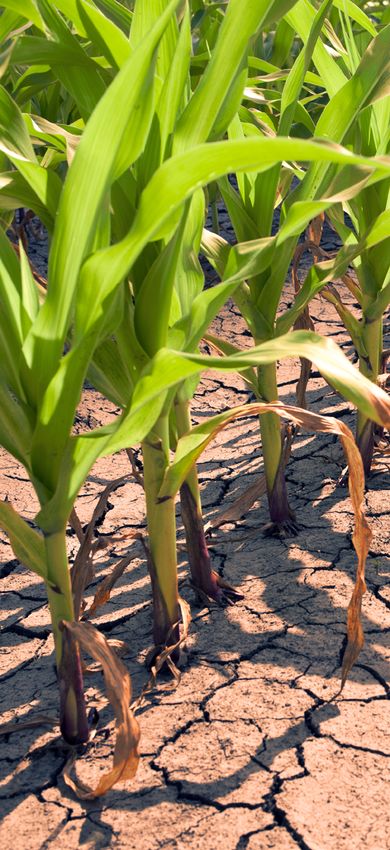
TABLE OF CONTENTS
Executive Summary                                                                                                   5

1. Introduction                                                                                                        8
1.1 About NIDIS........................................................................................................9
1.2 About Flash Drought......................................................................................10
1.3 Workshop Objectives and Structure...........................................................11
1.4 Organization of this Report...........................................................................12

2. Workshop Agenda and Highlights                                                                            13
2.1 Workshop Agenda..........................................................................................13
2.2 Highlights from Each Session.......................................................................14
      2.2.1 Session 1: Scene Setting—Going Beyond Research..................14
      2.2.2 Session 2: Exploring Flash Drought Characteristics...................15
      2.2.3 Session 3: Shaping Tools/Research to Meet User Needs..........16
      2.2.4 Session 4: Identify Research Needs in Monitoring,
      Prediction, and Planning/Response�����������������������������������������������������17
      2.2.5 Session 5: The Path Forward..........................................................19

3. Key Takeaways                                                                                                21
3.1 Characterizing Flash Drought.......................................................................21
3.2 Indicators of Flash Drought..........................................................................24
3.3 Practitioner Engagement..............................................................................25
      3.3.1 Key Takeaways from the VPC Exercise on User Needs..............25
3.4 Research and Applications Needs for Flash Drought
Monitoring, Prediction, and Planning/Response...........................................26
      3.4.1 Monitoring..........................................................................................26

                            NIDIS FLASH DROUGHT VIRTUAL WORKSHOP                                                           3
3.4.2 Prediction...........................................................................................27
      3.4.3 Planning and Response...................................................................29
      3.4.4 Cross-Cutting Themes......................................................................30
3.5 Summary of Key Takeaways.........................................................................31
      3.5.1 Characterizing Flash Drought.........................................................31
      3.5.2 Practitioner Engagement................................................................31
      3.5.3 Research and Applications..............................................................31

4. Priority Actions                                                                                                  32
4.1 Clarifying the Concept of Flash Drought....................................................33
4.2 Practitioner Engagement..............................................................................33
4.3 Flash Drought Monitoring.............................................................................34
4.4 Flash Drought Prediction..............................................................................34
4.5 Planning/Response for Flash Drought.......................................................35
4.6 Network Building and Coordination...........................................................35
4.7 Summary..........................................................................................................35

Appendix A: Comprehensive List of Research and
Application Needs, and Opportunities to Leverage                                    36
     A.1 Monitoring Research and Application Needs.................................36
     A.2 Prediction Research and Application Needs..................................38
     A.3 Planning and Response Research and Application Needs.........40

Appendix B: Workshop Agenda                                                                                       42

Appendix C: Workshop Attendees                                                                                    45

Appendix D: Acronyms                                                                                              53

                            NIDIS FLASH DROUGHT VIRTUAL WORKSHOP                                                          4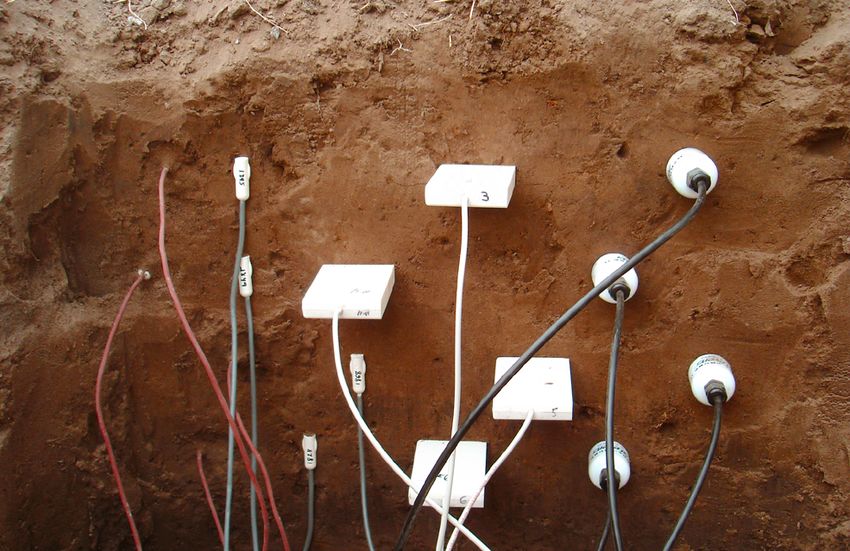
A storm
                                                                                               approaches over
                                                                                               an arid landscape
                                                                                               and windmill in
                                                                                               Kansas. Credit:
                                                                                               Scott Book

EXECUTIVE SUMMARY
Droughts are often thought of as slow-moving natural hazards. However, some serious droughts occur
with such rapid onset that it seems as if they appear in a “flash,” rendering them and their consequences
hard to predict and prepare for. These flash droughts can have substantial agricultural and economic
consequences, including billions of dollars in losses.
Various notable flash droughts over the past several years (e.g., the Central U.S. in 2012, Northern Plains in 2017,
and Southeast U.S. in 2016 and 2019) have sparked intense interest in flash drought by both the research commu-
nity as well as drought managers/practitioners (hereafter “practitioners”) and the public.

There are differing understandings of what flash drought is and how it differs from other types of drought. Equally
important, there is widespread recognition that existing monitoring and forecasting products and tools do not
provide adequate early warning for flash drought. To address these issues, National Oceanic and Atmospheric
Administration (NOAA) National Integrated Drought Information System (NIDIS) held a virtual workshop in Decem-
ber 2020 that convened researchers, practitioners, and other interested stakeholders to explore characteristics
and definitions of flash drought, and to coordinate and co-develop a research agenda to address its associated
management challenges. This report describes the workshop’s key takeaways and provides a list of priority actions

                                                          NIDIS FLASH DROUGHT VIRTUAL WORKSHOP                         5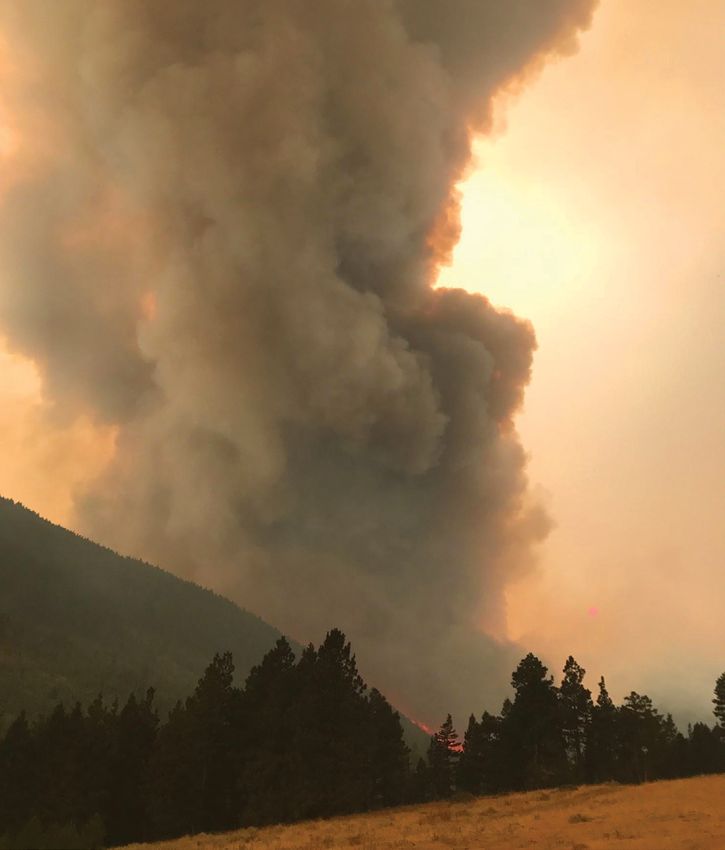
to help both NIDIS and the broader research commu-
                                                             nity advance flash drought research activities and tool
    The Flash Drought Virtual Workshop                       development.
    was structured to address four main
    objectives:                                              In total, around 120 people attended the workshop,
                Strive for agreement on the basic            representing academia, government (foreign, federal,
                set of characteristics to which              state, local), nonprofit organizations, and other inter-
                definitions of flash drought should          ested stakeholders. A series of five sessions over three
                adhere and explore “most useful”             days included a combination of presentations, plenary
                flash drought definitions by sector,
                                                             discussions, and small breakout groups designed to
                region, and application.
                                                             encourage broad dialogue. The workshop provided one
                                                             of the first opportunities for a structured discussion on
                Discuss, understand, and
                document how existing monitoring             the concept and implications of flash drought between
                and prediction tools and research            researchers and the practitioners who have to manage
                can be shaped to meet user needs             and respond to flash droughts.
                around flash drought, both in the
                near term and in the future.                 There was widespread agreement that there needs to
                                                             be a more definitive characterization of flash drought—
                Develop a list of outstanding                one that is developed with practitioner engagement.
                research needs in monitoring,                There was strong consensus that the key feature of flash
                prediction, and planning/response            drought is rapid onset/rapid intensification of drought
                to improve early warning of flash            conditions, although more remains to be settled about
                drought.
                                                             how those two concepts differ and how exactly to stan-
                                                             dardize terms like “rapid.” Another strong consensus
                Agree upon next steps for this
                emerging domain and how NIDIS                view was that regionality, seasonality, and impacts are
                and other partners can support               essential attributes for characterizing flash drought,
                research and coordination related            implying a need for an integrated set of indicators, given
                to flash drought.                            the complexity of the phenomenon and its cascading
                                                             impacts.

                                                              Important items to advance applied research on flash
                                                              drought include: (1) identifying the key indicators
specific to flash drought to use for drought monitoring, and including these also in prediction products; (2) research-
ing the cascading and compounding impacts of flash drought; and (3) finding ways to effectively communicate
the research results to those planning/responding to drought conditions. Activities that were identified as of high
importance but likely difficult were to increase in situ and remotely-sensed monitoring (in order to improve the
tools/data that are currently available) and also to predict flash drought at lead times of weeks to months.

Finally, attendees also stressed the importance of improved collaboration between researchers involved with moni-
toring flash drought and those involved with prediction, and between researchers and the practitioners managing
flash drought response and planning.

Based upon the discussions at the workshop, as well as a more general analysis of workshop materials and subse-
quent discussion, a series of priority objectives and actions have been identified to guide the research agenda for
flash drought:

 • Forge consensus on a general framework for characterizing flash drought, by sponsoring a collaborative
   process that includes both research and practitioner communities.

                                                           NIDIS FLASH DROUGHT VIRTUAL WORKSHOP                           6
• Characterize the various
   ways in which flash drought
   manifests by region and
   season, including identifying
   key indicators specific to flash
   drought, and their thresholds
   and appropriate triggers for
   action.
 • Better understand
   practitioner perceptions
   of flash drought and their
   needs for improved flash
   drought preparedness and
   response, via a series of focus
   groups organized by NIDIS
   Drought Early Warning (DEWS)
   regions.
 • Increase real-time data (e.g., soil moisture, evapotranspiration, streamflow, and                  ▲ Agricultural
                                                                                                      field on which,
   other key variables) to improve monitoring and prediction tools and to make high-                  due to a drought,
   quality datasets available for general research.                                                   the green leaves
                                                                                                      of sugar beets
 • Establish a baseline of flash drought impacts and monitoring resources, including                  have wilted.
                                                                                                      Credit: rsooll
   such components as a catalogue of existing flash drought-relevant observational data
   and tools, and a database of flash drought impacts.
  • Better understand the limits of flash drought predictability, by supporting research to identify new
    sources of predictability for flash drought by region.
  • Improve forecast models to better support flash drought prediction, including higher resolution, longer
    hindcasts, consistent initialization protocols, and advanced land surface models that incorporate flash
    drought-related land surface processes (e.g., dynamic vegetation).
  • Develop practical decision-support tools to help decision makers identify when they are in a flash drought,
    or could experience flash drought development, and what potential response options might be available.
  • Improve the ability to communicate about flash drought—what it is and how it manifests in the
    environment, by supporting research into people’s perception/understanding of flash drought and how
    best to communicate flash drought implications to a general audience.
  • Build stronger connections and coordination between flash drought researchers and practitioners,
    by providing ongoing opportunities for sharing, including a regular forum (e.g., an annual flash drought
    conference).

This is an ambitious set of activities to improve flash drought monitoring, prediction, and planning/response.
Working with partners at all levels, NIDIS will use this as the basis for an ongoing agenda for flash drought. This set
of objectives, along with other findings in this report, may be useful to other agencies, organizations, researchers,
and policy makers as we collectively work to improve both national and regional capacity for flash drought early
warning and response.

                                                           NIDIS FLASH DROUGHT VIRTUAL WORKSHOP                           7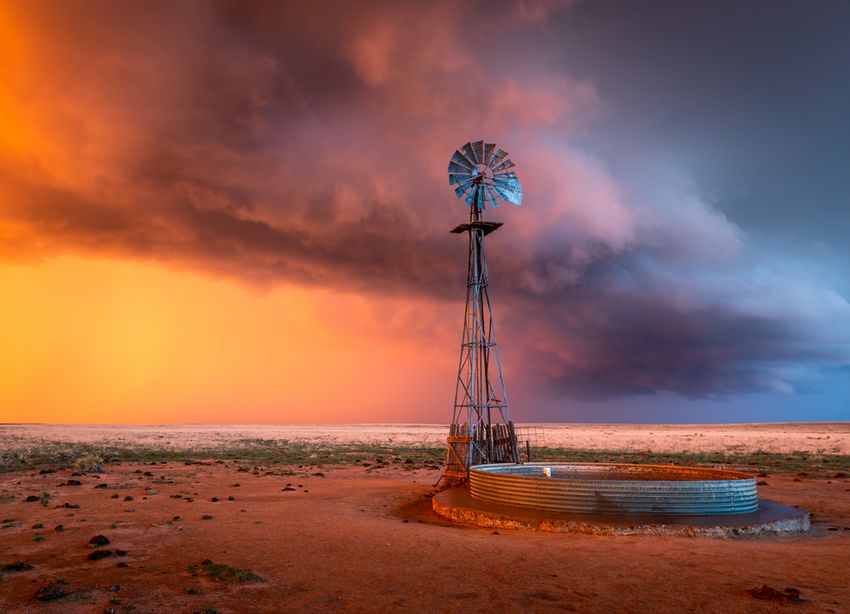
INTRODUCTION

   The Alice Creek Fire started
   by lightning strike on July 22,
   2017, near Lincoln, Montana.
   Because of extremely low
   humidity, above-average
   temperatures, and windy
   conditions, fire fighters
   struggled to contain the blaze.
   It eventually burned a total of
   29,252 acres and four buildings.
   Credit: U.S. Forest Service

                                      NIDIS FLASH DROUGHT VIRTUAL WORKSHOP   8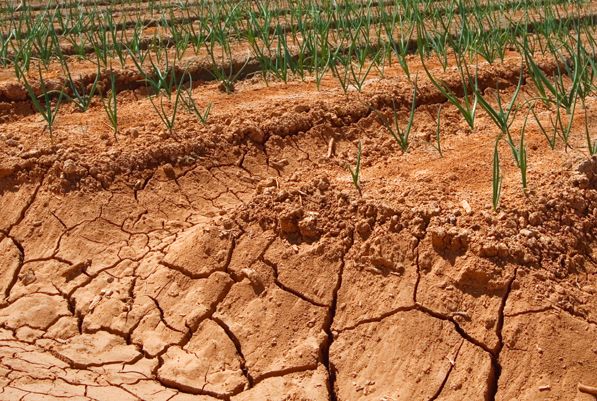
1
INTRODUCTION
Droughts are often thought of as slow-moving natural hazards. Occasionally, serious droughts
occur with such rapid onset that it seems as if they appeared in a “flash,” rendering them and
their consequences hard to predict. Often occurring in the central and eastern U.S. during the
warm season, flash droughts can have substantial agricultural and economic consequences.
The 2012 flash drought across the Central U.S. affected            Drought Information System (NIDIS) held a virtual
approximately 80% of U.S. agricultural land,1 result-              workshop in December 2020 that convened research-
ing in $34.5 billion in economic losses.2 More recently,           ers, practitioners, and other interested stakeholders to
the 2017 Northern Plains flash drought was associated              explore characteristics and definitions of flash drought,
with fires that burned 4.8 million acres and U.S. agri-            and to coordinate and co-develop a research agenda
cultural losses in excess of $2.6 billion dollars.3 In both        to address its associated management challenges. This
of these events, neither the drought’s swift onset nor             report describes the workshop’s key takeaways and
its severity was forecast in a timely manner. Episodes             provides a list of priority actions to help both NIDIS
like these have been observed around the country in                and the broader research community to advance flash
the last several years and have sparked intense inter-             drought research activities and tool development.
est in flash drought in both the research community
and the practitioner/end user4 (hereafter “practitioner”)
community. While a clear conceptualization of flash                1.1 ABOUT NIDIS
drought is important to both groups, there are differing           NIDIS was authorized by Congress in 2006 (P.L. 109-430)
understandings and therefore some confusion on what                with a mandate for interagency coordination and inte-
flash drought is and how it differs from other types of            grated drought research that builds upon existing
droughts. Equally important, there is widespread recog-            federal, tribal, state, and local partnerships to create
nition that existing monitoring and forecasting products           a national drought early warning system (DEWS). The
and tools5 do not provide adequate early warning for               program was reauthorized in 2014 (P.L. 113-86) and
flash drought.                                                     again in 2019 (P.L. 115-423). NIDIS is working toward
                                                                   this goal by developing a network of regional DEWS.
To address these issues, National Oceanic and Atmo-                These regional DEWS utilize existing networks of federal,
spheric Administration (NOAA) National Integrated                  state, local, academic, private sector, and other partners
                                                                   to make climate and drought science readily available,

1 https://www.ers.usda.gov/webdocs/publications/45066/37191_err-148-summary.pdf?v=3645.3
2 https://www.ncdc.noaa.gov/billions/events/US/2012
3 https://www.drought.gov/documents/flash-drought-lessons-learned-2017-drought-across-us-northern-plains-and-canadian
4 “End user,” “user,” and “practitioner” are terms used in this report to represent individuals who are responsible for alerting
  others to, preparing for, and/or managing drought on the ground, i.e., those who use flash drought monitoring, prediction, and
  planning/response resources. This would include both those serving in an advisory capacity (e.g., state climatologists) and
  those directly impacted by drought (e.g., producers, water managers, the public). “Decision makers” is used to indicate those
  practitioners who must make specific decisions relative to drought management or response.
5 The terms “products” and “tools” are intended to include databases, maps, applications, websites, and other such resources
  designed to assist in the monitoring, prediction, or planning/response to drought. Throughout the document these terms are
  used interchangeably, although the predominant term used is “tools.”

                                                                NIDIS FLASH DROUGHT VIRTUAL WORKSHOP                               9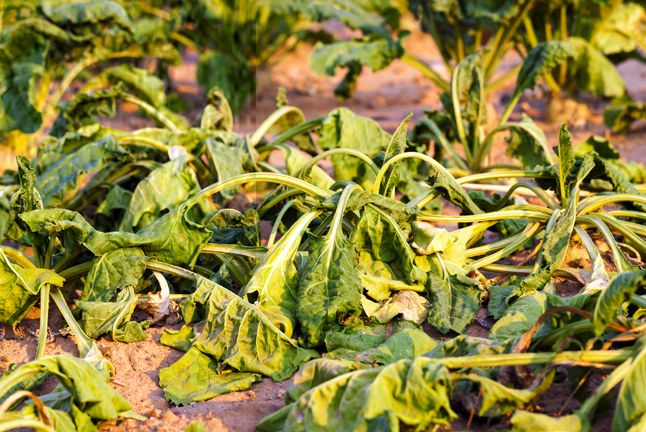
easily understandable, and usable;
and to improve regional capacity to
respond to and cope with drought.                    What is Flash Drought?
                                                     Flash drought is a subset of other drought types that is defined by
                                                     the rapid onset or intensification of drought conditions culiminating
1.2 ABOUT FLASH                                      in impacts to one or more sectors (agricultural, hydrological, etc.).
DROUGHT
In its simplest form, flash drought
                                                     Types of Drought
is the rapid onset or intensifica-
                                                                  Meteorological drought refers to a deficit compared to
tion of drought conditions, unlike                                average precipitation over a period of time for a given
conventional droughts which                                       location.
evolve more slowly. Flash droughts
are driven by prolonged periods of                                Agricultural drought occurs when plant water
reduced precipitation, abnormally                                 requirements are unmet during the growing season,
high temperatures, winds, and/or                                  especially during certain periods critical for yield
incoming radiation that leads to                                  development.
abnormally high evapotranspira-
tion (ET) rates. Flash droughts seem                              Hydrological drought develops if deficits in net surface
to occur more often than generally                                water supply become large enough to reduce river,
perceived and can cause major                                     reservoir, or groundwater levels.
agricultural and other losses, which
                                                                  Socioeconomic drought considers the impact of
may be exacerbated in the absence
                                                                  drought conditions on the supply and demand of
of timely prediction and detection.                               economic goods and services.

For example, the 2012 flash drought                           Ecological drought has been proposed by Crausbay
over the central U.S. was the most                            et al. 2017, referring to an episodic deficit in water
spatially extensive drought to affect                         availability that leads to ecosystem declines and affects
the country since the Dust Bowl of                            ecosystem services.
the 1930s. Moderate to extreme
drought conditions affected more
than half the country for most
of the year, and had a significant                                 Drought Monitor (USDM), many locations across the
impact on the entire Central Plains’ summer growing                central United States during the 2011 and 2012 flash
season. This drought brought the greatest summertime               droughts experienced up to a three-category increase
rainfall deficit to the Central Plains in 117 years, surpass-      in drought severity in only one month, meaning that
ing 1934, 1936, and 1988.6 Drought conditions affected             areas that were drought free at the beginning of the
approximately 80% of U.S. agricultural land,7 resulting            month were characterized by severe to extreme drought
in $34.5 billion in economic losses.8 The unique aspect            conditions by the end of the month.” Hoerling et al.
of the 2012 drought is how quickly it developed. Otkin             (2013)10 reported that NOAA operational forecasts in
                         9
et al. (2016, p 1,073) wrote, "...according to the U.S.            May failed to predict below-average precipitation that

 6 Hoerling, M., J. Eischeid, A. Kumar, R. Leung, A. Mariotti, K. Mo, S. Schubert, and R. Seager, 2014: Causes and Predictability of the
   2012 Great Plains Drought. Bull. Am. Meteorol. Soc., 95, 269–282, https://doi.org/10.1175/BAMS-D-13-00055.1.
 7 https://www.ers.usda.gov/webdocs/publications/45066/37191_err-148-summary.pdf?v=3645.3
 8 Supra 2: https://www.ncdc.noaa.gov/billions/events/US/2012
 9 Otkin, J. A., M. C. Anderson, C. Hain, M. Svoboda, D. Johnson, R. Mueller, T. Tadesse, B. Wardlow, and J. Brown, 2016: Assessing
   the evolution of soil moisture and vegetation conditions during the 2012 United States flash drought. Agric. For. Meteorol.,
   218–219, 230–242, https://doi.org/10.1016/j.agrformet.2015.12.065.
10 Hoerling, M., S. Schubert, and K. C. Mo, 2013: An Interpretation of the Origins of the 2012 Central Great Plains Drought
   Assessment Report. 50 pp. Available online at https://psl.noaa.gov/csi/factsheets/pdf/noaa-gp-drought-assessment-report.pdf

                                                                     NIDIS FLASH DROUGHT VIRTUAL WORKSHOP                                  10
led to drought conditions in the central U.S. from June “most useful” flash drought definitions
to August. During this time, the term “flash drought” by sector, region, and application.
began to resonate with both the media and the scien-
• Discuss, understand, and document how existing
tific community in the United States.11
monitoring and prediction tools and research
can be shaped to meet user needs around flash
The term “flash drought” can be found in the scientific
drought, both in the near term and in the future.
literature as early as 2002, but research on the topic
significantly increased following the 2012 Central U.S. • Develop a list of outstanding research needs in
drought. The American Meteorological Society’s Glos- monitoring, prediction, and planning/response
sary of Meteorology defines “flash drought”12 as “an to improve early warning of flash drought.
unusually rapid onset drought event characterized by • Agree upon next steps for this emerging
a multiweek period of accelerated intensification that domain and how NIDIS and other
culminates in impacts to one or more sectors (agricul- partners can support research and
tural, hydrological, etc.).” Despite this definition and a coordination related to flash drought.
proposal in Otkin et al. (2018, p.918)13 to define flash
drought by “its rate of intensification rather than its The workshop was initially planned as an in-person
duration,” until 2020 there had been no clear indication event to be held in Boulder, Colorado in June 2020 but
that the research community was coalescing around a transitioned to a virtual workshop in December 2020
definition of flash drought. Within the literature, two due to the COVID-19 pandemic. As a virtual workshop,
principles are generally applied: (1) rapid onset or inten- this event attracted not only
sification of drought, and/or (2) short, intense drought an audience across the United
events.14 The rapid development and heterogeneous States, but an international
nature of flash drought research, as well as the potential audience as well, with attend- Workshop Topics
disconnect between research and practitioner commu- ees from Australia, China, the
nity perceptions of flash drought, motivated NIDIS’s Philippines, the Caribbean, What are the basic
interest in helping to clarify the concept of flash drought and Europe. In total, around characteristics of flash
and coordinating the development of an agenda to 120 people attended the work- drought?
improve flash drought early warning capabilities. shop, representing academia,
government (foreign, federal, How are existing tools
state, local), nonprofit policy meeting user needs?
1.3 WORKSHOP OBJECTIVES groups, and other interested
AND STRUCTURE stakeholders (see Figure 1.1). What are key research
needs in monitoring,
The motivations for the workshop were to bring together
prediction, and
researchers and practitioners to collaboratively explore The workshop was organized
planning/response?
and expand understandings of flash drought and to by NIDIS with the assistance
co-develop a path forward for research activities and of a planning team includ- How can NIDIS and
product development. To that end, the workshop was ing Andy Hoell (NOAA Phys- other partners better
structured to address four main objectives: ical Sciences Laborator y support research and
(PSL)), Jason Otkin (Univer- coordination?
• Strive for agreement on the basic set of sity of Wisconsin-Madison/
characteristics to which definitions of Space Science and Engineer-
flash drought should adhere and explore ing Center), Mark Svoboda
11 Otkin, J. A., M. Svoboda, E. D. Hunt, T. W. Ford, M. C. Anderson, C. Hain, and J. B. Basara, 2018: Flash Droughts: A Review and
Assessment of the Challenges Imposed by Rapid-Onset Droughts in the United States. Bull. Am. Meteorol. Soc., 99, 911–919,
https://doi.org/10.1175/BAMS-D-17-0149.1
12 https://glossary.ametsoc.org/wiki/Flash_drought
13 Supra 11: Otkin et al., 2018.
14 Lisonbee, J., M. Woloszyn, M. Skumanich, 2021: Making sense of flash drought: definitions, indicators, and where we go from
here. Journal of Applied and Service Climatology, Volume 2021, Issue 001, http://doi.org/10.46275/JOASC.2021.02.001
NIDIS FLASH DROUGHT VIRTUAL WORKSHOP 112% 5%
5%
Federal agency
State agency
39% Local government
Flash drought
University
workshop
participants by Nonprofit or
organization type nongovernmental
organization
45% Private sector
International
7% ◀ Figure 1.1: Flash
drought workshop
participants by
organizational
type.
1%
(University of Nebraska-Lincoln/National Drought presentations, and other meeting materials to support
Mitigation Center), Mike Hobbins (University of Colo- subsequent analyses. All of these materials were used
rado-CIRES and NOAA PSL), Veva Deheza (NIDIS Exec- as the basis for this report.
utive Director), and Roger Pulwarty (NOAA PSL). The
planning team provided NIDIS with guidance on topics
to cover, based on the current state of science, and feed- 1.4 ORGANIZATION OF THIS REPORT
back on the objectives and structure of the workshop. Chapter 2 provides a more detailed review of the work-
shop agenda along with highlights from each session.
Through a series of five sessions over three days, A full discussion of key takeaways, organized by work-
each of the workshop objectives were addressed in shop objectives, is presented in Chapter 3. Finally,
turn. The sessions included a combination of presen- Chapter 4 provides a series of priority action items to
tations, plenary discussions, and small breakout advance flash drought early warning; these were based
groups designed to encourage broad dialogue. NIDIS on discussions at the workshop, a prioritization exercise
staff recorded the workshop, took extensive meeting on the last day, and a subsequent analysis of workshop
notes, and saved the “chat box” dialogue, breakout materials.
NIDIS FLASH DROUGHT VIRTUAL WORKSHOP 12WORKSHOP
Agricultural field
on which, due to a
drought, the green
leaves of sugar
beets have wilted.
Credit: rsooll 2
WORKSHOP
AGENDA AND
HIGHLIGHTS
2.1 WORKSHOP AGENDA
The workshop agenda was organized to address each
of the four objectives in sequence. Each day focused on
one or two objectives, which provided time to explore
each topic and build a shared understanding of key
issues. The full agenda is provided in Appendix B.
Day 1: Setting the context and exploring
the concept of flash drought
The first day consisted of two sessions related to
Objective 1: Strive for agreement on the basic set of
characteristics to which definitions of flash drought
should adhere; explore “most useful” flash drought
definitions by sector, region, and application.
• Session 1: Scene Setting—Going Beyond
Research: This session provided a shared
context on the overall issue of flash drought.
It included a presentation on how the term
“flash drought” was first used, as well as three
presentations by practitioners on their own
experiences managing flash droughts.
• Session 2: Exploring Flash Drought
Characteristics: This session included initial
presentations on how the term ‘flash drought” is
understood by both researchers and practitioners,
and then transitioned to a breakout session
allowing open discussion about how participants
thought “flash drought” should be characterized.
NIDIS FLASH DROUGHT VIRTUAL WORKSHOP 13discuss potential research activities and tool-
A farmer checks development projects in small groups.
the soil. Credit:
ESB Professional • Session 5: The Path Forward: The final session
pulled together lists of potential projects in
each topic area from the previous sessions and
ranked them according to importance (impact,
value, etc.) and ease. This session included an
in-workshop prioritization polling exercise and
a discussion on a virtual white board to arrive at
a short-list of priorities for possible next steps.
2.2 HIGHLIGHTS FROM EACH SESSION
2.2.1 Session 1: Scene Setting—
Going Beyond Research:
The workshop began with a series of presentations from
individuals who have experience communicating and/
Day 2: Existing tools vs. user needs or managing past flash drought events. These presen-
The second day (Session 3: Shaping Tools/Research to tations served to underscore the difficulties posed by
Meet User Needs) was focused on Objective 2: Discuss, flash drought to sectors of the economy and environ-
understand, and document how existing monitoring ment, and the importance of developing better early
and prediction tools and research can be shaped to warning indicators and systems.
meet user needs both in the near-term and in the
future. A value proposition canvas15 technique was Mark Svoboda, Director of the National Drought Miti-
used to explore what “users’ needs” (i.e., practitioners’ gation Center (NDMC) and Associate Professor at the
needs) are relative to flash drought management and University of Nebraska-Lincoln, initiated the session
response, which of these needs are not being met by with a presentation on what led to the creation of the
existing tools (e.g., datasets, maps, applications, etc.) term “flash drought”: a severe drought that formed
and services, and, inversely, which existing tools and within 8–12 weeks in the late-summer of 2000 in the
services intended for flash drought are not in fact serv- Southern Plains. The term was intended as a commu-
ing their needs. nication tool that would resonate with people and
reinforce the point that droughts sometimes develop
Day 3: Outstanding research needs and next steps quickly.
The third day included two sessions focused on the final
two objectives, respectively: Objective 3: Develop a list Pam Knox, Agricultural Climatologist at the University
of outstanding research needs in monitoring, predic- of Georgia Cooperative Extension, described the 2016
tion, and planning/response to improve early warning, and 2019 flash droughts in Georgia. As Pam stated,
and Objective 4: Agree upon next steps for this emerging Georgia is not a stranger to drought, but these two
domain and how NIDIS and other partners can support “exploding” flash droughts were particularly impact-
research and coordination related to flash drought. ful. Both droughts developed rapidly, although 2016
was characterized more by lack of rainfall rather than
• Session 4: Identify Research Needs in high temperatures, while 2019 was characterized more
Monitoring, Prediction, and Planning/ by high temperatures rather than low precipitation
Response: The session began with presentations (although low precipitation was still a major contribu-
from experts in each topic area (monitoring, tor). Both caused widespread impacts, including crop
prediction, and planning/response) and
then transitioned to a breakout session to
15 Osterwalder, A., Y. Pigneur, G. Bernarda, A. Smith (2014) Value Proposition Design: How to Create Products and Services
Customers Want, John Wiley and Sons; ISBN: 978-1-118-96805-5; also see www.strategyzer.com.
NIDIS FLASH DROUGHT VIRTUAL WORKSHOP 14yield reductions, forage completely lost, wildfires (2016),2.2.2 Session 2: Exploring Flash
streamflow reductions, etc. Drought Characteristics
This segment began with two complementary presen-
Pat Guinan, Missouri State Climatologist at the Univer- tations on different groups’ perceptions of flash
sity of Missouri, recounted that the 2012 flash drought drought. First, Tonya Haigh of NDMC presented results
in Missouri amazed him by how quickly things went of a survey exploring how the term “flash drought” is
downhill, from no drought to currently perceived by both
becoming an historic event. A researchers and end users/
key issue was the timing: the
Survey results showed that
practitioners. Results showed
flash drought started early in over half of end users found that over half of end users
the growing season just when the term “flash drought” found the term either “some-
vegetation was most vulnera- either “somewhat” or “very” what” or “very” confusing.
ble due to shallow roots. The While most end users under-
impacts extended far beyond
confusing. stood that the speed of onset
agriculture. Pat pointed to the or intensification was a char-
importance of communication in this situation, includ- acteristic of flash drought, other characteristics that
ing the need to get the phrase “flash drought” out to end users emphasized did not necessarily align with
the public. those emphasized by flash drought researchers. As one
example, end users focused more on impacts and less
Michael Downey, Water Planning Section Supervisor on drivers (such as low precipitation) than did research-
for the Montana Department of Natural Resources and ers. Also, end users were more likely to assume “flash
Conservation described the surprise nature of the 2017 drought” was defined as a short-term (that is, short-last-
Northern Plains Drought. Antecedent conditions in the ing) phenomenon. Finally, some end users did not
fall of 2016 included high precipitation, below-normal perceive a significant difference between flash drought
temperatures, ample soil moisture, and a generally deep and other drought events, indicating some difference of
snowpack. Going into the spring, the main concern was opinion on the usefulness of the term. All of this points
actually the potential for flooding. However, despite to a potential disconnect between how flash drought
the precipitation through winter, the “spigot shut off” is understood within the research community and how
in May, which was accompanied by high temperature it is understood by those who use drought information
anomalies. By late May, there were early signs of moder- for policy and decision making.
ate drought (D1) in northeastern Montana, but within
four weeks this morphed into extreme drought (D3). On the research side, Joel Lisonbee of NIDIS presented
By the end of July, 80% of the state was in some level a review of the current use of the term “flash drought” in
of drought. Interestingly, though May–July precipita- the literature. The earliest reference to the term was in
tion was the lowest since 1895, the water year (Octo- 2002.16,17 The number of publications increased signifi-
ber 2016–September 2017) ended with near-normal cantly in response to the 2012 Central U.S. drought,
precipitation. As a response to the drought, Montana and is continuing to rise each year. As of July 2020,
modified its drought-monitoring process by diversifying there have been over 50 publications wholly devoted
the groups involved in monitoring activities, increasing to the topic and at least 142 others that mention the
drought consultations to a weekly basis (from monthly), term “flash drought” in relation to other topics. Within
developing a regional drought-indicators dashboard, these publications, unique defining criteria have been
and formalizing the Montana Drought Impact Reporter. applied to flash drought at least 20 times. Currently, the
literature has not coalesced around a specific definition
for flash drought; however, as detailed by Lisonbee et
16 Svoboda, M., D. LeComte, M. Hayes, R. Heim, K. Gleason, J. Angel, B. Rippey, R. Tinker, M. Palecki, D. Stooksbury, D. Miskus, and
S. Stephens, 2002: The Drought Monitor. Bull. Amer. Meteor. Soc., 83, 1181–1190, https://doi.org/10.1175/1520-0477-83.8.1181.
17 Peters, A. J., E. Walter-Shea, A. Vina, M. Hayes, and M. D. Svoboda, 2002: Drought monitoring with NDVI-based Standardized
Vegetation Index. Photogramm. Eng. Remote Sens., 68, 71–75.
NIDIS FLASH DROUGHT VIRTUAL WORKSHOP 15Evaporation/evapotranspiration
Soil moisture
Drought indicator used
Precipitation
Temperature
U.S. Drought Monitor
NDVI
0 2 4 6 8 10 12
How often indicator is used to define flash drought in literature (through August 2020)
▲ Figure 2.1: Indicators used to define flash drought in the peer-reviewed literature. (“Evaporation/ Evapotranspiration” refers to both actual
and potential values; “US Drought Monitor” is a weekly graphical depiction of U.S. drought conditions prepared by NDMC, USDA, and NOAA;
“NDVI” stands for Normalized Difference Vegetation Index, a satellite measure of vegetation greenness.) Adapted from Lisonbee et al. 2021.
al. (2021),18 researchers generally focus on either: 1) the • What indicators does each group believe are
rapid onset or intensification of drought conditions; or most important for characterizing flash drought?
2) short-duration, intense drought events. Lisonbee
Through the breakout sessions as well as subsequent
et al. (2021) also detailed the key indicators of flash
plenary discussions on Day 1 and Day 3, workshop
drought identified in the literature and how often they
attendees came together on a series of key takeaways
were referenced, as shown in Figure 2.1.
related to the concept of flash drought and how to char-
acterize and define it, as detailed in Chapter 3. However,
Following the two presentations, a breakout session
notwithstanding progress in clarifying the concept of
allowed for small-group exploration of flash drought
flash drought, it was agreed that work remains to ensure
effects, characteristics, and indicators. Each group was
that the term “flash drought” is clearly described and
configured to include a mix of researchers, individuals
communicated.
in organizations that provide information to support
practitioners (described as “boundary organizations”
2.2.3 Session 3: Shaping Tools/
in this report), and end users/practitioners. The groups
Research to Meet User Needs
were then tasked to answer the following questions:
The second day of the workshop focused on practi-
tioners’ needs and exploring which existing or potential
• What are the effects of flash drought?
tools and research activities could meet those needs
How is it distinct from conventional,
now and in the future. In addition to this session,
or slowly developing, drought?
the topic of practitioners' needs came up frequently
• What does each group believe are the throughout the three-day workshop.
key characteristics of flash drought?
18 Supra 14: Lisonbee et al., 2021.
NIDIS FLASH DROUGHT VIRTUAL WORKSHOP 16The technique used to explore user needs was the Value the Director of the NDMC, presented on the challenges
19
Proposition Canvas (VPC). The VPC is a structured and opportunities, as well as gaps and needs, related
process to identify which products (including research to flash drought monitoring. Their presentation accen-
projects) best align with the user's needs and which tuated the importance of using a suite of indicators
user's needs are currently unmet. Users' needs (in and tools to properly monitor the evolution of flash
this case, flash drought practitioners’ needs for early drought from its inception to the end of the rapid inten-
warning and response) are sification period and beyond.
organized into jobs (the activ- In addition, they emphasized
It is still not well understood
ities, tasks, or actions they the importance for the flash
perform before and during a how predictable flash drought research community
flash drought), pains (what drought is, and whether there to agree on a general frame-
makes those jobs difficult) and are clear climate signals, or if work for flash drought since
gains (what makes those jobs this strongly impacts how
easier). Relevant existing tools
flash droughts are due to the we monitor and forecast this
(datasets, maps, applications, chaotic fluctuations of the phenomenon.
etc.) or research activities are atmosphere.
then evaluated for the degree Next, Andrew Hoell from NOAA
to which they are gain-creators and pain-relievers, i.e., Physical Sciences Laboratory and Hailan Wang from
tools/research that create value or are impactful. For the NOAA Climate Prediction Center presented on the
this exercise, we also included an additional third step challenges, opportunities, gaps, and needs related to
to record ideas for future tools or research topics. flash drought prediction. It is still not well understood
how predictable flash drought is, and whether there are
Attendees were divided into eight sector groups and clear climate signals, or if flash droughts are due to the
asked to take on the role of a practitioner in that sector chaotic fluctuations of the atmosphere. This presenta-
if they were not one, and to identify assumed user needs tion highlighted the inadequacy of current operational
and the current tools intended to meet those needs. forecasts and other forecast tools in providing skillful
The sector groups were as follows: energy and indus- and detailed forecasts for flash drought development.
try, water resources, forestry and ecology, fire manage- They noted the need for exploratory research to identify
ment, disaster preparedness and response, recreation new sources of predictability for flash drought, and for
and tourism, livestock production, and farming and evaluation as to how well these new sources of predict-
cropping. The discussions and resulting VPCs by sector ability are represented in current and future forecast
were shared in the plenary session, and then were used models.
to help focus subsequent discussions about priority
research topics and tool development on the follow- Finally, the challenges, opportunities, gaps, and
ing day. needs for flash drought planning and response were
presented by Tim Hall, who serves as the Hydrol-
2.2.4 Session 4: Identify Research Needs in ogy Resources Coordinator for the Iowa Department
Monitoring, Prediction, and Planning/Response of Natural Resources (DNR). Mr. Hall described how
The third day of the workshop began with keynote the 2012 drought in the central United States helped
presenters providing an initial overview of the chal- state partners expand their understanding of the vari-
lenges, opportunities, gaps and needs for three aspects ous roles and responsibilities each one plays during a
of drought early warning: monitoring, prediction, and drought. The 2012 drought also helped increase coor-
planning/response. dination among Iowa’s state agencies and led to the
development of the Iowa Water Summary Update,20
First, Jason Otkin, a flash drought researcher from the which continues to be produced by multiple state agen-
University of Wisconsin-Madison, and Mark Svoboda, cies and provides an easy-to-understand overview of
19 Supra 15: Osterwalder et al., 2014.
20 https://www.iowadnr.gov/Environmental-Protection/Water-Quality/Water-Summary-Update
NIDIS FLASH DROUGHT VIRTUAL WORKSHOP 17Soil moisture sensor
testbed, Nevada
Agricultural Experiment
Station in Reno, NV.
Credit: Todd Caldwell
state water conditions. The role of the Iowa DNR during • What are the gaps and needs in
drought is to assess the technical data and communi- research in this topic area?
cate the data and their potential implications to a fairly
• Given the user needs you’ve heard during the
broad audience. Given this role, the Iowa DNR would
workshop, what existing and new tools do
find additional communication tools extremely useful,
you think would create the most value?
especially tools such as a metric/index that would effec-
tively communicate the rapid intensification aspect of • What current activities could be leveraged to
flash drought, and those that have proven successful. help meet either the research or tool needs?
Ideas generated during the breakouts were used as
Following the three scene-setting presentations, the the basis for the discussion on next steps in the final
workshop started its final round of breakout groups session. These ideas and other key takeaways are
to further discuss the gaps and needs for monitor- detailed in Chapter 3.
ing, prediction, and planning and response. One of
the goals of these breakout groups was to develop a 2.2.5 Session 5: The Path Forward
list of outstanding research and tool needs for each The fourth and final objective of the workshop was to
of the topics. In addition, the breakout groups were agree upon next steps for this emerging domain and
designed to identify opportunities to leverage existing how NIDIS and other partners can support research and
resources or activities to help meet these needs. Each coordination related to flash drought. The last session
group was tasked to answer the following questions of the workshop focused on this objective by captur-
for their specific topic (i.e., monitoring, prediction, or ing ideas for future work (research, activities, etc.) and
planning/response): prioritizing them according to their relative importance
to the researcher and practitioner and to the relative
ease in accomplishing these projects.
NIDIS FLASH DROUGHT VIRTUAL WORKSHOP 18Identify triggers that give managers adequate
1st
lead time to address a flash drought
2nd Provide prediction/projections by sector
Participant-ranked planning/response activities by order of importance
Research: is response different during a flash
3rd
drought versus a conventional drought?
Identify/develop tools for both statewide
4th
and more local or sector-based responses
Quantitative storyline of flash drought and its
5th
impacts
Research: best practices on communicating flash
6th
drought implications to broad audiences
Policy: are the impacts of flash drought adequately
7th
covered by current drought relief (e.g., USDA, FEMA)?
Resource guide for flash drought communications/
8th
educational challenge
◀ Figure 2.2: The results
Research: do better soil management practices
9th of one of the Mentimeter
mitigate flash drought impacts? polls used to identify the
activities the partici-
Expand resources like “Managing Drought Risk on the pants felt were import-
10th ant in the planning/
Ranch” to include flash drought
response topic area.
This figure is included
Develop tools that can address cognitive bias
11th to illustrate the result of
(e.g., recent wet times) the Mentimeter process.
Research: interplay between flash drought and other
12th
hazards (e.g., chemical spills)
Ideas for potential projects for each topic area (monitor- The final activity was a virtual “whiteboard” exercise
ing, prediction, and planning/response) were gleaned using the sharable, on-line tool JamBoard.22 The top
from the presentations and breakout groups through- six project ideas for each topic area (selected from the
out the workshop, particularly from Session 4 described top Mentimeter poll results) were sorted according
above. The 12 most salient ideas for each topic area to their relative difficulty, importance, and sequenc-
were then prioritized by workshop attendees using a ing dependencies (i.e., which activities need to come
real-time Mentimeter poll.21 Each workshop partici- first). The workshop participants were invited to share
pant was asked to rank the project ideas in order of their thoughts about which activities would be easier
importance in relation to their work or responsibilities to accomplish , which were more important, and finally
(see Figure 2.2 for an example of the ranked ideas). The which needed to come first based on its dependencies.
entire list of research and application/tool project ideas The final sorting of activities is shown in Figure 2.3, and
identified during this session is shown in Appendix A. details on specific outcomes are provided in Chapters
3 and 4.
21 https://www.mentimeter.com/
22 https://workspace.google.com/products/jamboard/
NIDIS FLASH DROUGHT VIRTUAL WORKSHOP 19▲ Figure 2.3: The results of a “whiteboard” exercise to rank project ideas by difficulty and importance. Note that the importance and difficulty are
assessed relative to the other items on the board, and do not imply that items in the bottom left quadrant are inherently unimportant or easy. Results
from this exercise are captured in Section 3.4: Research and Applications Needs for Flash Drought Monitoring, Prediction, and Planning/Response.
NIDIS FLASH DROUGHT VIRTUAL WORKSHOP
20KEY TAKEAWAYS
Young corn
plants show
signs of drought
stress. Credit:
Kent Weakley
3
KEY TAKEAWAYS
The Flash Drought Workshop provided one
of the first opportunities for a structured
discussion about the concept and
implications of flash drought, both among
flash drought researchers and between the
research community and practitioners who
manage and respond to flash droughts. This
chapter provides the key takeaways from
the discussion and forms the basis for the
priority actions enumerated in Chapter 4.
3.1 CHARACTERIZING FLASH DROUGHT
There was broad agreement among workshop partici-
pants that a clear conceptualization of flash drought is
important and necessary, both to help guide research
efforts and to support the development of early warning
indicators and management actions to assist decision
makers. Identifying the basic principles or characteris-
tics of flash drought requires continued collaboration
between the research community and practitioners.
This will ensure that research is best oriented towards
addressing real-world impacts and needs.
On the characteristics of flash drought, there was
general consensus that the key feature of flash drought
is the rapid onset or rapid intensification of drought
conditions, regardless of whether the resultant condi-
tions are short-lived (e.g., a few weeks) or persistent.
Practitioners described flash droughts as a sudden
and unexpected appearance of drought impacts that
seem to “come out of nowhere” and catch communi-
ties off guard, in sharp contrast to more conventional
droughts, which are typically understood as slowly
evolving events. As one participant stated, “All of a
sudden lawns and crops seem to change almost over-
night, the vegetative environment is shocked.” A similar
comment came from a survey participant: “The drought
event completely reversed previously wet conditions
FLASH DROUGHT NIDIS 21in an unusually short amount drought?). It was noted that
of time, so fast that it became Suburban lawn during the concept of flash drought
difficult to accept that wet drought. Credit: should not include events
Suzanne Tucker
conditions were completely characterized by minor fluc-
erased and not persisting as is tuations in conditions with-
often the case.” out discernible impacts;
participants were sensitive
From a research perspec- to not wanting to be "the boy
tive, this reflects a high rate that cried wolf."
of change in conditions rela-
tive to climatologically normal The workshop participants
rates of change for a particu- identified seasonality, region-
lar location: “Whatever climate ality, and impacts as three
you’re in, you’re accustomed fundamental and inter-re-
to conditions changing at lated attributes of flash
some rate. When they start drought characterization. In
changing faster than that, particular, season and region
that’s the ‘flash’ part.” And for both are driving factors in the
practitioners, the key impli- types of impacts, or whether
cation is that any such rapid there are impacts at all. Effects
change in conditions and vary by season based on the
impacts requires an equally phenological state or sensi-
rapid management response, tivity of plants; the seasonal
which in many cases they are timing of an event will imply
not prepared for due to inade-
The key feature of flash different impacts on agricul-
quate drought monitoring and drought is rapid onset or ture and the environment.
forecasting. intensification: “All of a Effects also vary by region,
sudden lawns and crops seem given the different climates
The fundamental physical found across different parts
dynamic of flash drought to change almost overnight, of the country. In eastern and
was described as the rapid the vegetative environment central regions, flash drought
depletion of available water is shocked.” is typically a warm-season
in the landscape; that is, phenomenon that expresses
some combination of factors (e.g., high temperature, first as vegetative stress (particularly in areas without
below-normal precipitation, high winds, etc.) that irrigation); while in the arid west, changes in evaporative
causes atmospheric evaporative demand to deplete stress might be less important because normal evapo-
landscape reservoirs of water such as soil moisture and rative demand is always quite high, and flash drought
fuel moisture (i.e., moisture in trees, downed wood, might express through increased fire risk in forests and
or grasses), leading to vegetative stress, fire risks, and grasslands.
other impacts.
As for impacts, there was general agreement that a
There was recognition of the need for some standard- climatological phenomenon without physical impacts
ization on the terms “rapid” and “intensity.” How “rapid” (e.g., wilting plants, fire danger) would not be consid-
a change would qualify as a flash drought? Most attend- ered flash drought for the purposes of supporting
ees considered that the general timeframe would be real-world applications. As one participant stated,
a change occurring on the order of weeks. In addi- “In Montana we might have the ‘indicators’ of a flash
tion, how “intense” a change would qualify (e.g., how drought in winter (e.g., a rapid warm-up), but does it
many category changes of the U.S. Drought Monitor or really count as that since there are no impacts?” As for
other metrics used for thresholds would imply a flash types of impacts, as mentioned previously, vegetative
NIDIS FLASH DROUGHT VIRTUAL WORKSHOP 22stress is often the first expression; while water storage
(e.g., in reservoirs) is usually a lagging indicator. It is
important to look not just at water quantity but also
water quality, as rapid changes in water quality might
be linked to flash droughts, triggering adverse health
effects, negative implications for energy production,
industry, and wildlife. It was also noted that ecological
effects should be considered alongside human-based
impacts. For example, it is possible to have ecological
impacts from small streams drying up, even as reser-
voirs and drinking water supplies are unaffected. It is
important to take a broad approach when consider-
ing impacts, including incorporating perspectives from
across different sectors.
As to the question of whether a short duration should
be considered a key characteristic of flash drought,23 Participants identified some addi- ▲ Vegetative
participants compared the terminology of flash drought tional topics that require more stress is often the
first indication
to other “flash” events, such as flash flood or flash fire. research and deliberation. First, of flash drought,
These “flash” events are unexpected, sudden, and there was discussion about the whereas reservoir
generally understood to be of short duration. However, difference between rapid onset
levels are a
lagging indicator.
it was pointed out that while a flash flood or flash fire and rapid intensification and Flathead River
might end quickly, the impacts from each can linger, as whether the term “flash drought” above Kerr Dam,
can the impacts of flash droughts. There was a general Montana. Credit:
should be used for both, i.e., both Girl Grace.
consensus that defining flash drought by duration was for a rapidly developing event that
not necessarily useful for several reasons. First, from the initiates from non-drought condi-
perspective of early warning, criteria for monitoring and tions, and for one that occurs within the context of a
forecasting need to be independent of duration, since longer-term, slower-evolving drought. While overall
the objective would be to support action before signif- there was a sense that both can have the same “unex-
icant impacts have been felt. Researchers could look pected” impacts—and therefore can be considered
back on a flash drought’s duration retrospectively for flash drought—some potential differences were noted.
historical studies, but it could not be used as a defining For example, in a rapid-onset flash drought, a reversal
characteristic to trigger communication in real time. to more normal climatic conditions through receiving
Furthermore, as one practitioner stated, “Once you are ample precipitation could potentially eliminate impacts
in drought, you are in drought—the duration might be before they become critical. Whereas in the context of a
two months or a year—but the need to take action won’t long-term drought, a return of precipitation for a period
change.” From this vantage point, a rapid change of of time may not be enough to offset impacts. In addi-
state is a far more important characteristic than dura- tion, from a response perspective, going rapidly from
tion.24 However, participants agreed that there might no drought to drought may be more of a surprise, and
need to be some minimum duration to be considered make it harder to initiate actions; whereas if an area is
a flash drought, to avoid the use of the term for variable already in drought, some response measures are likely
weather patterns without impacts significant enough already in place, making additional responses easier
to merit action. to implement.
23 Lisonbee et al. (2021)12 categorized flash drought definitions by “short duration” or “rapid onset/intensification” but found that
most of the flash drought research publications generally considered to be in the "short duration" category were not specifically
about duration, but instead focused on the presence of high-threshold heat waves, which by their nature are short-lived events.
24 It should be noted that this discussion does not necessarily imply that the duration of a flash drought isn’t important, but simply
that duration may not be a useful defining characteristic of flash drought.
NIDIS FLASH DROUGHT VIRTUAL WORKSHOP 23You can also read