Climate change implications for New Zealand - April 2016
←
→
Page content transcription
If your browser does not render page correctly, please read the page content below

Climate change
implications for
New Zealand
April 2016
                          Market
                          access

                   FOR
                   SALE

         OL
  SCHO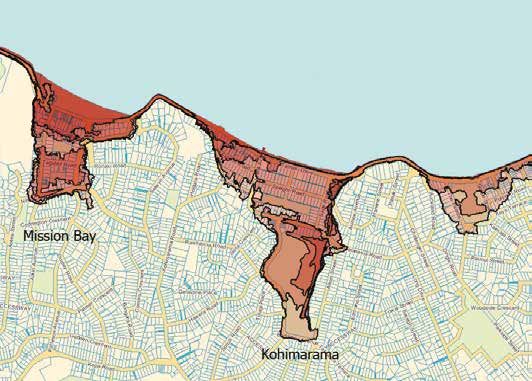
1

Contents
Introduction.............................................................................................................................................................. 4
    New Zealand’s sensitivities to climate change........................................................................................................5
    Implications for New Zealand..................................................................................................................................6
    Three considerations to understand the risk from climate change: hazard, exposure, vulnerability....................7

Key aspects of global climate change..................................................................................................................... 10
   What might the future hold? ................................................................................................................................13

Key aspects of climate change for New Zealand.................................................................................................... 18
   What is already happening?..................................................................................................................................19
   What might the future hold? ................................................................................................................................20
   Regional variability and extreme events................................................................................................................22
   Learn more.............................................................................................................................................................22

Key risks for New Zealand...................................................................................................................................... 24

Coastal change: New Zealanders live mainly near coasts....................................................................................... 26
   What climate trends will affect New Zealand’s coasts?........................................................................................27
   What is already happening?..................................................................................................................................28
   What might the future hold? ................................................................................................................................28
   What are the implications?....................................................................................................................................29
   Key knowledge gaps...............................................................................................................................................31
   Learn more.............................................................................................................................................................31

Flooding: many New Zealanders live on floodplains.............................................................................................. 32
   What climate trends will affect surface flooding events?.....................................................................................32
   What is already happening?..................................................................................................................................33
   What might the future hold? ................................................................................................................................33
   What are the implications? ...................................................................................................................................34
   Key knowledge gaps...............................................................................................................................................35
   Learn more.............................................................................................................................................................35

Freshwater resources: New Zealanders rely on the availability of freshwater....................................................... 36
   What climate trends will affect the availability of freshwater resources?............................................................37
   What is already happening?..................................................................................................................................38
   What might the future hold? ................................................................................................................................38
   What are the implications?....................................................................................................................................40
   Key knowledge gaps...............................................................................................................................................43
   Learn more.............................................................................................................................................................43

The ocean: New Zealand is surrounded by sea...................................................................................................... 44
   What climate trends will affect the oceans around New Zealand?......................................................................45
   What is already happening?..................................................................................................................................45
   What might the future hold? ................................................................................................................................48
   What are the implications?....................................................................................................................................48
   Key knowledge gaps...............................................................................................................................................51
   Learn more.............................................................................................................................................................51
2      Climate change implications for New Zealand | 2016

Ecosystem change: New Zealand has unique ecosystems...................................................................................... 52
   What climate trends will affect New Zealand’s ecosystems?................................................................................53
   What is already happening?..................................................................................................................................55
   What might the future hold? ................................................................................................................................56
   What are the implications?....................................................................................................................................57
   Key knowledge gaps...............................................................................................................................................57
   Learn more.............................................................................................................................................................57

International impacts: New Zealand is affected by impacts and responses
to climate change occurring overseas.................................................................................................................... 58
    What climate trends will have international impacts for New Zealand?..............................................................59
    What is already happening?..................................................................................................................................60
    What might the future hold? ................................................................................................................................60
    What are the implications?....................................................................................................................................63
    Key knowledge gaps...............................................................................................................................................65
    Learn more.............................................................................................................................................................65

Conclusion ............................................................................................................................................................. 66
   Further information...............................................................................................................................................68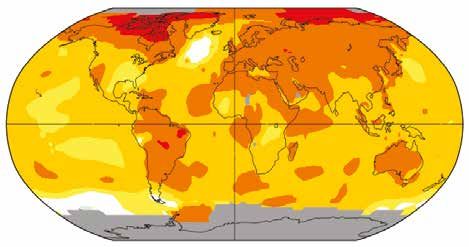
3

4   Climate change implications for New Zealand | 2016

Introduction

New Zealand is being affected by climate
change and impacts are set to increase in
magnitude and extent over time. This report
from the Royal Society of New Zealand
summarises the most recent findings about
climate risks, uncertainties, impacts and
implications for New Zealand.

To understand New Zealand’s sensitivities to climate change, it is important
to identify the key aspects of society, geography and ecology which expose us
to climate-related risks. Concepts of risk and vulnerability to climate change
also require careful consideration to enable New Zealanders to be climate-
ready, and resilient. The remainder of the report presents six key risks that
New Zealand faces from climate change: these are risks to our coastal
margins; flooding from rivers; availability of and competition for freshwater;
changes to our surrounding oceans; threats to unique ecosystems; and flow-
on effects from climate change impacts and responses elsewhere, which will
affect New Zealand through our strong international connectivity.
Introduction     5

New Zealand’s sensitivities to climate change

New Zealanders live on coasts                                   New Zealanders rely on the availability
and floodplains                                                 of freshwater
Most of New Zealand’s main population centres are on            New Zealand’s economy is tied to climate sensitive
the coast or on the floodplains of major rivers. The aging      primary industries strongly linked to freshwater
population in these areas is likely to increase significantly   availability: agriculture, forestry, and tourism.
over the next few decades1. For Māori especially, there         The total Māori asset base is even more heavily
are numerous cultural heritage and food gathering               invested in these sectors, making it potentially
sites in coastal areas which are deeply connected with          more sensitive to climate-induced changes in
identity and well-being. Our major urban centres rely           water availability2. Many rural communities are
upon water supply and storm-water systems designed              also dependent on non-reticulated water resource
for today’s climate conditions making them sensitive to         systems, such as rain water tanks for their fresh
changing climate extremes. Economic activity relies upon        water supplies.
interconnected systems such as transport networks,
energy utilities, and water supplies which all rely upon        New Zealand is surrounded by ocean
service provision uninterrupted by climate extremes
and rising sea and groundwater levels.                          New Zealand’s weather and climate are strongly
                                                                driven by the oceans around it, and the ocean is an
                                                                important source of economic, social and cultural
                                                                well-being.

                                                                2   King D.N., Penny G. & Severne C. (2010). The climate change
                                                                    matrix facing Māori society. In: Climate change adaptation in
                                                                    New Zealand: Future scenarios and some sectoral perspectives.
1   Royal Society of New Zealand (2014). Our Futures: Te Pae        Nottage R.A.C., Wratt D.S., Bornman J.F. & Jones K. (Eds).
    Tawhiti. http://www.royalsociety.org.nz/our-futures/.           New Zealand Climate Change Centre. pp.100–111.
Implications for New Zealand
SURROUNDED BY OCEAN                                              RELYING ON STRONG INTERNATIONAL CONNECTIVITY

                                                                                              Tourist                       Increased
                                                                                            preferences                   displacement
                                                                                                                          and migration

                                                                               Export
                                                                              demand                                       Consumer
        Changes                                                                                                           perceptions
        in water                                 Changes
       chemistry                                 in ocean
                                               temperature
                                                & currents                                                       Market
                                                                                                                 access

RELYING ON THE AVAILABILITY OF FRESHWATER                        LIVING ON COASTS
                                                                                                                                Sea
                                                                                                                               level
                                                                                                                                rise

                                                                                                           Erosion

                                                                                        FOR
                                                                                        SALE

                                                                           Relocation
                               Increased
                                demand

                                                   Increased
                                                   frequency
                                                 and intensity       Salinisation of
                                                  of droughts        ground water
                                                                                                      Inundation
                                                                                                      of low-lying
                                                                                                          areas

LIVING ON FLOODPLAINS                                            WITH UNIQUE ECOSYSTEMS

                                                                                                                       Land
                                                                                                                        use
                          OL                                                                                          change
                   SCHO                       Extreme
                                               heavy
                                               rainfall

                                                                              Fire
                                                                             danger

                                                                                                      Increasing
                                                                                                     abundance
                                                                                                    and spread of
                                                                                                     pest species

                                 Decreased
                                drainage in                                        Lake
                                flood-prone                                        warming
                                   areas
Introduction          7

New Zealand has unique ecosystems
                                                                       Three considerations
New Zealand has many unique indigenous ecosystems,
and land and aquatic managed ecosystems that are                       to understand the risk
critical to the country’s economic, social and cultural
well-being. Native ecosystems are already under                        from climate change:
pressure from a range of pests and pathogens,
and changes in land use and water quality. Māori                       hazard, exposure,
economic, social and cultural systems are also
strongly tied to these ecosystems.                                     vulnerability
New Zealand relies on strong                                           Risks associated with climate change result from
international connectivity                                             a combination of three factors: changes in the
                                                                       frequency and severity of climate-related hazards;
New Zealand is an open economy with important                          the consequences in terms of exposure of people,
trading links in Europe, Australia, the US and more                    infrastructure and ecosystems to those hazards;
recently China. New Zealand also has a diverse                         and their vulnerability to those hazards (i.e. ‘the
population with high levels of migration. A quarter                    propensity or predisposition to be adversely
of New Zealand’s residents were born overseas.                         affected’) which includes concepts of sensitivity
Our international connectivity makes us vulnerable                     and susceptibility to harm as well as the lack of
to climate change impacts in other countries,                          capacity to cope and adapt4. Age, education, income
through effects on trade and on international travel                   levels, housing type, and social-cultural networks
and tourism. Climate change-related impacts on                         all contribute to vulnerability; and have been
trading‑partner economies have the potential to                        widely shown to influence how different groups can
affect our ability to sell our goods overseas.                         respond to climate stresses and risks5. Consequently,
How the changing risks associated with climate                         recognising that hazards, exposure and vulnerability
change play out socially, culturally, and economically                 determine the actual risk from climate change, allows
and how they interact with demographic and                             more effective ways of managing those risks, than
other changes in future is complex. New Zealand’s                      focusing only on changes in the physical climate.
decision making approaches, rights and obligations                     In other words, risk is the product of hazard, exposure
for addressing climate-related risks are specific to                   and vulnerability, as illustrated in Figure 1. Hazards are
our country, and must balance an array of devolved                     the domain of climate science, while exposure and
responsibilities that cross national, regional and local               vulnerability are socio-economic factors determined
government arrangements3.                                              by human values and preferences.

                                                                       4   IPCC (2014). Climate Change 2014: Impacts, Adaptation,
                                                                           and Vulnerability. Part B: Regional Aspects. Contribution
                                                                           of Working Group II to the Fifth Assessment Report of the
                                                                           Intergovernmental Panel on Climate Change [Barros V.R.,
3   Reisinger A., Wratt D., Allan S., and Larsen H. (2011). The role       Field C.B., Dokken D.J., Mastrandrea M.D., Mach K.J., Bilir T.E.,
    of local government in adapting to climate change: lessons             Chatterjee M., Ebi K.L., Estrada Y.O., Genova R.C., Girma B.,
    from New Zealand. In: Climate Change Adaptation in Developed           Kissel E.S., Levy A.N., MacCracken S., Mastrandrea P.R., and
    Nations: From Theory to Practice [Ford J.D. and Berrang-Ford L.        White L.L. (eds.)]. Cambridge University Press, Cambridge,
    (eds.)]. Advances in Global Change Research Vol. 42, Springer          United Kingdom and New York, NY, USA, 688 pp.
    Science, Dordrecht, Netherlands, pp. 303-319; Lawrence J.,         5   King, D.N., Dalton, W., Bind, J., Srinivasan, M.S., Duncan, M.,
    Sullivan F., Lash A., Ide G., Cameron C., and McGlinchey L.            Skipper, A., Ashford-Hosking, D., Williams, B., Renata, H., and
    (2013). Adapting to changing climate risk by local government          Baker, M. (2012). Coastal Adaptation to Climate Variability and
    in New Zealand: institutional practice barriers and enablers.          Change: Examining Māori community risk, vulnerability and
    Local Environment: The International Journal of Justice and            endurance at Manaia Settlement, Hauraki-Waikato, Aotearoa-
    Sustainability, doi:10.1080/13549839.2013.839643.                      New Zealand. NIWA Client Report: AKL2012-029. 142 pp.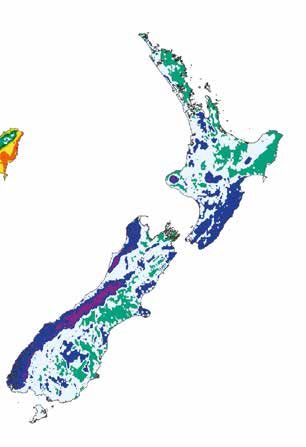
8    Climate change implications for New Zealand | 2016

While the types of climate change impacts and the                           Choosing not to make lifestyle changes until the risk
most exposed locations are generally known6, the                            of a heart attack is known precisely would not be
magnitude, frequency and timing of the impacts                              considered a wise approach by most people, and is
cannot be, although we generally know the direction                         not encouraged by the health sector. In the same
of the change. For example, we know that sea level                          way, being aware of the changing risks from climate
will continue to rise for centuries and that heavy                          change enables governments, regions, businesses and
rainfall will become more frequent7, but that the                           individuals to take decisions now to manage them,
amount of change is still uncertain. In a nutshell, the                     even though the exact amount of climate change will
challenge for decision makers is that they confront,                        remain uncertain. Taking action on the basis of climate
simultaneously, both the certainty that climate change                      change risk helps ensure that New Zealand’s society
is inevitable and uncertainties about the extent of                         and environment can be resilient by responding
climate change.                                                             flexibly to changing climatic as well as social,
                                                                            economic and environmental conditions.
Experience shows that uncertainties around climate
changes can result in decision-making being                                 When we think about acting on risk, we need to
postponed until changes are clearer. This ‘wait and                         keep in mind that the likelihood of damaging events
see’ approach is in itself risky, since the direction                       and the consequences of their occurrence are both
and rough magnitude of climate changes, and the                             important, as risk is often described as the product
associated increases in key risks, are well understood.                     of likelihood and consequence. Even though some
Experience from non-climate issues shows that people                        outcomes are not very likely, they may warrant
often respond to issues of increased risk, such as                          proactive management because of the consequences.
discovering they have an elevated chance of a heart                         Having your house burn down is not likely, but the
attack, without knowing the precise probability of it                       consequences would be devastating. So, we are
occurring or the exact impact it might have on them.                        proactive and fit smoke alarms and take out house
                                                                            insurance, just in case. Climate change itself mainly
                                                                            alters the likelihood of damaging climate-related
                                                                            outcomes, but human responses to climate change
                                                                            play a large role in determining our exposure and
                                                                            vulnerability to such outcomes. Where outcomes
                                                                            from climate change have potentially devastating
                                                                            consequences, they warrant our proactive attention
                                                                            even if their occurrence is not considered likely.
                                                                            We must also recognise that the choice of taking
                                                                            action or not taking action comes with different risks.
6   IPCC (2013). Climate Change 2013: The Physical Science Basis.
    Contribution of Working Group I to the Fifth Assessment                 The challenge is to ensure that any decisions with
    Report of the Intergovernmental Panel on Climate Change                 long-lasting consequences are well informed by the
    [Stocker, T.F., D. Qin, G.-K. Plattner, M. Tignor, S.K. Allen, J.       range of pressures they could experience over their
    Boschung, A. Nauels, Y. Xia, V. Bex and P.M. Midgley (eds.)].           lifetime, and to plan ahead to ensure flexibility in
    Cambridge University Press, Cambridge, United Kingdom
    and New York, NY, USA, 1535 pp; IPCC, 2014: Climate Change              response to changing conditions.
    2014: Impacts, Adaptation, and Vulnerability. Part A: Global
    and Sectoral Aspects. Contribution of Working Group II to the
    Fifth Assessment Report of the Intergovernmental Panel on
    Climate Change. [Field C.B., Barros V.R., Dokken D.J., Mach K.J.,
    Mastrandrea M.D., Bilir T.E., Chatterjee M., Ebi K.L., Estrada
    Y.O., Genova R.C., Girma B., Kissel E.S., Levy A.N., MacCracken
    S., Mastrandrea P.R., and White L.L. (eds.)]. Cambridge
    University Press, Cambridge, United Kingdom and New York, NY,
    USA, 1132pp.
7   IPCC (2012). Managing the Risks of Extreme Events and
    Disasters to Advance Climate Change Adaptation. A Special
    Report of Working Groups I and II of the Intergovernmental
    Panel on Climate Change [Field, C.B., V. Barros, T.F. Stocker,
    D. Qin, D.J. Dokken, K.L. Ebi, M.D. Mastrandrea, K.J. Mach,
    G.-K. Plattner, S.K. Allen, M. Tignor, and P.M. Midgley (eds.)].
    Cambridge University Press, Cambridge, UK, and New York, NY,
    USA, 582 pp; IPCC, 2013: Climate Change 2013: The Physical
    Science Basis. Contribution of Working Group I to the Fifth
    Assessment Report of the Intergovernmental Panel on Climate
    Change [Stocker, T.F., D. Qin, G.-K. Plattner, M. Tignor, S.K. Allen,
    J. Boschung, A. Nauels, Y. Xia, V. Bex and P.M. Midgley (eds.)].
    Cambridge University Press, Cambridge, United Kingdom and
    New York, NY, USA, 1535 pp.
Introduction 9
Figure 1: Schematic illustration of the concept of (climate-related) risk as the interaction of climate-related hazards with the vulnerability
and exposure of human and natural systems.
Changes in both the climate system (left) and socioeconomic processes including adaptation and mitigation (right) are drivers of hazards,
exposure, and vulnerability.
Climate Socioeconomic processes
Vulnerability
Socioeconomic
Natural pathways
variability
Adaptation and
Hazards RISK mitigation actions
Anthropogenic
climate change
Governance
Exposure
Source: IPCC8.
8 IPCC (2014). Summary for policymakers. In: Climate Change 2014: Impact, Adaptation, and Vulnerability. Part A: Global and Sectoral
Aspects. Contribution of Working Group II to the Fifth Assessment Report of the Intergovernmental Panel on Climate Change [Field
C.B., Barros V.R., Dokken D.J., Mach K.J., Mastrandrea M.D., Bilir T.E., Chatterjee M., Ebi K.L., Estrada Y.O., Genova R.C., Girma B., Kissel
E.S., Levy A.N., MacCracken S., Mastrandrea P.R., and White L.L. (eds.)]. Cambridge University Press, Cambridge, United Kingdom and
New York, NY, USA, pp.1–32.10 Climate change implications for New Zealand | 2016 Key aspects of global climate change What is already happening? Warming of the climate system is unequivocal, and since the 1950s, many of the observed changes are unprecedented over decades to millennia. The atmosphere and oceans have warmed, the amounts of snow and ice have diminished, and sea level has risen9. Global surface temperatures have warmed, on average, by around one degree Celsius since the late 19th century10. Much of the warming, especially since the 1950s, is very likely a result of increased amounts of greenhouse gases in the atmosphere, resulting from human activity. The rate of change is far from uniform, as shown in Figure 2. 9 IPCC (2013). Climate Change 2013: The Physical Science Basis. Contribution of Working Group I to the Fifth Assessment Report of the Intergovernmental Panel on Climate Change [Stocker, T.F., D. Qin, G.-K. Plattner, M. Tignor, S.K. Allen, J. Boschung, A. Nauels, Y. Xia, V. Bex and P.M. Midgley (eds.)]. Cambridge University Press, Cambridge, United Kingdom and New York, NY, USA, 1535 pp. 10 Met Office web site, http://www.metoffice.gov.uk/news/release/archive/2015/ one-degree.
Key aspects of global climate change   11

Arctic regions and the higher latitude continents of                   movements in the earth’s crust and to global wind
the Northern Hemisphere have warmed much faster                        patterns, so rates of sea level rise vary geographically.
than the global average, while the southern oceans                     Since 1993, the rate of global mean sea level rise has
south of New Zealand latitudes have warmed more                        been around 3.3 mm per year, roughly double the rate
slowly. Generally, continental regions have warmed                     observed in the mid-20th century.
more than the ocean surface at the same latitudes.
                                                                       Recent research shows that many parts of the West
Changes in many extreme weather and climate events                     Antarctic, and some areas of the East Antarctic, are
have been observed since about 1950. Some of                           susceptible to melting from beneath by warm ocean
these changes have been linked to human influences,                    water. Because many parts of the ice sheets are
including a decrease in cold temperature extremes,                     grounded below sea level, they are vulnerable to an
an increase in warm temperature extremes, an increase                  instability that could cause irreversible loss of ice and
in extreme high sea levels and an increase in the                      the addition of several metres to global sea levels13.
number of heavy precipitation events in a number                       The exact amount of warming required to trigger
of regions11.                                                          irreversible melting is unknown, but may be as little
                                                                       as one more degree. Whatever the limit, irreversible
Global sea levels have risen around 19 cm since the
                                                                       melt becomes more likely as temperatures rise, thus
start of the 20th century, and are almost certain to
                                                                       increasing the risk if exposure and vulnerability do
rise at a faster rate in future (Figure 3). Sea-level rise
                                                                       not change. The 2°C warming “guardrail” proposed
comes about as a combination of expansion of the
                                                                       as a safe limit by the governments of the world is an
water column as it warms, the input of fresh water
                                                                       attempt to limit such risks, but is not guaranteed to
from the melting of land-based ice (glaciers and
                                                                       be risk-free.
ice sheets), and changes in land water storage (e.g.
groundwater and lakes)12. Sea levels also respond to

11 IPCC (2014). Climate Change 2014: Synthesis Report.
   Contribution of Working Groups I, II and III to the Fifth
   Assessment Report of the Intergovernmental Panel on Climate
   Change [Core Writing Team, R.K. Pachauri and L.A. Meyer
   (eds.)]. IPCC, Geneva, Switzerland, 151 pp.
12 IPCC (2013). Climate Change 2013: The Physical Science Basis.
   Contribution of Working Group I to the Fifth Assessment Report
   of the Intergovernmental Panel on Climate Change [Stocker,
   T.F., D. Qin, G.-K. Plattner, M. Tignor, S.K. Allen, J. Boschung,
   A. Nauels, Y. Xia, V. Bex and P.M. Midgley (eds.)]. Cambridge
   University Press, Cambridge, United Kingdom and New York, NY,
   USA, Chapter 13, Table 13.1.                                        13 See footnote 12, Box 13.2.
12 Climate change implications for New Zealand | 2016
Figure 2: Change in average surface air temperature (°C) over the past century.
Colour shading indicates the difference in temperature between the 2006-2015 10-year average and the 1906-1935 30-year base period.
Colour scale as indicated at the bottom. Grey shading indicates missing or insufficient data.
Note: 1. Gray areas signify missing data.
2. Ocean data are not used over land nor
within 100km of a reporting land station.
-0.2 0.2 0.5 1.0 2.0 4.0 4.1
Source: NASA . 14
Figure 3: Observed and projected global mean sea level change (metres) since 1700, from tide gauges, satellite measurements, and
climate model projections, all relative to pre-industrial values.
(Blue) low-carbon world scenario ‘RCP2.6’; (Red) high carbon world scenario ‘RCP8.5’.
1.2 –
1–
0.8 –
0.6 –
Sea level (m)
0.4 –
0.2 –
0–
-0.2–
1700 1800 1900 2000 2100
Year
Source: IPCC15.
14 NASA GISS web site, http://data.giss.nasa.gov/gistemp/maps/.
15 IPCC (2013). Climate Change 2013: The Physical Science Basis. Contribution of Working Group I to the Fifth Assessment Report of the
Intergovernmental Panel on Climate Change [Stocker, T.F., D. Qin, G.-K. Plattner, M. Tignor, S.K. Allen, J. Boschung, A. Nauels, Y. Xia, V. Bex
and P.M. Midgley (eds.)]. Cambridge University Press, Cambridge, United Kingdom and New York, NY, USA, Fig 13–27.Key aspects of global climate change 13
What might the future hold?
Surface temperature is projected to rise over the 21st world (the RCP8.5 scenario in the IPCC AR5), where
century under all assessed emission scenarios. It is emissions continue at close to current levels right
very likely that heat waves will occur more often and through this century. Actual future outcomes may
last longer, and that extreme precipitation events will lie anywhere within, but also potentially outside,
become more intense and frequent in many regions. those contrasting scenarios depending on global
The ocean will continue to warm and acidify, and developments. Figure 5 illustrates the time sequence
global mean sea level will continue to rise16. and pattern of temperature change under the two
future scenarios. In this report, we use these two
Relatively small changes in average climate can
contrasting scenarios, where possible, to illustrate
have a big effect on the frequency of occurrence or
the range of potential future changes and their
likelihood of extreme events, as illustrated in Figure 4.
implications, but in some cases, only mid-range
As temperatures rises, what were once rare hot days
scenarios (with emissions and associated climate
can occur much more frequently, while rare cold days
change roughly mid-way between the low- and high-
(e.g. frosts) may cease to be observed. A similar change
carbon worlds) were available.
would also occur for rainfall, where the occurrence of
heavy rainfalls becomes more frequent as the climate It is important to recognise that, even if all greenhouse
warms and the total amount of moisture in the gas emissions were to stop immediately, there is a
atmosphere increases. certain amount of further climate change that cannot
be avoided because of the slow response times of the
How the future plays out depends critically on the
oceans and ice sheets. Sea levels would continue to rise,
emissions of greenhouses gases that enter the
by up to 50cm above current sea levels, over the next
atmosphere over coming decades. Two possible
two centuries or more. Global average temperatures
futures to consider are labelled here as the ‘Low-
would drop slightly as methane concentrations
carbon’ world (the Representative Concentration
decrease, but temperatures would remain elevated
Pathway (RCP) 2.6 scenario in the IPCC Fifth
above pre-industrial levels for centuries, as carbon
Assessment Report (AR5)), where emissions are
dioxide concentrations decrease gradually17.
capped in the next 10 years and decline to zero well
before the end of the century, and the ‘High-carbon’
17 IPCC (2013). Climate Change 2013: The Physical Science Basis.
Contribution of Working Group I to the Fifth Assessment Report
16 IPCC (2014). Climate Change 2014: Synthesis Report. of the Intergovernmental Panel on Climate Change [Stocker,
Contribution of Working Groups I, II and III to the Fifth T.F., D. Qin, G.-K. Plattner, M. Tignor, S.K. Allen, J. Boschung,
Assessment Report of the Intergovernmental Panel on Climate A. Nauels, Y. Xia, V. Bex and P.M. Midgley (eds.)]. Cambridge
Change [Core Writing Team, R.K. Pachauri and L.A. Meyer University Press, Cambridge, United Kingdom and New York, NY,
(eds.)]. IPCC, Geneva, Switzerland, summary for policy makers. USA, Chapters 12 and 13.14 Climate change implications for New Zealand | 2016
Figure 4: Schematic illustration of how the frequency of occurrence of temperature extremes changes as average temperatures rise18.
Increase in mean temperature
Less cold
Probability of occurrence
weather
te
ate
ima
clim
New record
l
re c
More hot hot weather
ious
Futu
weather
Prev
Cold
Average
Hot
18 Reisinger A. (2009). Climate Change 101: An Educational Resource. Institute of Policy Studies and New Zealand Climate Change Research
Institute, School of Government, Victoria University of Wellington.Key aspects of global climate change 15
Figure 5: Top – Observed and projected global mean temperature change to 2100 (top graph) under the low carbon (RCP2.6)
and high carbon (RCP8.5) scenarios; Bottom – Century-scale patterns of temperature change (2081–2100 minus 1986–2005)
for the low and high carbon scenarios.
6–
4–
Global mean Observed
temperature change
2– RCP8.5
(0C relative to
1986–2005) Overlap
0–
RCP2.6
-2 –
1900 1950 2000 2050 2100
Year
Projected Temperature Change
Solid colour White dots
Very strong agreement Strong agreement
Difference from
-0.5 11.7
1986–2005 Gray Diagonal lines
mean (C0) Divergent changes Little or no change
0 2 4 6
RCP2.6 2081–2100 RCP8.5 2081–2100
Source: IPCC19.
19 IPCC (2014). Summary for policymakers. In: Climate Change 2014: Impact, Adaptation, and Vulnerability. Part A: Global and Sectoral
Aspects. Contribution of Working Group II to the Fifth Assessment Report of the Intergovernmental Panel on Climate Change [Field C.B.,
Barros V.R., Dokken D.J., Mach K.J., Mastrandrea M.D., Bilir T.E., Chatterjee M., Ebi K.L., Estrada Y.O., Genova R.C., Girma B., Kissel E.S.,
Levy A.N., MacCracken S., Mastrandrea P.R., and White L.L. (eds.)]. Cambridge University Press, Cambridge, United Kingdom and New
York, NY, USA, pp.1–32.16 Climate change implications for New Zealand | 2016
High-carbon world Rainfall would be expected to decrease by around
30% in and near subtropical regions, for a 4°C
Climate change will amplify existing risks and create warming. Near the equator and at high latitudes,
new risks for natural and human systems. Risks are rainfall increases of 40% or more are projected.
unevenly distributed and are generally greater for
disadvantaged people and communities in countries Globally, food security and fresh water availability
at all levels of development20. would be seriously compromised which may lead
to political instability and increased risk of violent
With continued strong emissions of greenhouse gases, conflict. By the end of the century, increased
global mean temperature rises are likely to be in the temperature and humidity is likely to make working
range 2.6 to 4.8°C by 2100, relative to 1986–200521. outside difficult in some parts of the world. A large
Such levels of warming would move the climate fraction of species would face increased extinction
system into a state not seen for at least several risk during and beyond the 21st century, especially
hundred thousand years. Rainfall patterns would as climate change interacts with other stressors,
change significantly, with subtropical regions drying such as habitat fragmentation22.
further and higher latitudes seeing large increases in
precipitation. The broad picture is that the wet get With strong warming, sea level rise would be expected
wetter and the dry get drier. This applies regionally, to accelerate, and be in the range of 0.52 to 0.98 m by
but also seasonally, with the drier seasons likely 2100, relative to 1986–2005. Much greater sea level
to become drier and the wet seasons wetter. rise associated with ice sheet melt is possible but the
The frequency of heatwaves and drought would timing and magnitude remains uncertain. During the
increase markedly in many parts of the globe, last interglacial period (116–129 thousand years ago)
along with an increased frequency of heavy rainfall when the world was at least 2 degrees warmer than
events in most regions. present, global mean sea levels were 5–10 metres
higher than today.
Rapid warming would be expected to continue in the
Arctic and over the high northern continents (around
8–10°C in the high carbon world), leading to complete
loss of summertime sea ice.
20 IPCC (2014). Summary for policymakers. In: Climate Change
2014: Impact, Adaptation, and Vulnerability. Part A: Global
and Sectoral Aspects. Contribution of Working Group II to the
Fifth Assessment Report of the Intergovernmental Panel on
Climate Change [Field C.B., Barros V.R., Dokken D.J., Mach K.J.,
Mastrandrea M.D., Bilir T.E., Chatterjee M., Ebi K.L., Estrada
Y.O., Genova R.C., Girma B., Kissel E.S., Levy A.N., MacCracken
S., Mastrandrea P.R., and White L.L. (eds.)]. Cambridge
University Press, Cambridge, United Kingdom and New York,
NY, USA, pp.1-32.
21 See footnote 20, RCP8.5. 22 See footnote 20.Key aspects of global climate change 17
Low-carbon world Even in the ‘low carbon’ world, the level of climate
change would still be very significant for most regions
For a low carbon world (RCP2.6), substantial and peoples. Rainfall increases or decreases of 10%
emissions reductions would be required over the or more would be common across the globe. The
next few decades, going to near zero (or below) net occurrence of heatwaves would increase, as would
anthropogenic emissions of CO2 and other long- the incidence of forest fires in many locations. The
lived greenhouse gases by the end of the century. precise levels of climate change sufficient to trigger
Emissions may need to become negative from abrupt and irreversible changes remain uncertain,
late-century (it is likely that CO2 would have to be but the risk associated with crossing such thresholds
actively removed from the atmosphere to achieve increases with rising temperature24.
this goal, e.g. by energy production using biomass
which absorbs CO2 from the atmosphere as it grows, In summary, a low-carbon world would reduce but not
then capturing CO2 emitted during combustion and eliminate many key climate-related risks. Adaptation
storing it underground). Global mean warming would to those climate changes would still be necessary and
likely flatten off a little under 2°C above pre-industrial may entail substantial changes for some sectors and
temperatures. There would still be significant change regions, but would be more feasible than in a high-
in the frequency of extreme events, including heat carbon world.
waves, floods and droughts, and associated climate-
related risks, but well below the level seen in the high-
carbon world. Warming would likely reach 3–4°C in
and near the Arctic (Figure 5). Global mean sea level
is likely to rise by between 0.28 and 0.61 m by 2100
and would continue to rise slowly for many centuries,
even as greenhouse gas concentrations decrease.
Greater sea level rise, of up to 7 m over 1000 years
or more, is possible. The threshold for near-complete
loss of the Greenland ice sheet is estimated to be
between 1°C and 4°C global mean warming above
pre-industrial temperatures23.
23 IPCC (2013). Summary for Policymakers. In: Climate
Change 2013: The Physical Science Basis. Contribution of
Working Group I to the Fifth Assessment Report of the
Intergovernmental Panel on Climate Change [Stocker, T.F., D.
Qin, G.-K. Plattner, M. Tignor, S.K. Allen, J. Boschung, A. Nauels,
Y. Xia, V. Bex and P.M. Midgley (eds.)]. Cambridge University
Press, Cambridge, United Kingdom and New York, NY, US. 24 See footnote 23.18 Climate change implications for New Zealand | 2016 Key aspects of climate change for New Zealand New Zealand climate is changing. The Australasian region continues to show long-term trends toward higher surface air and sea surface temperatures, more hot extremes and fewer cold extremes, and changed rainfall patterns. Warming is projected to continue through the 21st century along with other changes in climate.
Key aspects of climate change for New Zealand           19

Warming is expected to be associated with rising
snow lines, more frequent hot extremes, less frequent                 What is already
cold extremes, and increasing extreme rainfall related
to flood risk in many locations. Annual average rainfall
                                                                      happening?
is expected to decrease in the northeast South
Island and northern and eastern North Island, and                     Over New Zealand, temperatures are rising and
to increase in other parts of New Zealand. Drought                    there is some evidence of changing rainfall patterns.
frequency could double or triple in eastern and                       Averaged over the country, temperatures have risen
northern New Zealand by 2040, and fire weather is                     around 1°C in the past century and there has been
projected to increase in many parts of New Zealand.                   a matching but slightly smaller rise in ocean surface
Regional sea level rise will very likely exceed the                   temperatures around our coasts. Rainfall totals have
historical rate (1971–2010), consistent with global                   increased in the southwest of the South Island and
mean trends. Without adaptation, further changes in                   have decreased in the north of the North Island26,
climate, atmospheric carbon dioxide (CO2), and ocean                  although there is a lot of variability from year to
acidity are projected to have substantial impacts on                  year. Some heavy rainfall events already carry the
water resources, coastal ecosystems, infrastructure,                  fingerprint of a changed climate, in that they have
health, agriculture, and biodiversity25.                              become more intense due to higher temperatures
                                                                      allowing the air to carry more moisture27. Sea levels
                                                                      around the coasts have risen an average of 17 cm in
                                                                      the past century28, a change that matches the global
                                                                      average rise.

25 Reisinger A., Kitching R.L., Chiew F., Hughes L., Newton P.C.D.,
   Schuster S.S., Tait A., & Whetton P. (2014). Australasia. In:
   Climate Change 2014: Impacts, Adaptation, and Vulnerability.
   Part B: Regional Aspects. Contribution of Working Group II         26 See footnote 25.
   to the Fifth Assessment Report of the Intergovernmental            27 Dean S. M., Rosier S., Carey-Smith T., and Stott P. A. (2013).
   Panel on Climate Change [Barros V.R., Field C.B., Dokken              The role of climate change in the two-day extreme rainfall
   D.J., Mastrandrea M.D., Mach K.J., Bilir T.E., Chatterjee M.,         in Golden Bay, New Zealand, December 2011 [in “Explaining
   Ebi K.L., Estrada Y.O., Genova R.C., Girma B., Kissel E.S., Levy      Extreme Events of 2012 from a Climate Perspective”]. Bull.
   A.N., MacCracken S., Mastrandrea P.R., & White L.L. (eds.)].          Amer. Meteor. Soc., 94, S61–S63.
   Cambridge University Press, Cambridge, United Kingdom and          28 Hannah J. & Bell R.G. (2012). Regional sea level trends in
   New York, NY, USA,. https://ipcc-wg2.gov/AR5/report/- Chapter         New Zealand. Journal of Geophysical Research: Oceans 117:
   25, Australasia.                                                      C01004.
20 Climate change implications for New Zealand | 2016
What might the future hold?
New Zealand will generally follow global changes but High-carbon world
with some differences. For example, New Zealand
can expect temperatures to rise less than the global In a high carbon world, we can expect temperatures
average due to ocean buffering (Figure 6); sea level to rise by between another 2.5 and 5°C this century,
rise is likely to be around 10% more than the global averaged across the country (Figure 6). Annual average
average; and rainfall patterns will be strongly influenced rainfall is projected to decrease by about 10% in the
by New Zealand’s topography, meaning that rainfall will east and north of the country, with droughts currently
change differently in different parts of the country. considered as severe (i.e. those droughts that typically
occur only once every 20 years or so) becoming several
How the future plays out depends critically on times more frequent in those areas. Western regions
the emission of greenhouses gases that enter the would see annual average rainfall increase by up to 10%
atmosphere over coming decades. For the two or more, especially in the south (Figure 7). Sea-level
possible futures outlined above, both will mean rise is expected to accelerate, to reach between 0.6
changes from New Zealand’s current climate, with the and 1.1 m by 2100, relative to 1986–2005 levels (global
main difference being the rate and amount of change. mean rate plus 10%, approximately). As noted earlier,
sea levels could rise further this century depending
on the response of the major ice sheets, and would
keep rising at a high rate for many centuries after that.
Ocean water would continue to become more acidic
(less alkaline), possibly reaching levels of acidity not
seen for tens of millions of years.
Figure 6: Changes in average New Zealand temperature under different emissions scenarios.
Note: Shading denotes the 5th to 95th percentile range of climate model simulations driven with ‘historical’ changes in anthropogenic and natural
drivers, historical changes in ‘natural’ drivers only, a low-carbon world (RCP)2.6 emissions scenario, and a high carbon world (RCP8.5) scenario.
8– Average near surface
temperature
6– Observed
4– Historical
Average temperature
Overlap
(0C relative to 1986–2005)
2–
Natural
0– RCP8.5
Overlap
-2 –
1900 1950 2000 2050 2100 RCP2.6
Year
Source: IPCC .29
29 IPCC, 2014: Climate Change 2014: Impacts, Adaptation, and Vulnerability. Part B: Regional Aspects. Contribution of Working Group II to the Fifth
Assessment Report of the Intergovernmental Panel on Climate Change [Barros V.R., Field C.B., Dokken D.J., Mastrandrea M.D., Mach K.J., Bilir T.E.,
Chatterjee M., Ebi K.L., Estrada Y.O., Genova R.C., Girma B., Kissel E.S., Levy A.N., MacCracken S., Mastrandrea P.R., and White L.L. (eds.)]. Cambridge
University Press, Cambridge, United Kingdom and New York, NY, USA, 688 pp. https://ipcc-wg2.gov/AR5/report/- Chapter 25. Figures 25-2.Key aspects of climate change for New Zealand 21
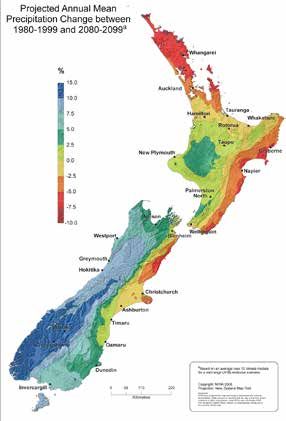
Figure 7: Average changes in annual mean temperature (left, degrees Celsius) and precipitation (right, percent) during 2080–2099
compared to 1980–1999, for a climate change scenario midway between low- and high-carbon futures.
Projected Annual Mean Temperature Change Projected Annual Mean Precipitation Change
between 1980–1999 and 2080–2099 between 1980–1999 and 2080–2099
0C Mean temperature % Precipitation
2.2 15.0
2.1 10.0
2.0 7.5
1.9 5.0
1.8 2.5
0.0
-2.5
-5.0
-7.5
-10.0
0 55 110 220
Kilometres
Source: Ministry for the Environment30.
30 Ministry for the Environment (2008). Preparing for Climate Change: A guide for local government in New Zealand. https://www.mfe.govt.
nz/sites/default/files/preparing-for-climate-change-guide-for-local-govt.pdf.22 Climate change implications for New Zealand | 2016
Low-carbon world
Learn more
In a low carbon world, temperatures would still climb
as some level of climate change is already locked
in due to current and past emissions. New Zealand For more information on climate change effects upon
temperatures would rise by up to another 1°C this New Zealand, see:
century, averaged across the country. Even this level • IPCC information on Australasia. In: Climate
of further warming would likely lead to drying (in the Change 2014: Impacts, Adaptation, and
annual average) in the east and north of the country Vulnerability. Part B: Regional Aspects.
with increased drought risk, plus averaged rainfall Contribution of Working Group II to the Fifth
increases of a few percent in western areas, especially Assessment Report of the Intergovernmental
in the South Island. Sea levels would continue to rise Panel on Climate Change. http://www.ipcc.ch/pdf/
by another 0.3 to 0.6 m by 2100, but continue to assessment-report/ar5/wg2/WGIIAR5-Chap25_
rise beyond 2100, even if global temperatures have FINAL.pdf.
stabilised, as land-based ice will continue to melt and
the oceans would continue to warm as they adjust • Ministry for the Environment web page on Climate
to a warmer atmosphere. Ocean water would also change impacts in New Zealand. http://www.mfe.
become more acidic, but at a slower rate than has govt.nz/climate-change/how-climate-change-
been seen in the past few decades. affects-nz/climate-change-impacts.
• New Zealand Climate Change Centre summary
of IPCC AR5 for New Zealand. https://www.
nzclimatechangecentre.org/research/ipcc-fifth-
Regional variability assessment-report-new-zealand-findings.
and extreme events
Temperature rise is expected to be relatively uniform
across the country, while rainfall changes are expected
to exhibit an east-west gradient with increases on
averages in the west and decreases in the east and
north (Figure 7).
Warming will increase the number of high heat days
(Figure 8) and will reduce the number of frost days.
In the high-carbon world, many places will see more
than 80 days per year above 25°C by 2100, whereas
currently most parts of the country typically see
between 20 and 40 days per year above 25°C.
Extreme heavy rainfall events are expected to become
more frequent in most parts of the country, by a
factor of up to four, especially those regions where
an increase in average rainfall is expected.31
The occurrence of extreme sea level and coastal
flooding events changes rapidly as mean sea levels
rise. For example, with a 30 cm rise in sea level, the
current ‘1 in 100 year’ extreme sea level event would
be expected to occur once every year or so in many
coastal regions.32
31 Ministry for the Environment (2008), “Preparing for Climate
Change”. Report prepared by NIWA.
32 Parliamentary Commissioner for the Environment (2015).
Preparing New Zealand for rising seas: Certainty and
Uncertainty. http://www.pce.parliament.nz/publications/
preparing-new-zealand-for-rising-seas-certainty-and-
uncertainty.Key aspects of climate change for New Zealand 23
Figure 8: Estimated number of days with maximum temperatures exceeding 25°C, for the current climate (~2015), mid-21st century
(~2050) and late 21st century (~2100), under the high carbon scenario (RCP8.5).
Number of days ~2015 ~2050 ~2100
exceeding 25oC
>100
80–100
60–80
40–60
20–4024 Climate change implications for New Zealand | 2016 Key risks for New Zealand This report highlights six key risks from climate change to New Zealand: inundation and erosion of coasts, flooding from river systems, pressure on fresh water resources, changes in the ocean, threats to land-based and freshwater ecosystems, and repercussions of global changes for New Zealand. While these cover not all implications and risks associated with climate change, they are considered to pose some of the largest risks to New Zealand (taking into account hazards, exposure and vulnerability, as well as the scale of likely impacts and their probability of occurrence), and could affect large sections of New Zealand society.
Key risks for New Zealand   25

Climate change will have other important implications      This report also does not focus on possible benefits
(for example for human health, energy generation and       of climate change. Key examples of potential benefits
distribution, transport and infrastructure), but these     include longer seasons for pasture growth, increased
are not discussed in detail in this report as they were    forest growth where soil conditions and rainfall are
not considered to be key risks at the same scale and       not limiting, reduced electricity demand for winter
with the same implications for near-term decision-         heating and potentially lower winter mortality. While
making as the six areas covered in this report. There is   not irrelevant, many of those benefits will be limited
a growing body of research which shows that climate        geographically or to some sectors, and often come
change generally acts to increase existing tensions and    with counterbalancing negative consequences (for
stresses, for example on food and water supplies,          example, higher temperatures and CO2 concentrations
or on land use. How to best manage those stresses,         stimulate growth of pests and weeds at least as much
and how the different identified risks interact with and   as existing pastures). Also, the existence of benefits
affect wider changes in the social fabric of the country   to some parts of society does not remove the need
is not considered directly here but will be critical       to proactively identify and subsequently manage
especially where transformational changes                  downside key risks from climate change for
are necessary.                                             New Zealand as a whole. This report does not attempt
                                                           to present a comprehensive analysis of all potential
                                                           impacts and implications of climate change but
                                                           deliberately focuses on those areas that could present
                                                           the biggest challenges to New Zealand and that
                                                           require our collective attention.
26 Climate change implications for New Zealand | 2016 Coastal change: New Zealanders live mainly near coasts Shoreline ecology, public infrastructure, residential and commercial assets, community values and the future use of coastal-marine resources will be severely affected by changes to coasts due to sea level rise, and storm surge, and secondary effects such as erosion and flooding.
Coastal change: New Zealanders live mainly near coasts           27

                                                      FOR
                                                      SALE

What climate trends will affect
New Zealand’s coasts?
The key drivers of coastal change include (i) rising                   As an example of what we might expect, recent
sea levels leading to increasing frequency and                         analyses of return periods for extreme sea-levels
volume of inundation by storm-tides, wave run-up                       along the Otago Coast determined that the sea level
and overtopping34; and (ii) changing atmospheric                       difference between 2-year and 100-year storm surges
circulation patterns linked to stronger storms and                     is about 32 cm, and that the difference between
changes in wind and wave energy at the coast.                          20-year and 500-year high sea level events is about
Rising sea levels will also influence groundwater near                 25 cm36. Consequently, by 2050, sea level rise of
the coast, leading to semi-permanent or permanent                      30 cm (mid-range estimate37) will make the 100-year
inundation of low-lying areas, and the potential for                   event an almost annual event and a currently very
salt-water intrusion into freshwater systems such as                   rare 500-year event becomes a 20 year event.
shallow aquifers35. At the same time, rainfall patterns
are also expected to change which will lead, in some
cases, to increased occurrences of flooding at coastal-
river margins.

                                                                       36 Parliamentary Commissioner for the Environment (2015).
                                                                          Preparing New Zealand for rising seas: Certainty and
                                                                          Uncertainty.
                                                                       37 Church, J.A., P.U. Clark, A. Cazenave, J.M. Gregory, S.
                                                                          Jevrejeva, A. Levermann, M.A. Merrifield, G.A. Milne, R.S.
                                                                          Nerem, P.D. Nunn, A.J. Payne, W.T. Pfeffer, D. Stammer and
                                                                          A.S. Unnikrishnan, 2013: Sea Level Change. In: Climate
34 Rouse H.L., Bell R.G., Lundquist C., Blackett P., Hicks D.M., and      Change 2013: The Physical Science Basis. Contribution of
   King D.N. (submitted). Coastal adaptation to climate change in         Working Group I to the Fifth Assessment Report of the
   Aotearoa-New Zealand. Submitted to NZJMFR August 2015.                 Intergovernmental Panel on Climate Change [Stocker, T.F., D.
35 Parliamentary Commissioner for the Environment (2014).                 Qin, G.-K. Plattner, M. Tignor, S.K. Allen, J. Boschung, A. Nauels,
   Climate change and rising seas: Understanding the science.             Y. Xia, V. Bex and P.M. Midgley (eds.)]. Cambridge University
   November 2014.                                                         Press, Cambridge, United Kingdom and New York, NY, USA.
28 Climate change implications for New Zealand | 2016
What is already What might the
happening? future hold?
Climate-induced coastal change is a significant risk for In a high carbon world, we can expect sea levels
New Zealand due to existing location of populations around the New Zealand coast to rise by between
and their services near the coast and to intensifying 0.6 and 1.1 m by 2100 and continuing to rise beyond
coastal development While only 2–2.5% of the total 2100. A 0.8 m rise in sea level would mean that the
New Zealand land area lies below 10 m in the coastal current 1-in-100-year high tide level will be exceeded
margin (relative to mean high water), around 16% during more than 90% of high tides (i.e. almost daily).
of the population live in this zone38. Sea levels in In addition to sea-level rise, the projected changes
New Zealand have risen an average of 17 cm in the to the frequency and intensity of storms will mean
last 100 years39, in line with global trends. Some greater potential for erosive storm events at the coast,
studies have suggested that the rate of rise may with storm surges on top of already higher mean
be increasing, and is currently around 3 mm/yr40. sea levels41. Given the large proportion of existing
Episodes of extreme coastal flooding are already capital investment on low lying coastal land and the
occurring, such as recurring flooding of Auckland’s ongoing intensification of development along coastal
north-western motorway and Tamaki Drive (a principal margins, some areas will be highly sensitive to climate
arterial route to the eastern suburbs of Auckland) in driven changes. Mapping exercises have shown42 that
2001, 2011 and 2012 due to storm surges coinciding the east coasts of both North and South Islands are
with king tides. In South Dunedin, the high water more sensitive to erosion and inundation caused by
table means that increasingly frequent very high tides climate change, because of a combination of factors
will lead to frequent surface ponding and a lack of such as wave exposure, relatively low tidal ranges,
drainage for storm water13. sediment budget deficits, and proximity to tidal
inlets. Conversely, west coast shores are less sensitive
to climate-driven change, mainly because they are
already regularly exposed to high wave energy.
It is expected that the interplay of these different
circumstances will lead to significant changes in our
coastal environment, ranging from inundation and
erosion of coastal margins to the landward migration
of beaches and coastal ecosystems. Such changes
are already resulting in coastal ‘squeeze’ up against
public and private infrastructure and assets, and pose
significant implications for different sectors, systems
and groups across society. See Ecosystem changes for
more information on changes to coastal ecosystems.
38 Based on the 2006 New Zealand census (http://www.stats.govt.
nz/Census/2006CensusHomePage.aspx ); Bell R. & Wadhwa S.
(2014). National coastal susceptibility: Vulnerable areas and
demographics. National Institute of Water & Atmospheric
Research Ltd. June 2014.
39 Hannah J. & Bell R. (2012) Regional sea level trends in New
Zealand. Journal of Geophysical Research: Oceans 117: C01004.
40 Church, J.A., P.U. Clark, A. Cazenave, J.M. Gregory, S.
Jevrejeva, A. Levermann, M.A. Merrifield, G.A. Milne, R.S. 41 Parliamentary Commissioner for the Environment (2015).
Nerem, P.D. Nunn, A.J. Payne, W.T. Pfeffer, D. Stammer and Preparing New Zealand for rising seas: Certainty and
A.S. Unnikrishnan, 2013: Sea Level Change. In: Climate Uncertainty.
Change 2013: The Physical Science Basis. Contribution of 42 Goodhue N., Rouse H.L., Ramsay D., Bell R.G., Hume T.M.,
Working Group I to the Fifth Assessment Report of the and Hicks D.M. (2012). Coastal adaptation to climate change:
Intergovernmental Panel on Climate Change [Stocker, T.F., D. mapping a New Zealand coastal sensitivity index. A report
Qin, G.-K. Plattner, M. Tignor, S.K. Allen, J. Boschung, A. Nauels, prepared as part of the Coastal Adaptation to Climate Change
Y. Xia, V. Bex and P.M. Midgley (eds.)]. Cambridge University Project under contract (C01X0802) to FRST/MSI. NIWA,
Press, Cambridge, United Kingdom and New York, NY, USA. Hamilton, New Zealand.You can also read