Climate Change Impacts on Children in the Pacific: Kiribati and Vanuatu - Children and Climate Change - Unicef
←
→
Page content transcription
If your browser does not render page correctly, please read the page content below
Children and Climate Change

Climate Change Impacts
on Children in the Pacific:
Kiribati and Vanuatu
Children and Climate Change

Climate Change Impacts
on Children in the Pacific:
Kiribati and Vanuatu
Climate Change Impacts on Children in the Pacific:
Kiribati and Vanuatu

A climate planning report, Commissioned by UNICEF

Authors:
Donovan Burton, Climate Planning, Brisbane, Australia
(donovan@climateplanning.com.au)
Johanna Mustelin, Griffith Centre for Coastal Management and
Urban Research Program, Griffith Climate Change Response Program,
Griffith University, Gold Coast, Australia (j.mustelin@griffith.edu.au)
Peter Urich, CLIMsystems (peter@climsystems.com)

A recommended citation for this report is: Burton, D., Mustelin, J. and
Urich, P., Climate change impacts on children in the Pacific: Kiribati and
Vanuatu technical report, commissioned by UNICEF, Bangkok, 2011.

Acknowledgements:
The authors wish to thank particularly Dr Glen Hornby (Kiribati),
Kami Roberts and the team at Live and Learn (Vanuatu) for their
collaboration, and the UNICEF team (Jill Lawler, Samantha Coco-Klein,
Mereia Carling, Lucy Stone, Antony Spalton and anonymous reviewers)
for robust and insightful comments on earlier drafts of this report.

The designation of geographical entities in this report do not imply the
expression of any opinion whatsoever on the part of UNICEF
concerning the legal status of any country, territory, or area, or of its
authorities, or concerning the delimitation of its frontiers or boundaries.

The views expressed in this publication do not necessarily reflect those
of UNICEF.

This publication has been made possible in part by in-kind support and
funding from Reed Elsevier and the UNICEF UK National Committee.

Published by: UNICEF East Asia and Pacific Regional Office
Copyright: © 2011 UNICEF East Asia and Pacific Regional Office

Cover photo: © Johanna Mustelin

Available from:
United Nations Children’s Fund
3rd & 5th Floor, FDB Building
360 Victoria Parade
Suva, FIJI
www.unicefpacific.org
Foreword

There is no doubt that climate change is one of the biggest development challenges of the
twenty-first century. Communities across the globe are already experiencing the impacts of more
extreme weather events, temperature changes and disease outbreaks. No one is immune to the
effects of climate change, which come as direct impacts, such as cyclones, storm surges and
extreme temperatures, and indirect in how it affects access to income, good nutrition, education
and health care as well as the psychological stress. Children, however, are likely to be doubly
impacted: first in how they are directly impacted and then how the impacts on their parents and
communities affect their lives.

Some of the leading killers of children worldwide are highly sensitive to climate change. Higher
temperatures have been linked to increased rates of malnutrition, cholera, diarrhoeal disease
and vector-borne diseases like dengue and malaria. Children’s underdeveloped immune systems
put them at far greater risk of contracting these diseases and succumbing to their complications.
Additionally, the loss of a parent or home due to a climate change-induced natural disaster
certainly changes a child’s world but it also can jeopardize their development.

The discussions, debates and planning processes regarding climate issues circumnavigate the
options for mitigating the impacts and, increasingly, adapting to them so that communities and
households are better prepared and braced for the intense changes that are likely to occur.
UNICEF welcomes the focus on risk reduction and adaptation. But these conversations and
decisions taking place too often are failing to consider the particular -- and distinct -- impacts
on children.

UNICEF is committed to ensuring the protection of children and young people in a changing
climate and to supporting their participation in decision-making processes that will ultimately
impact their future. UNICEF is stepping up efforts to strengthen programming that reduces
children’s risk to climate change and natural hazards. The organization has also invested
resources to help develop the knowledge base on children’s vulnerabilities to climate change as
well as the role they can take in shaping a more sustainable and climate-resilient future.

In 2011, UNICEF, with support from Reed Elsevier, commissioned field research in Indonesia,
Kiribati, Mongolia, Philippines and Vanuatu to see if there were noticeable patterns and trends of
climate change and disaster impacts on children. The studies also included interviews with
children and youth to assess their perspectives on climate change.

This report presents the findings from the research in Kiribati and Vanuatu along with insights
relevant to all Pacific countries. Recommendations are included for governments in the region
and for agencies working with children and/or climate change issues.

This work reminds us of the connection between climate change and the other challenges
confronting children. It also reminds us that children’s experiences and the risks they encounter,
in terms of the effects on their health, education and development, are unique. The policies and
decisions made today will set the tone for years to come. Now is the time to put in place
adaptation strategies and low-carbon development plans that ensure that the risks specific to
children are addressed. By doing this, we will go some way in helping to build a climate-resilient
world for children.

						Anupama Rao Singh
						Regional Director
						 UNICEF East Asia and Pacific Regional Office
						Bangkok
Contents

Acronyms and terms                                                      vii

Executive summary                                                       ix

1.   Introduction                                                        1

2.   Methodology                                                         2
     2.1  Desktop research                                               2
     2.2  Field visits                                                   2
     2.3  Climate change projections                                     3

3.   Study-region context                                                5
     3.1   Kiribati geographic and socio-economic context                5
     3.2   Vanuatu geographic and socio-economic context                 5
     3.4   Existing climate and climate drivers                          6

4.   Climate change modelling                                            9
     4.1   Projections for average temperature and rainfall              9
     4.2   Projections for extreme temperature and rainfall             11
     4.3   Projections for sea level rise                               14

5.   Potential climate change impact on children in the Pacific         16
     5.1   Context-specific issues: urbanization in the Pacific         16
     5.2   Specific climate change challenges                           17
     5.3   Temperature-related impacts                                  18
     5.4   Increased sea surface temperatures and ocean acidification   18
     5.5   Rainfall-related impacts                                     19
     5.6   Sea level rise-related impacts                               20
     5.7   Impacts from climate change adaptation policies              21
     5.8   Summary of climate change risks                              24

6.   Children’s understanding of climate change                         27
     6.1    Children’s workshop in Vanuatu                              27
     6.2    Children’s workshop in Kiribati                             28
     6.3    Children’s awareness and preparation                        29

7.   Current capacity and adaptation practices                          32

8.   Recommendations                                                    37

9.   Conclusion                                                         41

Appendices42
    Appendix I:     CLIMsystems climate change modelling                42
    Appendix II:    Summary of workshop findings                        59
    Appendix III:   Sentinel sites and climate change                   62

References 63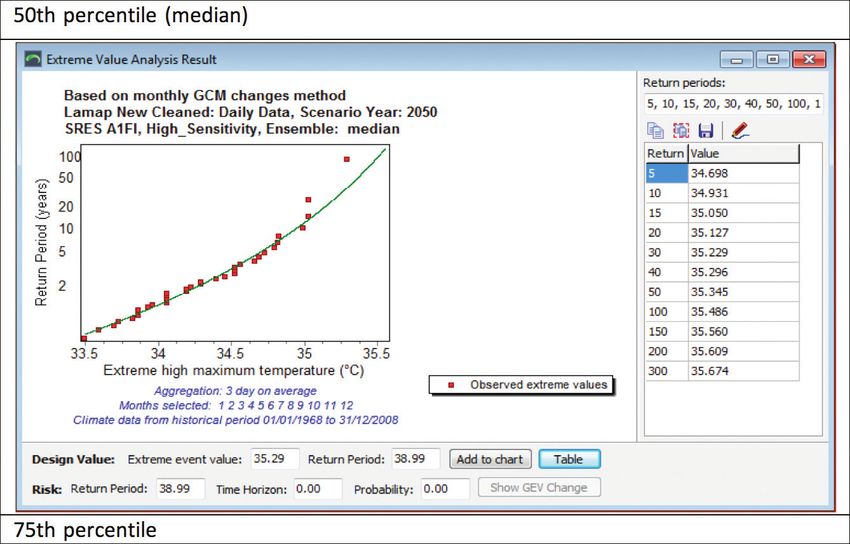
Acronyms and terms

AR4		      Fourth Assessment Report of the IPCC (2007)

AusAID		   Australian Agency for International Development

COP		      Conference of the Parties (United Nations Climate Change Conference)

DRR		      disaster risk reduction

ENSO		     El Niño Southern Oscillation

IPCC		     Intergovernmental Panel on Climate Change

NAPA		     National Adaptation Programme of Action

NZAID		    New Zealand Agency for International Development

SIDS		     Small Island Developing States

SRES		     Special Report on Emission Scenarios (IPCC)

UNFCCC     United Nations Framework Convention on Climate Change

UNICEF		   United Nations Children’s Fund

WHO		      World Health Organization

                                                                                  vii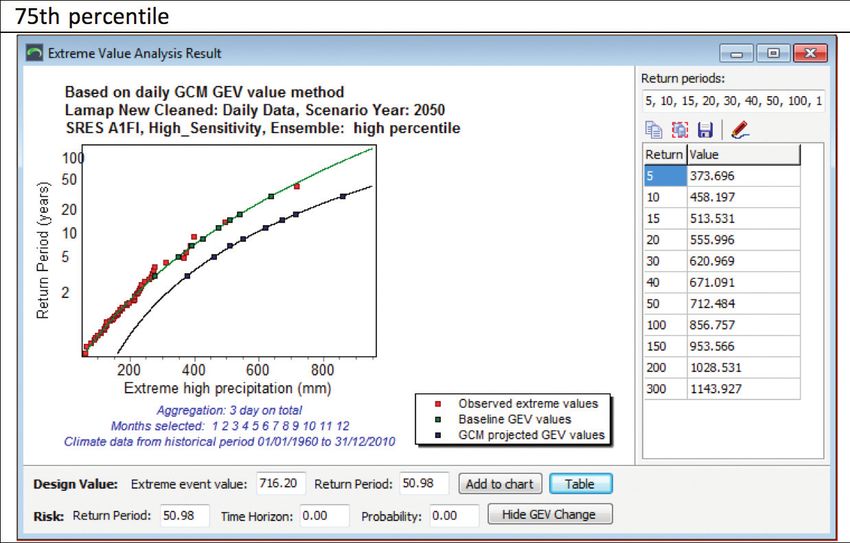
Executive summary

This paper explores the impacts that climate                         challenges, cyclone risks (in Vanuatu) and
change will likely have on children in the Pacific,                  considerable coastal erosion. The climate
with particular focus on Kiribati and Vanuatu. It                    change-related issues confronting the Small
provides insights into how different actors in                       Island Developing States (SIDS), like Kiribati,
those two countries are currently considering                        are dominated by the projections of sea level
children in their policies and programmes.                           rise because of the expected life-changing
Included is an outline of the possible directions                    impacts. Even low-end projections will require
for UNICEF in its pursuit of a children-sensitive                    considerable roll-out of infrastructure solutions
response to the multiple challenges that                             (such as sea walls and water storage facilities)
changing climate will bring. The paper builds                        as well as non-engineering-based responses
on a growing body of climate change-related                          (psychosocial support). The high-end sea level
studies of the Pacific Islands situation. It is the                  rise projections challenge the very existence of
first paper to publically present climate change                     Kiribati. Under a best-case scenario, it is more
modelling together with a review of Pacific                          than likely that both Kiribati and Vanuatu will
climate change adaptation plans to support the                       need to relocate some communities to less
call for more child-focused climate change                           exposed areas, including international
actions. The paper also highlights the scarcity                      relocation.
of child-specific climate change studies from
the Pacific.                                                         Without drastic global cuts in greenhouse gas
                                                                     emissions by 2050, it is likely that sea level rise
The results of the modelling created for this                        will have direct (such as loss of land) and
study indicate that both case study countries                        indirect (psychological issues associated with
are projected to experience a slightly lower                         forced relocation) consequences for Kiribati
rise in their maximum temperature compared                           due to the nation’s low-lying nature. Although
with the projected global average (of 2.7°C).                        sea level rise does not threaten to completely
According to the modelling, maximum                                  submerge Vanuatu (as it does in Kiribati), it still
temperatures are projected to increase in                            presents multiple challenges. These include
Kiribati by 2.1°C and in Vanuatu by 1.9°C by                         forced relocations of low-lying communities
2050, relative to the 1961–1990 average. In                          and increasing risks from storm surge (when
comparison, the Intergovernmental Panel on                           combined with cyclones).
Climate Change (IPCC) has projected average
temperatures of up to 2.48°C (for the North                          Currently, children have a limited role in
Pacific) and 1.79°C (for the South Pacific) by                       adaptation actions in both countries, although
2069 (Mimura et al., 2007).1 Unlike                                  there has been a recognizable shift in Kiribati
temperature, which has a reasonably uniform                          policies towards including children in some
result across all models, the climate change                         adaptation discussions (inclusion in the
projections for rainfall in the case study                           upcoming relocation discussions, for instance).
countries present a broad range of future                            In Kiribati, many children are helping to plant
scenarios, ranging from -2 per cent to an                            mangroves to help protect the coastline from
increase of 75 per cent by 2050 (the median of                       increased wave action. In Vanuatu, children
the models shows a 2 per cent increase for                           have been engaged in river clean-up projects,
Lamap, Vanuatu and a 26 per cent increase in                         which have been used also as an opportunity
Tarawa, Kiribati).                                                   to increase environmental awareness and
                                                                     education. Both countries have active climate
The range of risks unfolding in both countries                       change youth groups engaged in international
include increased health issues, decreased                           awareness-raising activities.
potable water availability, food security

1
    The IPCC projections for the Pacific were from seven general
    circulation models, whereas this study used an ensemble of 21.

viii
Kiribati and Vanuatu, like many SIDS in the Eighteen months has passed since the last
Pacific, have had an expedited need to embrace UNICEF study of climate change impacts on
adaptation. The degree of impact from climate children in the Pacific (Urbano and Maclellan,
change they experience will be determined by 2010), and it seems evident that little progress
the rest of the international community’s ability has emerged in relation to the consideration of
and willingness to reduce greenhouse gas children in climate change studies and policies.
emissions. The SIDS in the Pacific are Greater emphasis and advocacy must be given
geographically and economically vulnerable to to this situation.
the impacts of climate change, which are likely
to emerge sooner rather than later. Without the Considerable opportunities exist for child-led
luxury of time, rapid adaptation is a necessity, and child-focused responses to the effects of
which in turn increases the likelihood of climate change. The following table presents a
unanticipated consequences arising from summary of possibilities that emerged through
climate change responses. the research for this study.
Opportunities for adaptive action and capacity building to support the inclusion
and consideration of children in climate change responses
Actor Opportunities for adaptive action and capacity building
Government • Embed children’s rights into all climate change policies and planning
• Ensure all climate change policies contain a ‘summary for children’ chapter
• Undertake sensitive climate change education campaigns
• Create a framework for assessing climate policies against the impacts on the
rights of children
• Undertake studies that explore the impacts of relocation
• Identify and support sentinel sites (in conjunction with UNICEF) for early
indicators of climate-related impacts
• Undertake more detailed child-specific risk assessments at the local level
Children • Disseminate information about climate change impacts and adaptation
(take information learned at school and help increase awareness at home)
• Engage in soft infrastructure solutions (such as mangrove planting)
• Participate in the planning for extreme weather and climate change
(included in actor discussions)
• Use active learning to help inform about climate change and extreme
weather (local weather stations)
• Share their stories about impacts and adaptation actions with national and
international audiences through the Internet and /or conferences
• Participate in creating a framework for ‘summary for children’ chapters –
including advice on good information dissemination platforms (fact
sheets, online, mobile phone, social media, school, theatre, etc.)
Development partners • Ensure that all projects have children’s rights embedded into the objectives
• Include a ‘summary for children’ (similar to summary for policy-makers) in all
project reports
• Work with countries and UN agencies to develop guiding principles for
consideration of children in adaptation planning
UN agencies • Embed considerations for children’s rights in guidelines for the National
United Nations Framework Convention on Climate Change national
action plans and any future adaptation mechanisms
• Create an IPCC ‘summary for children’ chapter for all IPCC reports
(similar to summary for policy-makers)
• Create a framework that allows for the evaluation of proposed adaptation actions
and projects to assess the potential impacts on the rights of children
• Undertake child-specific impact analysis for adaptation actions and guidelines
• Create guidelines for the ‘summary for children’ and ‘summary for child advocacy’
ix1. Introduction
Many developing countries are already feeling This paper explores the potential impacts that
the impacts of climate change. Small Island climate change will likely have on children in
Developing States (SIDS) are particularly the Pacific, with a particular focus on Kiribati
vulnerable to these impacts due to their physical and Vanuatu. Specifically, this research team:
characteristics, such as low-lying topography
and dependence on natural resources (Mimura • reviewed national adaptation plans of action
et al., 2007; Rodgers, 2009). Additionally, a large in the Pacific to assess how different actors
proportion of countries in the Pacific have are currently considering children in their
complex social, environmental, economic and policies and programmes across the region
political problems, which may weaken their
responses to climate change. These include • explored the potential future climate of
rapid urbanization, socio-economic change, Vanuatu and Kiribati (through modelling
lack of sanitation infrastructure, scarce water and desktop research)
resources, extensive poverty and weak
governance and service delivery issues. • identified potential climate change risks for
children in Vanuatu and Kiribati (including
In recent years, many Pacific Island nations risks presented by adaptation policies and
developed climate adaptation strategies and actions, with a focus on health and cultural
policies to provide a platform for guidance on impacts)
how climate adaptation should proceed.
Nonetheless, because climate adaptation is a • identified research gaps
rather new topic for many government
departments, donors and organizations, there • outlined possible directions that government
is currently limited knowledge on how they can and non-government agencies could pursue
effectively embrace the issue and help to in responding coherently to the multiple
integrate child-focused and child-led child-specific challenges that the changing
approaches into adaptation policies and climate is bringing.
processes. Even though climate change
impacts vary across the Pacific, there are many
relevant issues that can be explored using a
case study approach.
Climate Change Impacts on Children in the Pacific: Kiribati and Vanuatu 12. Methodology
This study was commissioned by UNICEF East Qualitative interviews
Asia and Pacific Regional Office (EAPRO) and Interviews were conducted face to face with 12
was conducted over a 60-day period during respondents in Vanuatu and 8 in Kiribati.
July to September 2011. It contributes to a Additionally, 6 people were engaged through
review of climate change impacts confronting telephone interviews and email contact.
children in the Asia-Pacific region. The research Anonymity of the respondents in the research
relied on a desktop literature review, field process was always negotiated and agreed
visits, semi-structured interviews, children’s prior to engagement. Semi-structured
workshops and climate change modelling. interviews were chosen because they produce
in-depth information on various responses and
expectations. Interviews played a significant
2.1 Desktop research role in helping to provide a contextual
background to the study. During the
This UNICEF study included a review of the interviews, respondents were first asked about
national adaptation programmes of action and the existing social, environmental and
national communications (across the Pacific economic milieu of their respective country
region) that respond to the United Nations and then encouraged to discuss child-specific
Framework Convention on Climate Change issues and policies relating to climate change.
(UNFCC) to better establish the extent to which
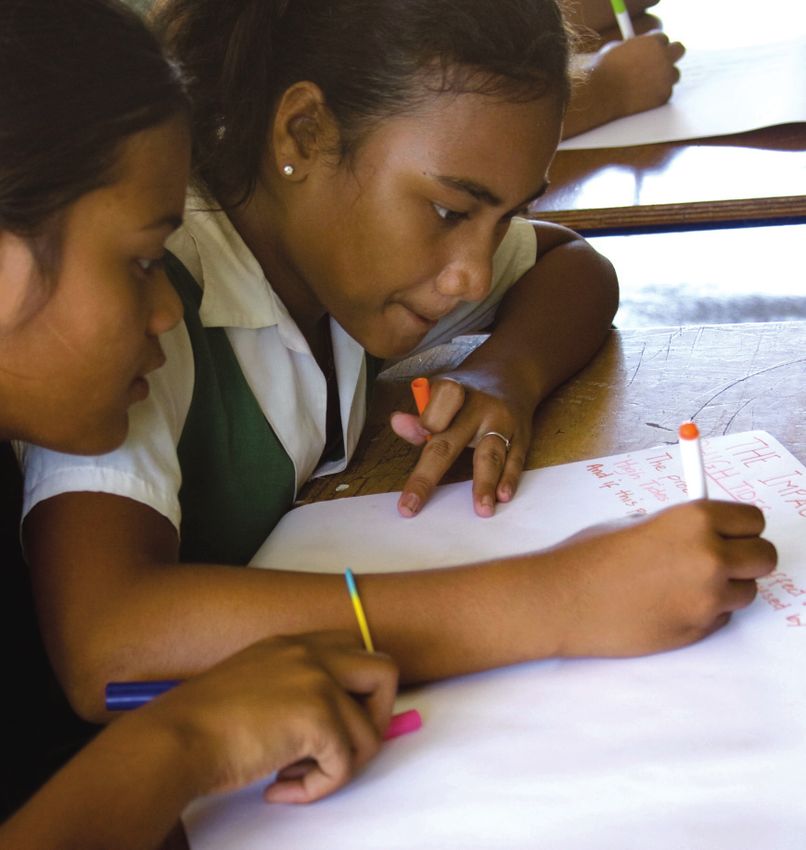
children have been involved or prioritized in Children’s workshops
policy processes.2 In the content analysis, each Two workshops (with 10 children in Kiribati
policy was reviewed for the occurrences of and 15 in Vanuatu) were organized through
‘child’, ‘children’ and ‘youth’; see table 10 for NGOs, schools and government agencies as
the synthesis of adaptation policy efforts in part of the participatory approach to better
the Pacific. understand the views of children and youth.
Information was also obtained from
The desktop research also was used to schoolchildren at a state college in Vanuatu
establish the context of the study (country- (Malapoa College), although the information
specific demographics and climate data) and to was obtained by the school at a separate study
review academic literature associated with period without the researchers present (30
climate change impacts for children in students aged 16–17). Multiple methods were
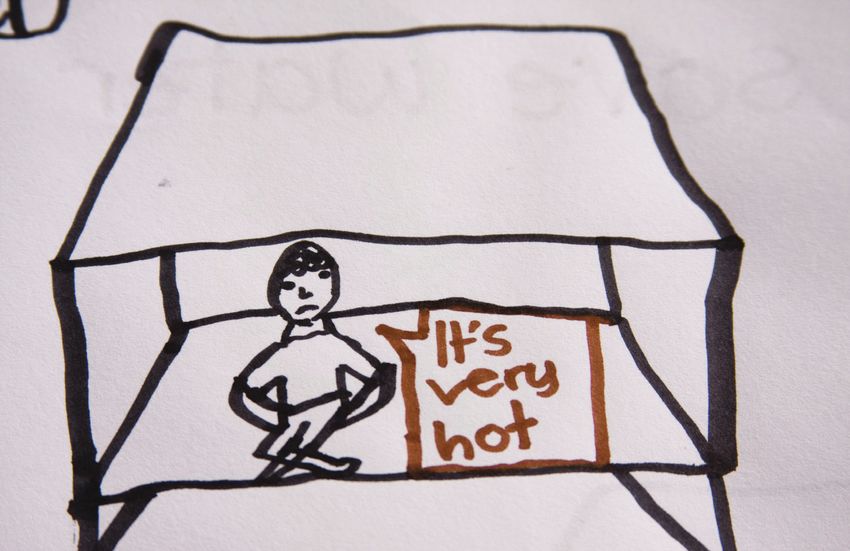
developing countries. used during the workshop, including
discussion, drawing and presentations. Such
interactive methods allow children to innovate
2.2 Field visits and express themselves and create a more
participatory and child-friendly approach
Two of the researchers made field visits to (Stephenson et al., 2004). The Vanuatu
Vanuatu (Efate) and Kiribati (North and South workshop consisted of children who did not
Tarawa) for seven days each to interview attend school, whereas the Kiribati workshop
government and NGO stakeholders and involved junior secondary school children. This
facilitate workshops for children. The fieldwork allowed further comparison between different
did not include any visits to outer islands in groups; children outside the school system
either country, which may bias the results in were also targets of interest for the study.
favour of urban and peri-urban issues. Although the workshops were with a limited
sample group (did not include children from
the outer islands), the exercise allowed for a
basic understanding of children’s perceptions
of possible solutions in terms of adaptation.
2
Due to the dimension and funding limitations of this study, only adaptation actions (NGO actions, regional partnerships) to gain
a scoping review of the national action programmes and a more comprehensive assessment of the consideration of
national communications to the UNFCCC was carried out. We children in adaptation planning.
recommend that a comprehensive review of all Pacific
2 Climate Change Impacts on Children in the Pacific: Kiribati and Vanuatu2.3 Climate change projections are based on two of the Intergovernmental
Panel on Climate Change (IPCC) storylines on
To explore the challenges that children in the emissions scenarios: A1FI and A1B (see
Pacific will likely face in 2050, future climate appendix 1 for an explanation of the IPCC
scenarios were established. Because only scenarios). See box 1 for explanation of
limited climate change projections for Kiribati climate scenarios.
and Vanuatu are publicly available, specific
climate change modelling was commissioned. A pattern-scaling process was applied, with the
Resource and time constraints restricted the global average temperature change as the
extent of the climate modelling to projections driver..3 This has been shown to be an effective
of average temperature and rainfall changes as approach to modelling future scenarios
well as extreme-event analysis for selected (Mitchell 2003; Li and Ye, 2011), although it is
sites in Kiribati and Vanuatu. The projections not without limitations (there is more
were also limited by the availability of local confidence in temperature than rainfall;
historical climate data. The climate change UNFCCC, no date). As well, high climate
modelling was accomplished using the sensitivity was also applied.
SimCLIM software platform designed by
CLIMsystems, which participated in this study. As well as the climate change modelling, this
The results presented in this paper are based study explored climate change projections
on an ensemble of 21 global circulation models presented in academic literature and country-
(published by Coupled Model Intercomparison specific studies, although there is very little
Project 3, 2011), which was used to calculate publically available (and current) information
the 25th, 50th and 75th percentiles from the projecting potential future climates in the
model outputs. The projections presented here Pacific region.4
3
“Pattern scaling offers the possibility of representing the whole global annual mean temperature change represented by the
range of uncertainties involved in future climate change same GCM at different spatial and/or temporal scales”
projections based on various combinations of emission (Li and Ye, 2011, p.229).
scenarios and general circulation models (GCM) outputs, which 4
Climate sensitivity is a measure of how much the Earth’s
allows cross-model sensitivity analyses and uncertainty temperature may change in response to an imbalance in
examinations to be conducted easily…[it is]… based on the energy, called a ‘forcing’. Such forcings can stem from changes
theory that, first, a simple climate model can accurately in the composition of the atmosphere, the Earth’s albedo
represent the global responses of a GCM, even when the (reflective capacity) and solar energy. Forcing is typically
response is non-linear, and second, a wide range of climatic portrayed as an increase in temperature per unit, with a
variables represented by a GCM are a linear function of the doubling of CO2.
Climate Change Impacts on Children in the Pacific: Kiribati and Vanuatu 3Box 1: Creating climate change scenarios
Climate change scenarios are descriptions of future climatic conditions for a given region
and time compared against baseline data (for example, the Pacific region in 2050 relative
to the 1961–1990 average). To create scenarios, scientists use mathematically created
climate change models (often referred to as general circulation models, or GCMs), which
are “intended to simulate the many emergent phenomena of the global circulation by
starting from fundamental physical principles that apply on small scales” (Randall, 2010:
2). The climate change scenarios are the range of outputs generated.
Because greenhouse gases5 are a primary driver of climate change, global emissions must
be considered in climate models. However, forecasting these emissions is challenging due
to the uncertainty surrounding future global population growth, technological innovation
and uptake of renewable energies. To account for this uncertainty, narratives were
developed by the IPCC that “combine two sets of divergent tendencies: one set varies its
emphasis between strong economic development and strong environmental protection;
the other set varies between increasing globalization and increasing regionalization”
(Lu, 2006: 21).
The most widely used reference for climate change projections are those provided in the
IPCC Special Report on Emission Scenarios (SRES), published in 2000. The IPCC presents
four scenarios based on possible future emissions up to 2100. The SRES scenarios are
grouped according to four development ‘storylines’ (A1, A2, B1 and B2), with each carrying
different assumptions on economic growth, the availability of technology, governance
structures, energy sources and greenhouse gas emissions. The A1 storyline reflects rapid
economic growth, high population growth that peaks in mid century and the introduction
of new and more efficient technologies. A1 is divided into three subcategories that reflect
the extent of technological change: fossil intensive (A1FI), non-fossil energy resources
(A1T) and a balance across resources (A1B). A2 reflects a high population growth, slow
economic development and slow technological change. B1 reflects the same population
as A1 but with more substantive changes in the global economy towards services and an
information economy. B2 reflects a storyline of intermediate population and economic
growth, with greater emphasis on economic, social and environmental sustainability
(IPCC, 2007).
Although GCMs are the best tool available to project future climate scenarios, they are not
without limitations, including “uncertain representation of clouds and a limited ability to
reproduce El Niño-Southern Oscillation (ENSO) type phenomena, which reduces
confidence in the magnitude and timing of projected climate changes, especially at
regional scales” (Lu, 2006). Other uncertainties surround the level of greenhouse house
gas emissions not yet emitted and the downscaling of GCMs (UNDP, 2011).
5
Atmospheric concentrations of CO2 – and of greenhouse gases molecules of dry air. In addition to carbon dioxide, the major
in general – are measured in parts per million (ppm), referring anthropogenic greenhouse gases are ozone, methane, nitrous
to the number of greenhouse gas molecules per million oxide, halocarbons and other industrial gases (IPCC, 2007).
4 Climate Change Impacts on Children in the Pacific: Kiribati and Vanuatu3. Study-region context
3.1 Kiribati geographic and 3.2 Vanuatu geographic and
socio-economic context socio-economic context
Kiribati consists of 33 coral atolls distributed The Republic of Vanuatu is home to
across an exclusive economic zone of 3.6 million approximately 240,000 people spanning more
square kilometres of the Pacific Ocean. The than 100 language groups, with the majority (78
estimated population of 100,000 is dispersed per cent) living in rural areas (SPC, 2008). Unlike
across 32 atolls and one solitary island. Although Kiribati, most of the more than eighty islands in
it has a relatively small population, Kiribati is the archipelago are elevated and prone to
experiencing considerable urbanization in South tectonic movement. According to United Nations
Tarawa (the nation’s capital), which is home to categorizing, Vanuatu is the country most at risk
approximately 40 per cent of the population. For of natural disasters, with volcanoes,
example, the town of Betio in South Tarawa is earthquakes, tsunamis and cyclones relatively
one of the most densely populated single-storey common occurrences (UNU-EHS, 2011). Vanuatu
settlements in the World, housing approximately is much less densely populated than Kiribati,
6600 people per square kilometre. Excluding with an estimated 19 people per square kilometre
South Tarawa the rest of Kiribati predominantly (SPC, 2008). However, high urban growth is still
consists of rural or village settlements, in which experienced in parts of Vanuatu, particularly in
the population lives a traditionally subsistence Port Vila (population 27,929) and Luganville
lifestyle with a limited cash economy (UNICEF, (population 10,650). Both towns have large
2005a). The country has experienced communities and informal urban settlements
considerable population growth in the past just outside the town boundaries (UNICEF,
decade and is projected to reach 125,000 by 2025 2005b: 3).
(UNICEF, 2005a).
Vanuatu’s economy is dominated by agriculture
Kiribati is one of the poorest countries in the (beef and copra), although its tourism sector has
Pacific with minimal land-based natural seen also seen considerable growth in the past
resources and is heavily reliant on imported few years (SPC, 2008).
fossil fuels for its energy and transportation
needs. Kiribati is classed as a least developed Vanuatu is a least developed country, with a GDP
country by the United Nations (UN, 2008), with a of US$685 million in 2009 (World Bank, 2011)
gross domestic product (GDP) in 2009 of US$173 and approximately a quarter of the population
million. The majority of Kiribati’s economic lives on less than US$1 per day (UNICEF, 2005b).
activity is generated from fishing licenses,
fishing and copra plantations, remittances and In Vanuatu, children younger than 18 years make
foreign aid (UNICEF, 2005a; IMF, 2011). up 45 per cent of the total population and face
There are numerous challenges confronting myriad challenges, including risks ranging from
children in Kiribati. These include a high extreme natural events to exposure to vector-
mortality rate for those younger than 5 years borne illnesses (such as dengue fever and
(37 per 1,000 births); a high percentage of malaria). According to the World Bank (2011), the
malnutrition (more than 11 per cent of children mortality rate for children younger than 5 years
are underweight); and limited access to is 14 per 1,000 births and the proportion of
sanitation (31 per cent of the population) and children suffering malnutrition is similar to
safe drinking water (45 per cent of the Kiribati (with more than 11 per cent of children
population) (World Bank, 2011). underweight). Although higher than in Kiribati,
only 51 per cent of the Vanuatu population has
access to good sanitation facilities.
Climate Change Impacts on Children in the Pacific: Kiribati and Vanuatu 53.3 Existing climate and climate drivers particularly in the years after the onset of
El Niño” (Mimura et al., 2007: 691).
The climate of the Pacific Islands is strongly
influenced by the South Pacific Convergence The climate of Vanuatu can be described as a
Zone, the Intertropical Convergence Zone and “tropical maritime climate with characteristic
the West Pacific Monsoon.6 Each of these is uniform temperature, high humidity and variable
affected by the El Niño Southern Oscillation rainfall. Winds are generally light except during
(ENSO), which can “alter the strength and a tropical storm” (Vanuatu Meteorological
position of the Intertropical Convergence Zone Services, 2007). The climate in Kiribati is also a
and the South Pacific Convergence Zone and the maritime climate with relatively uniform
timing of the monsoon” (Pacific Climate Change temperatures throughout the year.
Science Program, 2010).
The rainfall varies geographically and is greatly
Historical data shows that the climate in the affected by the ENSO. Although Vanuatu has
Pacific is warming (figure 1) and the sea levels similar wet and dry seasons, the influence of the
are rising (Pacific Climate Change Science ENSO is more pronounced in Kiribati. Furthermore,
Program, 2010). As described in the most recent Vanuatu has a strong temperature variability
IPCC report, “trends in extreme temperature compared with Kiribati’s relatively consistent
across the South Pacific for the period 1961 to seasonal temperatures. Because Vanuatu has
2003 show increases in the annual number of mountainous regions, areas can experience
hot days and warm nights, with decreases in the orographic patterns, with more rain falling on
7
annual number of cool days and cold nights, the windward side of the islands (table 1).
Figure 1: Change in the Pacific region’s annual mean surface temperature, compared with
a 1961–1990 base period (120°E-150°W; 25°S-20°N).
Note: The solid line indicates an 11-year running mean, based on the Climatic Research Unit/Hadley Centre global-gridded
surface temperature data (Pacific Climate Change Science Program, 2010).
6
The South Pacific Convergence Zone, the Intertropical 7
“The classic picture of orographic precipitation is of a mountain
Convergence Zone and the West Pacific Monsoon are names range in the mid latitudes whose axis lies perpendicular to the
given to natural fluctuations that occur in the region. More prevailing wind direction. In the climatological average, the
information about these fluctuations can be found at the World windward flank of the mountain range receives much more
Meteorological Organization (http://www.wmo.int/pages/ precipitation than the leeward flank, resulting in the well-known
themes/climate/significant_natural_climate_fluctuations.php) rain shadow that is reflected in sharp transitions in climate,
flora and fauna across the divide” (Roe, 2005, p. 645).
6 Climate Change Impacts on Children in the Pacific: Kiribati and VanuatuTable 1: Summary of Vanuatu and Kiribati climate variability
Vanuatu Kiribati
Wet season November–April November–April but rains all year
round
La Niña Dry, slight increase in tropical cyclones Very dry
El Niño Wet Very wet
Temperature Strong temperature variability Very weak temperature variability,
variability controlled by sea surface temperatures controlled by sea surface temperatures
and extra-tropical air masses
Rainfall variability Variable – local variation controlled by Variable, depending on ENSO and
orographic rainfall geographic location of islands
The availability of validated historical data The baseline data shows that for Lamap,
determined the selection of locations to Vanuatu, generally the hottest months occur
analyse, which was thus limited to South during January, February and March; for
Tarawa in Kiribati and Lamap in Vanuatu. Tarawa, Kiribati, they occur in September
However, due to the large geographic expanse through November and for Kiritimati, in May
of Kiribati,8 Kiritimati Island was also included through July.
in the analysis. The validated historical data
was used to create the 1961–1990 baseline
(tables 2 and 3).
Table 2: Average daily maximum temperatures in selected sites (warmest months in bold),
1961–1990
Location Jan Feb Mar Apr May Jun Jul Aug Sep Oct Nov Dec
Lamap,
30.6 30.7 30.5 29.9 28.6 27.9 27.3 27.3 27.9 28.6 29.5 30.2
Vanuatu
South
Tarawa, 30.7 30.6 30.5 30.9 31.1 30.8 30.8 30.9 31.2 31.5 31.1 30.8
Kiribati
Kiritimati,
29.3 29.3 29.5 29.8 30.1 30.3 30.1 30.1 30.1 29.9 29.7 29.6
Kiribati
Note: Daily maximum temperatures were averaged to provide a monthly figure, then averaged across the 1961-1990 period.
Identification of the warmest season is done by calculating the long-term monthly norms for the daily maximum temperatures
(°C) from historic observations (CLIMsystems, 2011). Lamap and Tarawa were determined by the availability of validated
historical data.
8
The Republic of Kiribati entails 32 atolls and one raised coral
island, amounting to 811 square kilometres spread across
3.5 million square kilometres.
Climate Change Impacts on Children in the Pacific: Kiribati and Vanuatu 7Table 3: Monthly baseline precipitation (wettest months in bold) Station Jan Feb Mar Apr May Jun Jul Aug Sep Oct Nov Dec Lamap 246 229 270 210 148 132 95 80 76 134 129 134 Tarawa 223 206 178 155 154 160 150 144 110 144 132 181 Note: Identification of the wettest season is done by calculating the long-term monthly average for the daily maximum rainfall (millimetres) for historic observations (CLIMsystems, 2011). For Kiritimati, insufficient rainfall data is available. The above are averages and do not represent seasonal or decadal climate variability. 8 Climate Change Impacts on Children in the Pacific: Kiribati and Vanuatu
4. Climate change modelling
The following projections provide the basis for                              dominant El Niño events and decreased El Niño
the climate scenario presented in this paper. The                            events (Lin, 2007). This paper relies on the range
projections carry varying degrees of uncertainty                             of projections from an ensemble of 21 climate
that are associated with climate change models,                              models using the upper end of the IPCC’s global
including:                                                                   greenhouse gas emissions (the A1FI scenario)
                                                                             (see box 1). Further data created in the climate
      “uncertainties in future emissions of                                  change modelling for this study is located in
      greenhouse gases (GHGs), uncertainties in                              appendix I.
      converting emissions to GHG concentrations;
      uncertainties in converting concentrations to
      radioactive forcing, uncertainties in modelling                        4.1     Projections for average temperature
      climate response to a given forcing and                                		      and rainfall
      uncertainties in converting model response
      into inputs for impact”                                                The results of the modelling created for this
      (Lu and Hulme, 2002: 1).                                               study show that both the case study countries
                                                                             will experience a lower increase in their
There is also uncertainty associated with                                    maximum temperature than the global average,
capturing feedback (such as the ability to                                   projected to be 2.7°C by 2050. The highest
consider issues like water vapour and warming                                increase will be experienced in Kiritimati: by
in models; Christensen, 2007). Currently, the                                2050, under the IPCC A1FI high-sensitivity
body of literature on climate change has widely                              scenario (box 1), the temperature increase (from
varying analyses about the impact of the ENSO                                the 1961–1990 baseline) is projected to be
phenomenon, with differing modelling                                         between 2°C and 2.4 °C, with the mean of the
projecting different results, including                                      models – the 50th percentile – at 2.1°C (table 4
amplification of impacts, shifts in variability,                             and figures 2 and 3).9

Table 4:         Results of climate change modelling relative to the 1961–1990 average

                              A1Fl – High emissions scenario (2050)                         A1B – mid emissions scenario (2050)
                               (ºC change relative to 1990 average)                         (ºC change relative to 1990 average)
                             25th                  50th               75th                 25th                 50th                75th
                           percentile            percentile         percentile           percentile           percentile          percentile
                           of model              of model           of model             of model             of model            of model
                            results               results            results              results              results             results
    Lamap                      1.7 ºc                1.9 ºc             1.9 ºc              1.0 ºc               1.1 ºc               1.1 ºc

    Tarawa                     1.9 ºc                2.1 ºc             2.2 ºc              1.1 ºc               1.2 ºc               1.3 ºc

    Kiritimati                 2.0 ºc                2.1 ºc             2.4 ºc              1.2 ºc               1.2 ºc               1.4 ºc

Note: The range of the models is presented in each cell, with the middle figures (highlighted) indicating the mean results of
the 21 GCMs (the 50th percentile). The global temperature change is 2.7°C under the A1FI scenario and 1.58°C under the A1B
scenario (see box 1 for explanations).

9
    A high impact scenario was chosen to explore the worst-case
    scenario. Resource constraints for this study have limited an
    exploration of all IPCC scenarios and sensitivities.

                                                                    Climate Change Impacts on Children in the Pacific: Kiribati and Vanuatu    9
Figure 2: The spatial pattern of change (by 2050, A1FI-high, 21-GCM ensemble) for Tarawa
(top image) and Kiritimati (lower image). Global average change is a projected 2.7°C.
Figure 3: The spatial pattern of temperature change (by 2050, A1FI-high, 21-GCM ensemble)
for Vanuatu (global average change is 2.7°C)
The climate change projections for average increase (with little difference between the A1FI
rainfall in each of the two countries cover a and the A1B scenarios). In Kiribati, although all
broad range of future climates. The models models show an anticipated increase in rainfall,
show that the projections for precipitation in the extent of model results is quite variable
Lamap, Vanuatu, during the wettest months (Tarawa shows between 4 per cent and 51 per
range from a 3 per cent decrease to a 12 per cent cent increase). There is also a reasonable spread
increase, with the 50th percentile at a 2 per cent between the A1FI and the A1B scenarios (table 5).
10 Climate Change Impacts on Children in the Pacific: Kiribati and VanuatuTable 5: Projected precipitation by 2050 for Kiribati and Vanuatu, relative
to the 1961–1990 average
A1FI – High emissions scenario (2050) A1B – mid emissions scenario (2050)
(% change relative to 1990 average) (% change relative to 1990 average)
25th 50th 75th 25th 50th 75th
percentile percentile percentile percentile percentile percentile
of model of model of model of model of model of model
results results results results results results
Lamap -3 % 2% 12 % -2 %c 1% 71 %
(J, F, M)
Tarawa 4% 26 % 51 % 2% 15 % 30 %
(D, J, F)
Kiritimati
(D, J, F) 17 % 23 % 70 % 10 % 19 % 41 %
Note: The range of the models is presented in each cell; the middle figures in parenthesis indicate the
median results of the 21 GCMs (the 50th percentile).
4.2 Projections for extreme Extreme heat events will occur more often and
temperature and rainfall will be hotter as a result of climate change.
The results show that for Tarawa, the historic
Anticipated climate change effects for extreme highest extreme of 39.3°C has a return period
temperature and rainfall were also explored. of 46 years. By 2050, under the A1FI high-
The climate change effect for extreme events is impact scenario, that highest extreme could
expressed in two ways: first, the change in the increase to between 41.2°C and 41.8°C (with a
most extreme value (what could the current 50-year return period), while the return period
most extreme event become under climate for 39.3°C could be shortened to 1 in 20 years.
change), and second, the change in the return For Lamap, Vanuatu, the return period for the
period for the most extreme event currently current extreme temperature declines
observed (what could the return period for the dramatically, from every 39 years to every 2
current most extreme event become under years (table 6).
climate change). Due to historical data
limitations, Kiritimati was not included in the
extreme-event modelling.
Table 6: Changes to daily maximum temperatures, based on the A1FI scenario
(three-day average), currently and 2050 projections
Location Current Return period 2050 extreme Return period by
extreme (°C) (years) (°C) 2050
(years)
Lamap 33.4 39 35.0 (35.3) 35.3 2
Tarawa 39.3 46 41.2 (41.5) 41.8 20
Climate Change Impacts on Children in the Pacific: Kiribati and Vanuatu 11Figure 4: Lamap, Vanuatu, daily maximum (three-day average) temperature-return period
projection, based on the A1FI scenario (mean results of the 12 GCMs (the 50th percentile)
100
50
Return Period (year)
20
10
5
2
33.5 34 34.5 35 35.5
Extreme high maximum temperature (oc)
Figure 5: Tarawa, Kiribati, daily maximum (three-day average) temperature-return period
projection, based on the A1FI scenario (mean results of the 12 GCMs (the 50th percentile)
100
50
Return Period (year)
20
10
5
2
34 36 38 40 42 44
Extreme high maximum temperature (oc)
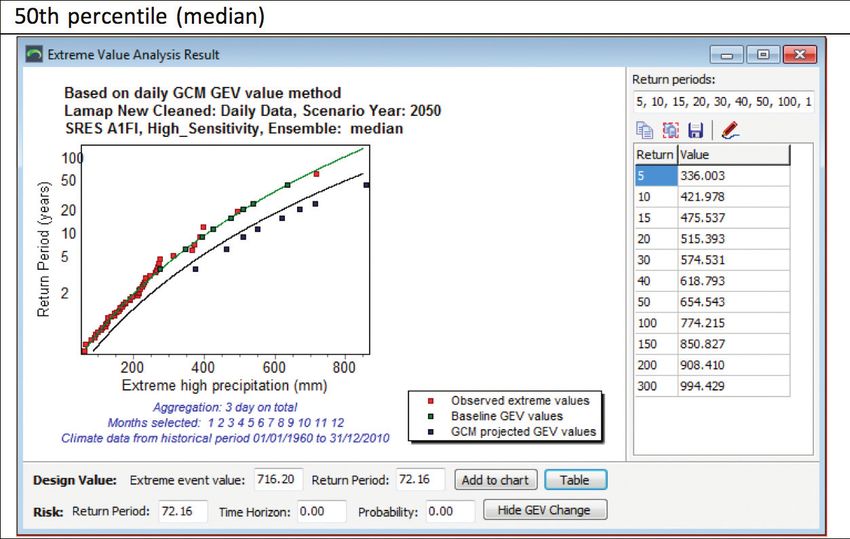
The results from the rainfall modelling show 820 and 980 millimetres, and the current 716
that Vanuatu will experience the highest millimetres event could occur every 72 years
anticipated change in extreme events. For (figure 6). In Tarawa, the return period for the
Lamap, the historical heaviest rainfall of 716 three-day extreme shifts from 300 years to a
millimetres in three days has a return rate of 1-in-43-year event (figure 7). Put simply, there
168 years. By 2050 (under the A1FI high-impact is likely to be an increase in the number of
scenario), this event could increase to between extreme events and heavier rainfalls.
12 Climate Change Impacts on Children in the Pacific: Kiribati and VanuatuFigure 6: Projected changes to the three-day extreme rainfall (A1FI high-impact scenario) in
Lamap, Vanuatu, relative to the 1961–1990 average
Three-day sxtreme
rainfall (mm)
Note: The arrows show the projected shifting of the return periods (the historical 1-in-100-year event will
shift closer to a 1-in-15-year event).
Figure 7: Figure 7: Projected changes to three-day extreme rainfall (A1FI high-impact scenario)
in Tawara, Kiribati, relative to the 1961–1990 average
Three-day total extreme
rainfall (mm)
Note: The arrows show the projected shifting of the return periods (the historical 1-in-100-year event will
shift closer to a 1-in-15-year event).
Climate Change Impacts on Children in the Pacific: Kiribati and Vanuatu 134.3 Projections for sea level rise can be considerably higher than the average
local sea level. Under increasing climate-
Although no sea level rise modelling was done induced sea level rise, the occurrence of
for this study, a number of global studies extreme tide events is projected to increase.
present alarming possibilities for the Pacific Average temperatures in the Pacific are
Island nations. There is little publicly available projected to increase by 0.5°C–0.8°C by 2035
information on sea level rise projections for the and 2.5°C–3°C by 2100, under a high emissions
Pacific (or for Kiribati and Vanuatu). The global scenario relative to the 1980–1999 period
sea level rise projections have shifted (Rodgers, 2009).
considerably over time, with the 2007 IPCC
report stating an anticipated global sea level Currently, the sea level rise trend for Kiribati is
rise ranging from 18 to 59 centimetres (IPCC, 3.9 millimetres per year (1992–2010) and for
2007). However, more recent literature cites Vanuatu it is 5.6 millimetres per year (1993–
more alarming projections, with a sea level rise 2009) (AusAID, 2007). The Vanuatu National
between 75 and 190 centimetres by 2100 Adaptation Programme of Action refers to
perceived as possible (based on the 1961–1990 modelled sea level rise results of more than 50
average; Vermeer and Rahmstorf, 2009). centimetres by 2100. The data used for that
projection is not available. The Kiribati
The projections for the Pacific are expected to Adaptation Plan uses a sea level rise of +6
follow the global trend. Of course, sea levels centimetres to +26 centimetres by 2050 for its
are not static and naturally fluctuate over time, adaptation planning. It is likely that both
and in the Pacific there is considerable Kiribati and Vanuatu have used models from
variability “associated with the El Niño- the IPCC AR4 scenario as the source for their
Southern Oscillation, the Asian–Australian projections. This may mean that the sea level
monsoon and phenomena like the North rise planning (which does not consider the
Pacific Decadal Oscillation” (Church et al., recent higher projections) are not adequate.
2006: 157). This is especially evident during
abnormally high tides (such as king tides) that
14 Climate Change Impacts on Children in the Pacific: Kiribati and VanuatuTable 7: The net relative sea level trend estimates as of December 2009, after the inverted
barometric pressure effect and vertical movements in the observing platform
are taken into account
Location Installed Sea level Barometric Vertical tide Net sea
trend (mm/yr) pressure gauge level trend
contribution movement (mm/yr)
(mm/yr) contribution*
(mm/yr)
Cook Islands 19/02/1993 5.3 0.0 +0.7 4.6
Federated 17/12/2001 16.7 -0.5 +0.4 16.8
States of
Micronesia**
Fiji 23/10/1992 5.7 0.8 -0.6 5.5
Kiribati 02/12/1992 4.3 0.4 -0.0 3.9
Marshall 07/05/1993 3.8 0.1 +0.5 3.2
Islands
Nauru 07/07/1993 5.2 0.5 +0.2 4.9
Papua New 28/09/1994 7.4 1.5 +0.0 5.9
Guinea
Samoa 26/02/1993 5.7 0.2 +0.9 4.6
Solomon Islands 28/07/1994 7.8 -0.2 +0.3 7.7
Tonga 21/01/1993 9.5 0.5 +0.4 8.6
Tuvalu 02/03/1993 5.1 0.3 +0.1 4.7
Vanuatu 15/01/1993 6.5 1.0 -0.1 5.6
*The contribution is the inverse rate of vertical tide gauge movement.
**The sea level trend at Federated States of Micronesia is derived from a comparatively short data record.
Source: AusAID, 2009: 12
Climate Change Impacts on Children in the Pacific: Kiribati and Vanuatu 155. Potential climate change impacts on children
in the Pacific
Attributing the causality of health issues to volcanic activity and recent cyclones) as well
climate change impacts is a complex and still as food and water security were considerable
emerging field (Sheffield and Landrigan, 2011). factors pushing people away from the outer
Nonetheless, globally more than 150,000 islands: Many people had moved from outer
deaths in 2000 were attributed to climate- islands into squatter settlements on the
related disease, with the largest proportion of outskirts of Port Vila, for example. As
them among children younger than 5 years squatters, they did not own the land they
(Patz et al., 2007). The majority of the literature resided on, they had no authority to plant
on children’s exposure to the effects of climate crops and thus needed to find income-earning
change centres around health impacts, options to obtain food and pay for their
including disease, vector-borne illnesses, children’s education.
nutrition and extreme events (McMichael et al.,
2003; Patz et al., 2007). As described by Tillet In Kiribati, the urbanization of South Tarawa
(2011), “children are inherently sensitive to the was described by one person as the
climate because they are physiologically and “foundation of its many challenges”. The
metabolically less effective than adults at respondent noted that although Tarawa
adapting to heat and other climate-related exceeded its carrying capacity, growth still
exposure”. This chapter draws on anecdotal continued unchecked. Respondents introduced
evidence obtained from qualitative interviews, a range of reasons for the shift of outer
the academic literature and climate change islanders to Tarawa, including access to
modelling to discuss the potential impacts on education and employment as well as a
children in the Pacific. reduced desire to live a subsistence lifestyle.
According to one respondent from Vanuatu,
education is so important that:
5.1 Context-specific issues:
urbanization in the Pacific “Some families lease their land for
developers in order to pay for school fees,
Although people living in the Pacific Islands which in turn reduces the land available for
have historically managed with extreme subsistence farming and other livelihood
weather, the challenges presented by climate activities.”
change, combined with other issues, such as
urbanization, are likely to introduce a range of The alternative to paying for education in
new impacts as well as exacerbate existing Vanuatu was to send the children to the outer
challenges. islands where the education is free. An
interviewee stated that doing this raised other
Most of the stakeholders interviewed in the challenges:
field studies stated that Kiribati and Vanuatu
were experiencing rapid urbanization. Vanuatu “To get free education offshore the child
has in fact been characterized as an ‘unfinished may need to stay with extended family, who
state’, which partly struggles amid multiple they may not even know, and be exposed to
socio-economic and institutional drivers of sexual abuse. It does happen.”
change; increasing urbanization and
transformation from rural lifestyles towards In Kiribati, although education opportunities
formal economy are among the key issues are free in the outer islands, they are very
(Cox et al., 2007). limited and mainly focused on South Tarawa.
A respondent also stated that the educational
In Vanuatu, there seemed to be an system “proceeded rather fast” and children
understanding by most of the interviewed would drop out from school if they fell behind
respondents that natural perils (such as in their studies. It was also noted that many
16 Climate Change Impacts on Children in the Pacific: Kiribati and Vanuatuchildren in Kiribati could not afford to take • There is a broad range of variability within
lunch with them to school, and there was the climate models (as described previously).
concern that this may impact on their ability
to learn. • There is a significant lack of historical data.
Any gaps in historical data can alter the
Although school attendance is considered an mean and erode the understanding of a
important element of day-to-day life, four region’s climate. This reduces the ability of
respondents (two from each country) stated undertaking regional downscaling
that education often did not override a child’s effectively. Data availability has also been
domestic responsibilities at home. For noted by Church et al. (2006) as an issue for
example, in Vanuatu, children miss school projecting sea level rise impacts.
because they have to find and fetch water for
their families. As well as general domestic • Often impacts are the result of a
duties, children were expected to help clean up combination of climate and non-climate
after natural disasters. One interviewee in stressors (such as increased temperature as
Vanuatu noted: well as increased rainfall, urbanization and
economic, social and cultural influences).
“After an extreme event many children stay
at home to help their parents to replant farms • There is considerable uncertainty
and clean up…[and]… some schools close surrounding the response of the natural
because getting to school is difficult due to environment to multiple stressors
damage to roads and other infrastructure and associated with climate change. This limits
services.” the ability to identify subsequent impacts
(such as shifting vectors, new diseases and
food stocks).
5.2 Specific climate change challenges
Although these issues need to be considered,
The types of impacts confronting children there is sufficient empirical evidence across a
living in Kiribati and Vanuatu are diverse. They range of fields to suggest that there are some
range from direct physical impacts, such as potential climate-related challenges for
cyclones, storm surges and extreme children in the Pacific.
temperatures presenting risks to human health
and assets, to more subtle challenges that at It is hoped that the modelling presented in this
first may be difficult to identify (such as paper will help support other climate change
impacts on education, psychological well- studies in Kiribati and the Pacific. A composite
being and nutritional status). of climate-related risks present both Kiribati
and Vanuatu with considerable challenges over
The following information presents the the coming decades. These will no doubt be
possible challenges of direct and indirect exacerbated by existing and future non-climate
impacts on children as a result of climate stressors (e.g. urbanization). The modelling
change. Information on the potential risks presented in this report supports the
from climate change and associated strategies anticipation that both Kiribati and Vanuatu are
(table 8) are included. Although not widely likely to see reasonable increases in average
considered, poorly managed adaptation temperature as well as considerable changes
actions also have the potential to have to the return rate and magnification of extreme
negative impacts on children, which is why temperatures and rainfall events. Given the
considerable care needs to be exercised when uncertainty associated with the modelling,
planning for adaptation. however, it is difficult to clearly identify the
geographic and temporal spread of changes to
Although this discussion presents a broad average rainfall.
array of climate change-related risks, the ability
to ascertain likelihoods are problematic due to The potential impacts of climate change on
the following reasons: children in the Kiribati and Vanuatu relate to
the following themes:
Climate Change Impacts on Children in the Pacific: Kiribati and Vanuatu 17You can also read