The UAE State of Climate Report - A Review of the Arabian Gulf Region's Changing Climate & Its Impacts
←
→
Page content transcription
If your browser does not render page correctly, please read the page content below

The UAE State of Climate Report
A Review of the Arabian Gulf Region’s
Changing Climate & Its Impacts

2021

www.moccae.gov.ae
The UAE State of Climate Report:
A Review of the Arabian Gulf Region’s
   Changing Climate & Its Impacts

                2021
Table of Contents
1. Executive Summary                            07
2. Introduction                                 10
3. Climate Projections for the UAE & the Gulf   13
   Temperature                                  15
   Precipitation                                19
   Seawater – Temperature, Salinity & pH        22
   Sea Level Rise                               24
   Extreme Weather Events                       25
4. Sectoral Impacts of Climate Change           27
   Infrastructure                               28
   Public Health                                30
   Water & Agriculture                          31
   Ecosystems                                   32
5. Conclusion & Way Forward                     35
6. References                                   36

                                                     3
List of Figures & Tables
Figure 1: Summary of modeled projections for different climate properties in the UAE and surrounding region   14
Figure 2: Change in the UAE surface temperature relative to 1951-1980                                         16
Figure 3: Historical rainfall trends recorded at airport weather stations in the UAE                          20
Figure 4: Accumulated cyclone energy (ACE) over the Arabian Sea for the period 1979-2008                      27
Figure 5: Summary of the key sectoral impacts of climate change in the UAE                                    29
Figure 6: Modeling approaches used to assess terrestrial biodiversity’s vulnerability to climate change       33

Table 1: Summary of UAE temperature projections                                                               17
Table 2: Summary of projected warming by 2095                                                                 18
Table 3: Summary of seasonal temperature increase projections for the Arabian Peninsula                       19
Table 4: Projected warming in the Arabian Peninsula using CMIP6 models                                        19
Table 5: Summary of projections for precipitation changes by 2095                                             21
Table 6: Projections of precipitation changes in the Arabian Peninsula using CMIP6 models                     22
Table 7: Summary of the corrected tidal gauge station results                                                 25

                                                                                                                   4
Acronyms
ACE		        Accumulated Cyclone Energy
ADW		        Angular Distance Weighting
AGEDI		      Abu Dhabi Global Environmental Data Initiative
AOGCM		      Atmosphere-Ocean General Circulation Model
AR5		        Fifth Assessment Report
ARIMA		      Autoregressive Integrated Moving Average
CCSM4		      Community Climate System Model (Ver. 4)
CESM		       Community Earth System Model
CMCC-CM      Centro Euro-Mediterraneo sui Cambiamenti Climatici Climate Model
CMIP		       Coupled Model Intercomparison Project
CNRM		       Centre National de Recherches Météorologiques
COSMO-CLM    Consortium for Small-scale Modeling in Climate Mode
CRU		        Climate Research Unit
DBS		        Distribution-Based Scaling
EAD		        Environment Agency – Abu Dhabi
EBM		        Energy Balance Model
ECMWF		      European Centre for Medium-Range Weather Forecasts
ENSO		       El Niño-Southern Oscillation
ESCWA		      United Nations Economic and Social Commission for Western Asia
ESM		        Earth System Model
FAO		        Food and Agriculture Organization of the United Nations
GCM		        General Circulation Model/Global Climate Model
GFDL		       Geophysical Fluid Dynamics Laboratory
GHG		        Greenhouse Gas
GIA		        Glacial Isostatic Adjustment
GMST		       Greenwich Mean Sidereal Time
GNSS		       Global Navigational Satellite System
GPS		        Global Positioning System
HIRLAM		     High-Resolution Limited Area Model
ICE-5G VM4   Ice Sheet Reconstruction Glacial Isostatic Model
IPCC		       Intergovernmental Panel on Climate Change

                                                                                5
Acronyms
ITCZ 		     Intertropical Convergence Zone
LNRCCP 		   Local, National, and Regional Climate Change Program
MAGICC		    Model for the Assessment of Greenhouse Gas-Induced Climate Change
MENA		      Middle East and North Africa
NASA		      National Aeronautics and Space Administration
NCAR		      National Center for Atmospheric Research
NCEP		      National Centers for Environmental Prediction
NOAA		      National Oceanic and Atmospheric Administration
POD		       Proper Orthogonal Decomposition
PSMSL		     Permanent Service for Mean Sea Level
PSU		       Practical Salinity Units
RCP		       Representative Concentration Pathway
RCA4		      Rossby Centre Regional Atmospheric Model
RCM		       Radiative Convective Model
SCENGEN     Regional Climate SCENario GENerator
SEI			      Stockholm Environment Institute
SRES		      Special Report on Emissions Scenarios
SRH		       Storm-Relative Helicity
SSP			      Shared Socio-Economic Pathways
SST			      Sea Surface Temperature
TG			       Tidal Gauge
TS			       Time Series
UAE		       United Arab Emirates
UHI		       Urban Heat Island
UNDP		      United Nations Development Programme
UNFCCC		    United Nations Framework Convention on Climate Change
WFM		       Weather Forecast Model
WHO		       World Health Organization
WRF		       Weather Research and Forecasting

                                                                                6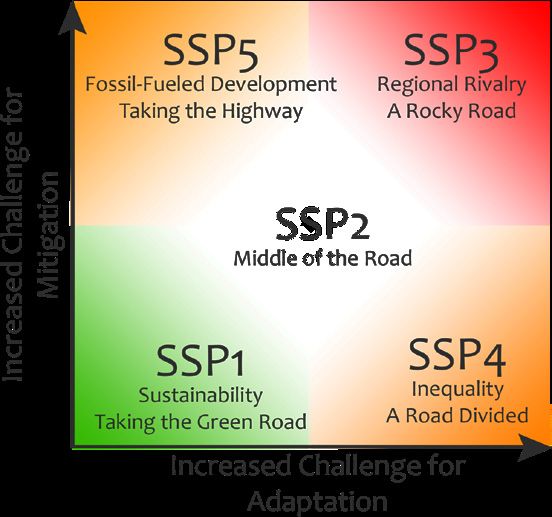
1. Executive Summary
Climate change is one of the most critical challenges the world faces today. In light of the climate impacts being experienced
globally, systematic climate data collection and modeling as well as climate risk assessment have emerged as priority areas of
research. The resultant global studies and analyses have yielded and continue to yield relevant findings for the UAE and the
wider Arab region, while regional climate research and modeling is growing.

The purpose of this report is to review the results of research and modeling studies, and advance the understanding of the
Arab region’s changing climate and its impacts. Synthesizing key country-level and regional results, this report reviews
available findings on (1) observed and projected climatic changes in the UAE and the wider Arab region, and (2) critical
sectoral impacts of climate change. It acts as a summary of select major studies, encompassing changes in temperature,
rainfall, seawater properties, sea level rise, and extreme weather. With regard to climate risks and impacts, the report focuses
on infrastructure, public health, water and agriculture, and the environment.

A review of literature on the UAE and the region suggests that while some climatic projections are available, and future trends
can be discerned, gaps in climate data and knowledge remain, calling for more region-specific studies. Climate modeling in
the region has been sparse, and datasets and results are often difficult to compare, given differing assumptions, model
choices, study boundaries and timeframes. Often, there is a high degree of uncertainty in the models and their projections
due to limited data availability.

                                                                                                                                   7
Climate Change Projections
Studies focused on the UAE and the Arabian Peninsula global temperatures increase, ice mass loss in the
agree that average temperatures have risen and will Greenland and Antarctic ice sheets is expected to
continue to rise, even though the extent of the increase exacerbate sea level rise in the Gulf and elsewhere.
may differ across different parts of the Peninsula.
Projections for precipitation in the Arab region present a
Concomitantly, the surface water temperature in the
large uncertainty, and total average rainfall may either
Arabian Gulf will also rise, along with a smaller increase in
increase or decrease. It is indicated that rainfall may
the temperature of the deep waters of the Gulf (as heat
become less frequent, but the intensity of precipitation
does not travel well down the water column). In addition
events may increase.
to temperature, other seawater properties will also
register change. Seawater salinity and pH are projected to In addition to extreme temperatures, weather events
increase with increased water evaporation and higher such as droughts, sandstorms, and cyclones are a source
absorption of CO2, respectively. of concern due to their devastating impacts. Extreme
events such as hailstorms are expected to increase,
Sea level in the Arabian Gulf is expected to rise due to
especially in and around mountainous areas. Similarly,
deglaciation and thermal effects. Melting of ice caps and
cyclonic activity in the Arabian Sea is expected to
transfer of large amounts of ice to the water body of
increase in frequency as well as severity.
oceans is the biggest contributor to sea level rise. As
8Climate Impacts
Changes in the region’s climate are already impacting ecosystems. Decrease in freshwater availability implies
people and infrastructure. An understanding of these that more freshwater will need to be produced from
impacts is vital for building adaptive capacity and desalination of seawater, and hence the number and
enhancing climate resilience. Protecting lives and capacity of desalination plants in the UAE and the region
livelihoods as well as the gains of economic growth may need to increase to respond to freshwater
requires the integration of climate risks into development requirements. The agricultural sector, which in the Arab
planning at the outset. Gulf countries have made a start region depends highly on groundwater for irrigation, will
in assessing climate risks and associated impacts, and be particularly affected. In addition to water scarcity, the
defining adaptation plans to address them. As part of its sector will witness climate impacts on crop yields,
National Climate Change Adaptation Program, the UAE suitability of locations for farming of traditional plants
has undertaken climate risk assessments for four priority and crops, and livestock productivity and health.
sectors: energy, infrastructure, health, and the
Marine, terrestrial, and freshwater ecosystems, and the
environment. This report captures key sectoral risks
species and habitats integral to them, will be affected by
relevant for the UAE and the region.
rising temperatures, changes in precipitation patterns,
Infrastructure facing risks from climate change includes sea level rise, and inland intrusion of saltwater. Regional
buildings, transport links, energy assets, desalination studies on the vulnerability of species suggest serious
plants, water supply lines, and sanitation and waste consequences in the form of habitat loss and even
management facilities. Vital transport and energy links extinction of species. Observations and modeling have
may be disrupted due to extreme temperatures as well as indicated that coral reefs in the Arabian Gulf are already
weather events, causing loss of economic opportunities. impacted by climate change through bleaching and
Gulf countries are home to extensive coastal and offshore disturbance regimes, the incidence of which may increase
infrastructure, which faces risks from sea level rise and with changes in temperature and ocean properties.
storm surges as well as increased seawater salinity and pH.
A strengthened climate data collection effort is needed
On the health front, very high temperatures are a key risk to better understand observed changes and improve
factor for people residing in hot and arid countries of the modeling prospects in the UAE and the region. Increasing
region. Climate change may also increase the spread of the scope of data collection and research, enhancing
vector-borne diseases and, with its impact on the data quality, and developing models with varied scenarios
prevalence of ozone and aeroallergens, cause a rise in the and assumptions would allow the climate system to be
incidence of respiratory problems. better documented and better accounted for in
policymaking. Robust climate science, and proactive
Climate’s impact on surface water availability and adaptation planning for human wellbeing and sustained
groundwater recharge directly affects water access. Due economic growth is needed to ensure that the UAE and
to the acceleration of seawater intrusion owing to sea the wider region are well-equipped to address climate
level rise, the quality of fresh groundwater resources in risks and impacts.
coastal aquifers will also be affected. These changes will
hold consequences for communities, industry, and
92. Introduction
Climate change poses a critical challenge to the world The impacts of climate change are evident already, and the
today. It is estimated that human activities have caused risks these pose are likely to compound over time. Changes
global average temperature to rise by 1°C above pre- in climate variables hold consequences for human safety
industrial levels, with a likely range of 0.8°C to 1.2°C (IPCC, and wellbeing, income, and employment. Safety and
2018). If global warming continues at the current rate, it is reliability of infrastructure (including transport links,
likely to reach 1.5°C between 2030 and 2052 (IPCC, 2018)1 . energy and industry assets, and buildings), agricultural
The changing climate is putting communities and production and yield, freshwater availability, and
ecosystems at risk globally, and the UAE and the Gulf region ecosystems’ health are expected to be impacted by the
are no exception. The hot and arid desert climate of the changing climate. Human health and sustenance will be
region contributes to making it especially vulnerable to threatened directly by climate impacts, such as rising
climate impacts. temperatures, and indirectly by climate impacts on air,
water, and food systems.
The years 2020 and 2016 are tied as the warmest since
temperature records began. Continuing the warming In order to mitigate risks, science-based climate adaptation
trend, the globally averaged temperature in 2020 was policies are needed, and building the adaptive capacity of
1.02°C warmer than the baseline 1951-1980 mean (NASA, communities and economic sectors requires robust
2021). A UNDP (2010) report concluded that MENA is one climate data and information. While strong evidence of
of the regions most vulnerable to climate change impacts. rising average temperature, warming of the ocean’s surface,
It is projected that groundwater salinity in the region will sea level rise, glacial ice melt, and depth of seasonal
increase, more land degradation will occur, and biodiversity permafrost thaw undeniably establishes that the Earth’s
on land and in Gulf waters will be affected. Rising sea levels climate is changing, uncertainty remains around the pace
will affect coastlines and could impact desalination plants, and possible impacts of climate change in the UAE and the
which are a vital source of freshwater in the UAE and the Gulf region.
region. Climate change is expected to increase the As the UAE works to build climate resilience, this report is
frequency and intensity of extreme climate conditions and a step towards enhancing the understanding of projected
related disasters, leading to droughts, floods, hurricanes, climatic changes in the UAE and the wider region, and
and dust storms, and exposing people and infrastructure to their potential impacts. It synthesizes available findings
risk. While the Arab region has been adapting to changes in and reviews published research in the field of climate
rainfall and temperature for thousands of years, the pace at change pertaining to the region.2 The report aims to
which the climate is now changing is challenging existing identify knowledge gaps and provide guidance for further
coping mechanisms. locally relevant climate research.
1
The Paris Agreement commits Parties to “holding the increase in the 2
While an attempt has been made to include major relevant research
global average temperature to well below 2°C above pre-industrial levels studies and publications, the report is not intended to be exhaustive in its
and pursuing efforts to limit the temperature increase to 1.5°C above pre- coverage of published literature.
industrial levels” (UNFCCC, 2015).
10Box 1: A Brief Introduction to Climate Models
The research findings cited in this report draw on a their environment) into GCMs (Flato et al., 2013).
wide set of studies that employ different climate ESMs are the most commonly used models for
models. Climate models vary in design, complexity, climate change projections. To reduce
and function, depending on the purpose for which computational cost, it is possible to use an Earth
they are developed, and the data, time, and System Model of Intermediate Complexity (EMIC),
resources available. As models become more which is a simplified and coarser form of an ESM
complex, the number of calculations required to but more complex than an EBM. RCMs also fall
simulate atmospheric and oceanic interactions within the category of EMICs (Goosse et al., 2008).
increases significantly (Bralower & Bice, 2021).
As GCMs and ECMs must consider interactions
The simplest type of climate model, known as an across the planet, the resolution of the models is
Energy Balance Model (EBM), is designed to often low (~250-600km) (Data Distribution
simulate the balance of solar energy entering the Centre, 2021). To rectify this, it is possible to
Earth’s atmosphere and the escaping heat radiating develop and use an RCM, which works at a much
from the Earth. With a little more complexity, it is higher resolution. Typically, RCMs maintain a
possible to upgrade from an EBM to a Radiative resolution of a few to tens of kilometers per grid
Convective Model (RCM), which also takes into box (Gutowski et al., 2020). As RCMs still need to
consideration the process of convection, and take into consideration changes in the climate
transfer of heat and vapor vertically in different outside of the borders of the region, they are run in
layers of the atmosphere. coordination with GCMs. With downscaling, a
GCM is used to simulate global climate with the
Further, for an in-depth understanding of the
resolution increased substantially over the region
climate, researchers General Circulation Models
of interest (Giorgi, 2019).
(GCMs), also referred to as Global Climate Models.
These types of models also consider the physics of Over the years, it has become standard practice to
the Earth’s climate, and the flow of air and water opt for ensemble models as a means to better
along the Earth’s atmosphere and oceans. GCMs, account for potential biases and deviations in
unlike RCMs, operate along 3D grids, and all individual models (Pincus et al., 2008). Ensemble
calculations consider the exchange of properties in modeling is a process of running multiple GCMs
between every grid cell to simulate the transfer of and ECMs together, and averaging the results to
energy, air, and water. As such, the smaller the grid provide a more rounded impression of how the
cells and higher the resolution, the higher the climate is likely to change.
number of calculations and computing time
required to complete the model’s simulation. For One final model type is the Weather Forecast
added detail, an Earth System Model (ESM) is Model (WFM), which is primarily used for weather
employed, which is a GCM that captures intricate projections in the short term but with a
systems such as the carbon cycle, nitrogen cycle, significantly higher resolution and detail than its
GHG emissions, atmospheric chemistry, oceanic climatological counterparts. Although WFMs are
processes, and vegetation (Goosse et al., 2008). not used for climate change-related projections,
ECMs have received their name due to the building they can be utilized in conjunction with GCMs
of Earth systems and biochemical cycles and ECMs to provide a seasonal analysis of future
(interactions between biological organisms and climate (Aseh & Woma, 2013).
11Box 2: Modeling scenarios developed by the IPCC
IPCC’s SRES Socio-Economic Scenarios for the climate system. The scenarios are used to
assess the risks and costs associated with emission
Prior to the release of the IPCC’s Fifth Assessment
reductions that are consistent with specific
Report (AR5), research primarily focused on
pathways.
climate modeling using the storylines and scenarios
presented in the IPCC’s Special Report on Emissions RCP2.6 is a stringent mitigation scenario that aims
Scenarios (SRES) (2000). Each scenario family to keep global average temperature rise to below
represents a set of assumptions for how the future 2°C above pre-industrial levels. RCP4.5 and RCP6.0
could potentially change by 2100 (IPCC, 2000). represent two intermediate scenarios, and RCP8.5
Classified as the A1, A2, B1, and B2 storylines and represents one with very high GHG emissions
scenario families, these describe the relationships (IPCC, 2014).
between emission-driving forces and their
evolution, and add context for scenario Shared Socio-Economic Pathways (SSPs)
quantification. Each storyline represents different In 2016, a new set of socio-economic scenarios was
demographic, social, economic, technological, and developed to provide a replacement for the
environmental developments, while each scenario outdated SRES scenarios, however, the
represents a specific quantitative interpretation of development is a very involved process, and
one of the four storylines (IPCC, 2000). therefore the scenarios have not seen much use in
Representative Concentration Pathways (RCPs) the early years. Nevertheless, with continuous
refinements, the shared socio-economic pathways
In 2014, the IPCC released the AR5, which described (SSPs) are now set to be integrated into the
four different 21st-century pathways of GHG Coupled Model Intercomparison Project (CMIP6)
emissions and atmospheric concentrations, air in preparation for the IPCC’s Sixth Assessment
pollutant emissions, and land use, known as Report (AR6). The SSP scenarios, unlike the RCPs,
Representative Concentration Pathways (RCPs) reintegrate how socio-economic changes and
(IPCC, 2014). Different concentrations are initiatives can lead to different routes, which allows
associated with radiative forcing increasing by a researchers to consider both RCPs and SSPs as
certain amount by 2100. To account for a range of complementary metrics for how the planet will
potential emission scenarios, the forcing is set at respond to changes in environmental forcing and
2.6, 4.5, 6.0, and 8.5 watts per square meter (W m-2). socio-economic changes. The five scenarios can be
RCPs were developed using integrated assessment broken down as seen in the infographic below
models as input to a range of climate model (Pinnegar et al., 2021).
simulations in order to project their consequences
123. Climate Projections for the
UAEUAE
and&the
theGulf
Gulf
The body of research on observed and projected climatic mathematical representations of the Earth’s climate
changes in the UAE and the region is limited yet growing. system, however, the system may ultimately prove to be
Existing literature on the subject relies on a variety of too complex to model accurately. Therefore, results from
modeling frameworks, reflecting the diversity of models climate models need to be validated or tested against real-
being employed globally to develop climate change world data to increase confidence in the projections
scenarios (Box 1). Global models are used primarily due to produced.
the interconnected and dynamic nature of the atmosphere
This section captures the main research findings on
and oceans. Current modeling studies mostly take into
historical records and trends as well as predictions of
account Representative Concentration Pathways (RCPs)
climate-related changes in the future with a focus on the
that are defined on the basis of climate forcing. Box 2
following key parameters: temperature; rainfall; seawater
summarizes the three sets of scenarios/storylines developed
temperature, salinity, and pH; sea level rise; and extreme
by the IPCC.
weather events.3
The climate projections available for the UAE and the wider
Figure 1 summarizes key findings on climate variables
region that are included in this report result from a range of
most relevant to the region. Climate models largely project
different models, as indicated here. In essence, models are
hotter, drier, and less predictable climate.
3 This section draws on the report ‘Review of the Current Status of of researchers from the United Arab Emirates University in 2019.
Climate Change Modeling in the UAE and the Region’, prepared by a team
13Climate Projections for the UAE & the Region
Figure 1: Summary of modeled projections for different climate properties in the UAE and surrounding region
14Temperature
1901 to 2018. It is built on the basis of recorded
Available field measurements confirm with certainty that
observations, Angular Distance Weighting (ADW)5, and
the average global temperature has increased over time.
interpolation where appropriate (University of East Anglia
The IPCC (2018) estimates that the global mean surface
CRU, 2017). Based on the results illustrated in Figure 2,
temperature has increased by 1.0±0.2°C since pre-industrial
recent temperature records of the UAE show an increase
times, and predicts an increase of up to 1.5°C between
of 2°C relative to 1950-1980. The results depict a rising
2030 and 2052.4 The number of hot days is projected to
trend from 1910 to 1960, followed by a 30-year period of
increase in most land regions, with the highest increases in
roughly consistent average temperatures and subsequently
the tropics. Estimated human-induced global warming is
a sharper increase in temperatures from 1990 to 2018.
currently increasing at 0.2°C (likely between 0.1°C and
Figure 2b illustrates the R2 values for the periods prior to
0.3°C) per decade due to past and ongoing emissions.
and post-1980 to provide a statistical analysis of the
Complementing global research, a set of findings is scatter of the points. The period post-1980 shows both a
available for the UAE and the region. Figure 2 presents the steeper rise and a higher statistical significance, indicating
observed changes in UAE surface temperature relative to more intense warming. Figure 2C was prepared as a means
1951-1980 average temperatures. The data was prepared to analyze the influence of the warming on the varying
using the University of East Anglia Climatic Research Unit seasons, indicating an intensification of warming in the
(CRU) Time Series (TS) Version 4.01 archives, ranging from summer months.
4 Reflecting the long-term warming trend since pre-industrial times, 5 ADW is a common interpolation approach used to take an irregular
observed global mean surface temperature for the decade 2006-2015 was network of meteorological variables and apply them to a regular grid
0.87°C (likely between 0.75°C and 0.99°C) higher than the average over the (Hofstra & New, 2009).
1850-1900 period (IPCC, 2018).
15UAE Annual Recorded Temperatures (°C)
29.5 2.5
29 R² = 0.6598 2
28.5 1.5
Temperature Change (°C)
Relative to 1951-1980
28 1
Temperature (°C)
27.5 0.5
27 0
26.5 -0.5
26 -1
25.5 -1.5
25 -2
24.5 -2.5
1900 1910 1920 1930 1940 1950 1960 1970 1980 1990 2000 2010 2020
Year
UAE Annual Recorded Temperatures (°C)
29.5 2.5
29 2
R² = 0.6831
28.5 1.5
Temperature Change (°C)
R² = 0.3087
Relative to 1951-1980
28 1
Temperature (°C)
27.5 0.5
27 0
26.5 -0.5
26 -1
25.5 -1.5
25 -2
24.5 -2.5
1900 1910 1920 1930 1940 1950 1960 1970 1980 1990 2000 2010 2020
Year
UAE Decadal Temperature Comparison
37.0
35.0
33.0
31.0
Temperature (°C)
29.0
27.0
25.0
23.0
21.0
19.0
17.0
Jan Feb Mar Apr May Jun Jul Aug Sep Oct Nov Dec
Month
1905 1915 1925 1935 1945 1955 1965 1975 1985 1995 2005 2015
Figure 2: Change in the UAE surface temperature relative to 1980-1951. In figures A and B, the left Y-axis represents the mean annual recorded temperature,
while the right Y-axis denotes how far each point deviates in relation to the 1980-1951 average benchmark. Figure C shows seasonal decadal temperatures.
The data used is available on the University of East Anglia CRU website (University of East Anglia CRU, 2017).
16Period Western Central & Eastern (projections for temperature underestimated the
UAE Northeastern UAE recorded values), however, it may be attributed to a
UAE positive rainfall bias during autumn and winter months.
2050 2.29-2.38°C 2.26-2.29°C 2.21-2.25°C The biases were accounted for using the bias-corrected
2100 3.80-3.91°C 3.73-3.79°C 3.64-3.72°C CCSM4 dataset to improve the WRF projections, which
was shown to provide realistic results when compared
Table 1: Summary of UAE temperature projections as presented in with observations (AGEDI, 2015a).
Dougherty et al. (2009)
The MENA region was further explored in a paper by
In terms of projections, the Stockholm Environment Bucchignani et al. (2018), using the Centro Euro-
Institute generated a set of results for the UAE using Mediterraneo sui Cambiamenti Climatici Climate Model
Model for the Assessment of Greenhouse Gas-Induced (CMCC-CM), a GCM, as the base, while regionally
Climate Change (MAGICC) and Regional Climate downscaling for the MENA region using a regional model
SCENario GENerator (SCENGEN). The models developed developed by the Consortium for Small-scale Modeling
a regional climate baseline (1960-1991), and projected in Climate Mode (COSMO-CLM13). Bucchignani et al.
regional temperature and rainfall (Dougherty et al., 2009). (2018) reported an increase in temperature of 2.5°C in
A total of 17 GCMs were included in MAGICC/SCENGEN, winter months and 4°C in summer months under an
and 36 IPCC emission scenarios were developed, grouped RCP4.5 scenario by 2100 in comparison with the 1979-
into four major categories: A1, B1, A2, and B2 (Box 2). The 2005 baseline.
projections are summarized in Table 1.
In a paper by Almazroui et al. (2016), an assessment of
A study by AGEDI (2015a) utilized the Community Earth the CMIP314 GCMs utilized in the IPCC Fourth
System Model (CESM)6 of the US National Center for Assessment Report was conducted over the Arabian
Atmospheric Research (NCAR), which indicated warmer Peninsula. The study was designed to identify how the
and wetter conditions throughout the Arabian Peninsula. Arabian Peninsula was projected to be influenced by
In comparison with the 1986-2005 baseline, by 2060-2079 climate change over the succeeding decades via an
under the RCP8.5 scenario, the predicted average future examination of the ensemble of GCM data from the
temperature will increase by 2-3°C in the land area, with CMIP3. The projections for the B1, A1B, and A2 scenarios
slightly smaller increases projected for coastal areas. The show a temperature increase of 0.37°C (northern Arabian
change is consistent across winter and summer seasons Peninsula) and 0.35°C (southern Arabian Peninsula) per
(AGEDI, 2015a). In order to increase the resolution of the decade in comparison with the 1970-1999 base period. It
model, AGEDI (2015a) employed the NCAR Weather was found that warming was more pronounced in the
Research Forecast (WRF)7 model to dynamically downscale summer season compared with the winter season over
the Community Climate System Model Ver. 4 (CCSM48). the whole peninsula, however, the summer warming in
Results indicated an annual cycle of temperature in the the northern Arabian Peninsula was found to exceed the
Arabian Peninsula with a cold bias9 of less than 1°C in the summer warming of the southern region. A similar study
spring and early summer months, and a warm bias10 of was conducted the following year (Almazroui et al.,
~3°C during autumn and winter months.11 In the AGEDI 2017) in an assessment of the projections of the ensemble
study in particular, it is unclear what caused the cold bias GCMs used in the fifth phase of the Coupled Model
6 CESM is a fully coupled global climate model designed to provide 10 Modeled temperatures were warmer than observed temperatures in
simulations of the Earth’s past, present, and future climate (NCAR, 2021). test years.
7 WRF models are mesoscale numerical weather prediction systems 11 Biases occur when a model overestimates or underestimates any
designed to operate for both atmospheric research and operational projections when its results are validated against observed data. They
forecasting due to their flexibility and the ability to use observations as need to be corrected to ensure that over-/underestimations are not
well as idealized conditions (UCAR, 2021). carried over into future projections.
8 CCSM4 is a subset of the CESM and is designed to run five separate 12 CMCC-CM is a coupled atmosphere-ocean general circulation model
models simultaneously to simulate the Earth’s atmosphere, oceans, land, (AOGCM) (Scoccimarro et al. 2011).
land ice, and sea ice. The model allows for simulations of the Earth’s past, 13 COSMO-CLM was developed as a hydrostatic model to produce
present, and future climate states (Vertenstein et al., 2010). forecasts at a resolution where convection could be simulated (Steger &
9 Modeled temperatures when compared with observed temperatures in Bucchignani, 2020)
test years were found to be lower. This is identified by using the model to 14 CMIP3 is the third phase of the Coupled Model Intercomparison
project over a period where data was recorded and validating how close Project, designed as an experimental protocol for the analysis of output
the projections line up with the observations. from coupled atmosphere-ocean general circulation models (AOGCMs).
17Intercomparison Project (CMIP5) presented in the IPCC warm bias in the summer in the southeastern region of
Fifth Assessment Report (AR5). The study analyzed the Arabian Peninsula. These biases were corrected with
temperature trends for the RCP4.5 and RCP8.5 scenarios. the use of the Distribution-Based Scaling (DBS19) method,
A warming of 0.23°C and 0.60°C was projected per decade and the annual results have been derived from the
in the northern Arabian Peninsula for RCP4.5 and RCP8.5 corrected values (ESCWA, 2017).
respectively in comparison with the 1970-1999 base
Using a similar set of RCP scenarios, in a paper by Al
period. In the southern Arabian Peninsula, warming was
Blooshi et al. (2019), temperature changes in three areas
slightly lower at 0.20°C and 0.53°C for RCP4.5 and RCP8.5.
spanning two UAE emirates were investigated using a
Over the entire peninsula, the projections could be
combination of 17 models as part of the MarkSimGCM
summarized as a decadal warming of 0.22°C and 0.57°C
system. With a reference to the 1960-1990 base period,
for RCP4.5 and RCP8.5 respectively.
the study examined the maximum projected
The CMIP5 ensemble modeling approach was further temperatures in Abu Dhabi, Al Ain (part of the Abu
utilized by the Regional Initiative for the Assessment of Dhabi emirate), and Sharjah under the RCP4.5 and
Climate Change Impacts on Water Resources and Socio- RCP8.5 scenarios. Readings for 2095 show a considerable
Economic Vulnerability in the Arab Region (RICCAR) increase in temperature for the three emirates compared
(ESCWA, 2017). RICCAR’s projections also made use of to the baseline, extending up to 5.35°C for the RCP8.5
the RCP4.5 and RCP8.5 scenarios utilizing three of the scenario in Sharjah. The results have been summarized in
CMIP5’s GCMs. The models include the EC-EARTH15, Table 2.
CNRM-CM516 , and GFDL-ESM217. The GCMs were used
Almazroui et al. (2020a) returned to the multi-model
to inform the Rossby Centre Regional Atmospheric Model
ensemble of the CMIP5 in order to model temperature
(RCA418) of atmospheric conditions outside of the region.
changes in the Arabian Peninsula using 22 models over
The RCA4 model has been incorporated over the domain
three representative timeframes. The projections were
of the MENA region. The study took into consideration a
broken down to short-term (2030-2039), mid-term
comparison of the reference period (1986-2005) against a
(2060-2069), and long-term (2090-2099) for the RCP4.5
mid-term (2046-2065) and long-term projection (2081-
and RCP8.5 scenarios. The projections were further
2100).
broken down into seasonal analyses. The results of the
RICCAR’s projections evaluated annual and seasonal projections have been summarized in Table 3 and show
trends in warming and identified a universal warming in the increase in temperature relative to the 1971-2000
both scenarios. Projections show a warming of 1.2-1.9°C base period. Validation efforts on part of the research
for RCP4.5 and 1.5-2.3°C for RCP8.5 in the mid-term. By indicated temperature biases in the summer and winter
the end of the century, projections revealed a warming of seasons, whereas the spring and autumn projections
1.7-2.6°C for RCP4.5 and 3.2-4.8°C for the RCP8.5 scenario. were more in line with observations. Annually, the
It should be noted that the study included a seasonal projected increase in temperature is highest in the
analysis of temperature trends, however, analysis had central region.
indicated a cold bias, particularly in winter months, and a
Emirate/Area RCP4.5 RCP8.5
Abu Dhabi 2.44°C 4.56°C
Al Ain 3.48°C 4.74°C
Sharjah 3.38°C 5.35°C
Table 2: Summary of projected warming by 2095 (Al Blooshi et al., 2019)
15 EC-EARTH – a GCM developed to utilize the seasonal prediction dynamics (Dunne et al., 2012).
configuration of the European Centre for Medium-Range Weather 18 RCA4 – developed from the numerical weather prediction High-
Forecasts (ECMWF) as the base of the climate model (EC-Earth, 2021). Resolution Limited-Area Model (HIRLAM) (ESCWA, 2017).
16 CNRM-CM5 – a GCM developed by the Centre National de Recherches 19 DBS is a bias correction method applied to climate models to improve
Météorologiques – Groupe d’études de l’Atmosphère Météorologique and their suitability for climate impact assessment. DBS matches observed
Cerfacs to contribute to the CMIP5 (Voldoire et al., 2013). and simulated frequency distributions of data, and applies a variable-
17 GFDL-ESM2 – the Geophysical Fluid Dynamics Laboratory’s Earth dependent theoretical distribution (Yang et al., 2010).
System Model, upgraded to incorporate explicit and consistent carbon 18Season Period RCP4.5 RCP8.5
2030-2039 1.472-1.790°C 1.695-2.125°C
Winter 2060-2069 2.254-2.934°C 3.620-4.156°C
2090-2099 2.551-2.895°C 5.206-5.582°C
2030-2039 1.258-1.718°C 1.493-1.969°C
Spring 2060-2069 2.289-2.667°C 3.499-3.811°C
2090-2099 2.592-2.892°C 5.224-5.734°C
2030-2039 1.489-1.831°C 1.723-2.109°C
Summer 2060-2069 2.413-2.761°C 3.484-4.178°C
2090-2099 2.779-2.959°C 5.684-6.072°C
2030-2039 1.504-1.896°C 1.689-2.203°C
Autumn 2060-2069 2.739-3.303°C 4.027-4.721°C
2090-2099 3.029-3.271°C 5.802-6.352°C
Table 3: Summary of seasonal temperature increase projections for the Arabian Peninsula in the short, mid, and long term for RCP4.5 and RCP8.5 scenarios
(Almazroui et al., 2020)
Almazroui et al. (2020b) continued analysis of the CMIP however, some trends become apparent, including
multi-model datasets by exploring the sixth phase of the higher warming in summers compared to winters and a
Coupled Model Intercomparison Project (CMIP6) and higher degree of warming in the northern Arabian
the projected changes to temperature over the Arabian Peninsula in comparison with the South.
Peninsula. The updated analysis included an assessment
of the ensemble of 31 CMIP6 models under three new
shared socio-economic pathways (SSPs): SSP1, SSP2, and Precipitation
SSP5 (Box 2). A near-term period (2030-2059) and a far
Projected global trends suggest that as global surface
period (2070-2099) were taken into consideration and
temperatures increase, most wet tropical regions and
compared against the base period of 1981-2010. Results
mid-latitude land masses will experience a higher
over the peninsula under the projected timeframes and
intensity and frequency of extreme precipitation events
scenarios have been summarized in Table 4. The results
(IPCC, 2014a). Rainfall is often harder to model and
have also indicated increased projected warming in the
predict than temperature. Depending on the initial
summers compared to winters and additional warming in
assumptions a model is set up to use, rainfall projections
the northern Arabian Peninsula compared with the
for a region often vary widely.
southern region by 2100.
For the purposes of this report, a primary assessment of
Across research studies, there is a consensus on an
observed changes in rainfall in the UAE was undertaken.
increase in average temperatures in the Arab region. This
Data spanning the period 1982-2017, available with the
increase becomes more pronounced in high-emission
UAE’s National Center of Meteorology, was utilized, and
scenarios and the further the results extend into the
the available records of six main rainfall stations in the
future. The degree of warming varies from study to study,
UAE, including the international airports of Abu Dhabi,
Period SSP1 SSP2 SSP5
2030-2059 1.2-1.9°C 1.4-2.1°C 1.8-2.7°C
2070-2099 1.2-2.1°C 2.3-3.4°C 4.1-5.8°C
Table 4: Projected warming in the Arabian Peninsula based on an assessment of the 31 CMIP6 models (Almazroui et al., 2020b)
191800 1800
1600 Rainfall Recorded at UAE Airports Since 1982 1600
1400
Abu Dhabi 1400
Total Rainfall (mm)
1200 1200
Dubai
1000 1000
Sharjah
800 800
Ras Al Khaimah
600 600
400 400
200 200
0 0
1982
1983
1984
1985
1986
1987
1988
1989
1990
1991
1992
1993
1994
1995
1996
1997
1998
1999
2000
2001
2002
2003
2004
2005
2006
2007
2008
2009
2010
2011
2012
2013
2014
2015
2016
2017
Year
Figure 3: Historical rainfall trends recorded at six airport weather stations in the UAE (collected by the National Center for Meteorology)
Al Ain, Dubai, Sharjah, Fujairah, and Ras Al Khaimah, were AGEDI (2015a) reports that according to CCSM4
considered (Figure 3). The graph shows that rainfall in the simulations as run for the IPCC AR5, for the period 1986-
UAE does not exhibit a clear increasing or decreasing 2005, daily precipitation in the Arabian Peninsula stood
trend over the years, even though post-1999, it does not at 0.5 mm/day and has been projected to increase by
appear to spike as high as during some of the previous ~0.1 mm/day by 2100. AGEDI’s work on regional climate
years. Nevertheless, the short timeframe implies that modeling, downscaled from the CESM (which includes
there is not enough evidence to conclude if the observed the CCSM4), indicated that rainfall is projected to
changes in rainfall patterns can be attributed to climate increase over much of the UAE and the Hajar Mountains
change or to natural variations and cyclical patterns. (AGEDI, 2015a). By 2060-2079 for the RCP8.5 scenario,
AGEDI projects an increase of 50-100% from the baseline
Basha et al. (2015) investigated precipitation trends in the of 1986-2005 for parts of Dubai, Sharjah, and northern
UAE using a stochastic model (allowing for fluctuations in Abu Dhabi. The surrounding regions are expected to
historical data) and reported rainfall projections. It was witness a rainfall increase of about 25% (AGEDI, 2015a20).
shown that post-1960, precipitation exhibits an oscillatory Decreasing rainfall is predicted over much of Oman and
trend, whereby rainfall increases for a 20-year period and eastern Saudi Arabia. An increase in rainfall is predicted
declines over the next 20, continuing to follow this pattern. over the Arabian Gulf and Gulf of Oman. Additionally,
Rainfall in the UAE was projected to continue to decrease according to AGEDI’s analysis, while the increase over the
post-2015 to a minimum in 2035 and then increase Arabian Gulf waters occurs during the winter season, in
thereafter. With rainfall trends following a 20-year pattern, the UAE, the increase in rainfall during the summertime
it would be difficult to identify the influence of climate is larger than the increase during the winter period in
change on rainfall in the region without a rainfall dataset both absolute value and percentage change (AGEDI,
for a longer duration. 2015a).
While focused on a small geographical area, based on the The AGEDI (2015a) analysis also projects that more rain
results of a culmination of 36 IPCC models grouped into will fall in general but in fewer rain events. Despite the
the A1, B1, A2, and B2 scenarios, the range of precipitation projected increase in rainfall over much of the UAE, the
change for the Abu Dhabi emirate was projected to be number of wet days is projected to decrease. Rain events
between -21.20% and +10.33% for 2050 and between will be more intense when it does rain, however, there
-37.8% and +18.4% for 2100, relative to the 1961-1990 will be a higher tendency towards longer dry spells. This
annual average (Dougherty et al, 2009). is primarily due to the influence of warming of the air.
Warmer air can hold more moisture, and hence it would
20 AGEDI notes that the CCSM4 model projects wetter conditions for the regional results may also overestimate rainfall.
Arabian Peninsula as compared to the ensemble of the CMIP5. Therefore,
20take more evaporation for the air to reach its vapor- the Arab Region (RICCAR) (ESCWA et al., 2017). RICCAR’s
carrying capacity and for condensation to occur. When it projections also made use of the RCP4.5 and RCP8.5
does rain, the added moisture will result in more extreme scenarios and ensemble modeling, however, only three of
rain events (Patz et al., 2014). the CMIP5’s GCMs were utilized as part of the report.
The study compared the reference period (1986-2005)
The AGEDI study extends into humidity projections as with a mid-term (2046-2065) and a long-term projection
well and identifies that changes in humidity are expected (2081-2100). The results of the RICCAR study (ESCWA et
to be greater in summer months, associated with higher al., 2017) show that precipitation changes vary across
evaporation due to warming temperatures. Humidity is different parts of the MENA region, and therefore no
projected to increase by about 10% over the Arabian Gulf conclusive results can be drawn on average annual or
under the RCP8.5 scenario, with a slightly lower increase seasonal changes across the region. As such, the use of a
in humidity in most parts of the UAE (AGEDI, 2015a). mean, annual change in rainfall over the MENA region
Almazroui et al. (2016) assessed the CMIP3 GCMs utilized would be misleading, as there are more pronounced
in the IPCC’s Fourth Assessment Report to identify how changes in localized areas. Over the Arab region, both
the precipitation over the Arabian Peninsula would alter RCP scenarios show a decrease in monthly precipitation
over time. The projections for the B1, A1B, and A2 in the mid-term and an overall monthly decrease of up
scenarios showcase that the changes in precipitation will to 8-10mm by the end of the century in coastal regions
not be uniform across the entirety of the region. near the Euphrates and Tigris rivers. On the other hand,
Projections across all three scenarios show a decrease in further south, some regions have been projected to
precipitation of 1.35% per decade in the northern Arabian experience an increase in precipitation, which includes
Peninsula with reference to the 1970-1999 base period. In the southeastern Arabian Peninsula. This could be
contrast, the southern Arabian Peninsula shows a decadal attributed to the potential shift in the Intertropical
increase in precipitation of +1.21%. A similar study was Convergence Zone (ITCZ21), which has been suggested to
conducted the following year (Almazroui et al., 2017) migrate further northwards in response to a warming
using the CMIP5 projections as part of the IPCC’s Fifth climate (ESCWA et al., 2017).
Assessment Report under the RCP4.5 and RCP8.5 In a paper published two years later, Al Blooshi et al.
scenarios. Projections displayed trends similar to the 2016 (2019) made use of an ensemble modeling approach to
study with respect to precipitation in the northern and investigate precipitation changes over three areas
southern regions of the Arabian Peninsula. The results spanning two of the UAE’s emirates, using the
showed a decadal decrease in precipitation over the MarkSimGCM as a means to utilize the combination of
northern Arabian Peninsula of -1.18% and -0.14% for the the 17 models embedded within it. The study made use
RCP4.5 and RCP8.5 scenarios respectively. In contrast, the of the RCP4.5 and RCP8.5 scenarios. Readings for 2095
southern Arabian Peninsula showed a decadal increase in show a general trend towards an increase in precipitation,
precipitation of +0.34% and +2.99% for the RCP4.5 and however, the trends are not uniform over the study area.
RCP8.5 scenarios. On an average, the entire Arabian The results are summarized in Table 5.
Peninsula was projected to experience a trend of -0.27%
and +2% in precipitation for the RCP4.5 and RCP8.5 RCP4.5 RCP8.5
scenarios respectively per decade.
Abu Dhabi +3.28 mm -0.92 mm
The precipitation results from Almazroui et al. (2017) Al Ain +0.14 mm +1.12 mm
were in agreement with projections of the Regional Sharjah +1.90 mm +2.32 mm
Initiative for the Assessment of Climate Change Impacts Table 5: Summary of projections for precipitation changes by 2095 (Al
on Water Resources and Socio-Economic Vulnerability in Blooshi et al., 2019)
21 The ITCZ represents a belt of warm, rising air and converging winds rainfall, and frequent thunderstorms (Schneider et al., 2014).
found near the equator. The warm, rising air develops thick cloud activity,
21Almazroui et al. (2020b) conducted an assessment of an Seawater – Temperature, Salinity & pH
ensemble of 31 CMIP6 models and their projections for Under the influence of a warming climate, seawater
precipitation over the Arabian Peninsula. The study properties have registered change, and will continue to do
incorporated the new SSPs (Box 2) that are due to so. Over the course of the 21st century, the ocean is
supersede RCPs in the IPCC’s Sixth Assessment Report projected to witness unprecedented conditions
(AR6). The scenarios considered include SSP1, SSP2, and characterized by increased temperatures, greater upper
SSP5 with projections into the near term (2030-2059) and ocean stratification, and further acidification (IPCC, 2019).
long term (2070-2099) in comparison with the 1981-2010 Oceans are regarded as buffers, and unlike the atmosphere,
base period. Results over the Arabian Peninsula under all natural changes in seawater temperature, acidity, and
considered scenarios and timeframes have been salinity (with the exception of estuaries) occur gradually
summarized in Table 6. The researchers have also noted and with minor shifts. Aquatic organisms are not well-
that the results show a robust increase in the mean annual suited to cope with large shifts: findings from laboratory,
precipitation over the southern Arabian Peninsula with a field, and modeling studies, in addition to evidence from
decrease in the North. geological records, indicate that “marine ecosystems are
highly susceptible to increases in oceanic CO2 and the
Period SSP1 SSP2 SSP5
corresponding decreases in pH and carbonate ion” (IPCC,
2030-2059 5-28% 5-31% 1-38% 2013). Climate-induced changes are therefore likely to put
2070-2099 -3-29% 4-49% 12-107% these organisms at increased risk. Moreover, changes of
Table 6: Projections of precipitation changes in the Arabian Peninsula
larger magnitude are more likely to occur as the ocean’s
on the basis of an assessment of the 31 CMIP6 models (Almazroui et al., ability to buffer weakens with constant pressure from
2020b)
climate change.
Notably, in recent years, the UAE has embarked on cloud
seeding as part of its rainfall enhancement program (Breed
Sea Surface Temperature & Salinity
et al., 2005). It is difficult to determine how much of the
observed rainfall in recent years can be attributed to cloud Since 1970, the ocean has warmed unabated and has
seeding; concomitantly, a comparison between recent stored more than 90% of the excess heat in the climate
observations and previous records may not lead to accurate system (IPCC, 2019). With ocean warming being the
trends. largest near the surface, over the period 1971-2010, the
upper 75 m warmed by 0.11°C (between 0.09 and 0.13°C)
Overall, precipitation projections over the region have
per decade (IPCC, 2014a). Global projections drawn from
been shown to be more dynamic and sporadic than
the CMIP5 indicate a rise in global sea surface temperature
temperature projections. The majority of studies
of 0.8°C by 2050 and 1.2°C by 2100, relative to 1870-1899
undertaken suggest that identifying precipitation patterns
temperatures for RCP2.6; and a rise of 1.5°C by 2050 and
over the region would not provide an accurate
3.2°C by 2100, relative to the same time period, for RCP8.5
representation of changes, as climate change’s influence on
(IPCC, cited in Foresight, 2017).
precipitation is more localized and not uniform across the
region. Projections across the northern and southern For the Arabian Gulf, Shirvani et al. (2015) reported that
Peninsula vary. Research also suggests that it is likely that the Gulf water temperatures have warmed by about
the region will witness a decrease in rain frequency with an 0.57°C during the 1950-2010 period. Readings were
increase in intensity. calculated using an Autoregressive Integrated Moving
Average (ARIMA) model. Although a significant trend was
not evident for the 1950-1969 and 1970-1989 periods, the
Arabian Gulf sea surface temperatures have abruptly
increased thereafter. There is an increase in sea surface
22temperature by 0.7°C/decade along the western side of the change, marine life is not well-adapted to adjust. Adverse
Gulf with reference to the 1950-2006 period used to impacts may include a decrease in the body size of
develop the model and the 2007-2011 period used to test ectotherms (Audzijonyte et al., 2020) and thermal
the model. bleaching of corals (Burt et al., 2019; Paparella et al., 2019).
Piontkovski and Queste (2016) investigated changes to the In addition to seawater warming, climate-related changes
physical and biochemical properties of the upper 300 m of in ocean properties include shifts in salinity. According to
the western Arabian Gulf, using the NCEP/NCAR reanalysis the IPCC, it is very likely that regional precipitation trends
database22 with records spanning 1950-2010. The results have increased the mean geographical contrasts in sea
made use of the same timeframe as Shirvani et al. (2015) surface salinity since the 1950s: “saline surface waters in
but expanded on the research by introducing the evaporation-dominated mid-latitudes have become more
component of depth to seawater temperature changes. saline, while relatively fresh surface waters in rainfall-
Piontokovski and Queste (2016) identified a decadal dominated tropical and polar regions have become
increase in surface water temperatures of 0.6°C in the fresher” (Rhein et al., 2013). Increased evaporation with
western Arabian Gulf in the mixed layer (upper ~30 m) rising temperatures also leads to changes in salinity.
with a slightly lower value of ~0.4°C at depth (300 m). Understanding changes in ocean salinity is critical not only
as an indicator of precipitation/evaporation over the
Further, in terms of future trends, Noori et al. (2019)
ocean but also because salinity changes affect circulation
investigated the influence of climate change on the Arabian
and stratification, in turn impacting the ocean’s biological
Gulf and the Gulf of Oman under the RCP8.5 scenario.
productivity, in addition to its capacity to store heat and
Projections considered warming by 2030, 2050, 2070, and
carbon (Rhein et al., 2013).
2100 in comparison with the control period of 2016-2018.
The projection was calculated based on historical changes In the Arabian Gulf, salinity is likely to increase due to the
in regional sea surface temperature and with the use of a increase in evaporation with the warming atmosphere.
Proper Orthogonal Decomposition (POD23) model. An Additionally, it is expected that the expansion of seawater
annual assessment of the results showed that the north desalination facilities will increase the already high level of
coast of the UAE and south coast of the Strait of Hormuz salinity. AGEDI (2015b, 2015c) reported that with climate
will experience the greatest warming by 2100, reaching change, the Arabian Gulf will become even more stressed,
temperatures of up to 32°C. For comparison, the mean with significant increases in temperature across the Gulf,
Arabian Gulf seawater temperature is projected to rise coupled with zones of large salinity increases.
from 28.5°C in 2015 to 30.7°C in 2100, while maximum
temperatures are set to rise from 29.9°C in 2015 to 31.8°C in
Acidity (pH)
2100. Additionally, for each of the projected years, the
maximum projected increase in temperature in the With increased concentration of GHGs in the atmosphere,
Arabian Gulf was found to be 2.1°C (May 2030), 2.8°C (May another important change in seawater properties includes
2050), 3.4°C (August 2070), and 4.3°C (August 2100) (Noori ocean acidification or a decrease in seawater pH due to the
et al., 2019). ocean’s increased sequestration of atmospheric CO2
content. The ocean has taken up 20-30% of anthropogenic
The results had also indicated that warming will be more
CO2 emissions since the 1980s, leading to acidification
intense during the summer season in both the Arabian
(IPCC, 2019). Since the beginning of the Industrial
Gulf and Gulf of Oman, which falls well in line with the
Revolution in the early 1800s, the pH of surface ocean
atmospheric temperature projections that also show an
waters has fallen by 0.1 units, however, despite the small
intensification of summertime warming by the end of the
value, pH units operate on a logarithmic scale, and a pH
century (Almazroui et al., 2020a, 2020b; Al Blooshi et al,
decrease of 0.1 constitutes an increase in acidity of ~30%
2019; Bucchignani et al., 2018).
(NOAA, 2020b). Open ocean surface pH has declined by a
Notably, under warming conditions posed by climate very likely range of 0.017-0.027 pH units per decade since
22 Climate reanalysis is the process of collecting records of past 23 A POD model is a numerical method applied to reduce the complexity
observations and using a model to fill in the gaps in the records to provide of computationally intensive simulations, such as those in fluid dynamics
a more comprehensive and consistent rendition of the historical climate. (Luo & Chen, 2018).
23You can also read