2021 MONADNOCK REGION FOOD ACCESS ANALYSIS - Monadnock Children's Food Access Alliance - New ...
←
→
Page content transcription
If your browser does not render page correctly, please read the page content below
2021 MONADNOCK
REGION FOOD ACCESS
ANALYSIS
Monadnock Children’s Food Access Alliance
                      0
2021 MONADNOCK REGION
FOOD ACCESS ANALYSIS
Prepared by Southwest Region Planning Commission
ACKNOWLEDGEMENTS
This report is a product of the Monadnock Children's Food Access Alliance, a diverse network of partners
committed to improving the overall health of children and families in the Monadnock Region through
increasing access to affordable, healthy food.
Cheshire County Conservation District Keene Housing
Cheshire Medical Center Keene YMCA
Community Kitchen Meals on Wheels at HCS
Cornucopia Project Monadnock Alliance for Families
Farm to Institution New England Monadnock Coalition of Food Pantries
Feeding Tiny Tummies Monadnock Community Learning Center
Food Connects Monadnock Farm & Community Coalition
Gert's Pantry Monadnock Understands Childhood Hunger
Grapevine Family & Community Center Monadnock United Way - Impact Monadnock
Head Start NH Food Alliance
Home Healthcare Hospice & Community NH Gleans
Services Rise for baby & family
Keene Community Garden Connections The River Center
Keene Day Care Center Salvation Army Food Pantry
KSC Dietetic Internship Program Southwestern Community Services
KSC Hungry Owl Food Pantry UNH Nutrition Connections
Funding for the Monadnock Children's Food Access Alliance provided by the
New Hampshire Children's Health Foundation.Contents
1 Introduction ........................................................................................................................................... 3
2 Key Findings ......................................................................................................................................... 5
3 Approaches ........................................................................................................................................... 6
3.1 Key Informant Interviews ............................................................................................................. 8
3.2 Listening Sessions ......................................................................................................................... 8
3.3 Targeted Surveys .......................................................................................................................... 8
3.4 Data Sources and Review of Past Work ....................................................................................... 8
3.5 Asset Mapping .............................................................................................................................. 8
4 Rates of Food Insecurity and Contributing Factors .............................................................................. 9
4.1 Affordability of Food .................................................................................................................. 12
4.2 Addressing Food Insecurity Through Federal Food Assistance Programs ................................. 13
4.3 Food Insecurity and Health Outcomes ........................................................................................ 14
5 Inventory of Food Sources .................................................................................................................. 15
6 Monadnock Children’s Food Access Alliance Network ..................................................................... 17
6.1 Key Players ................................................................................................................................. 17
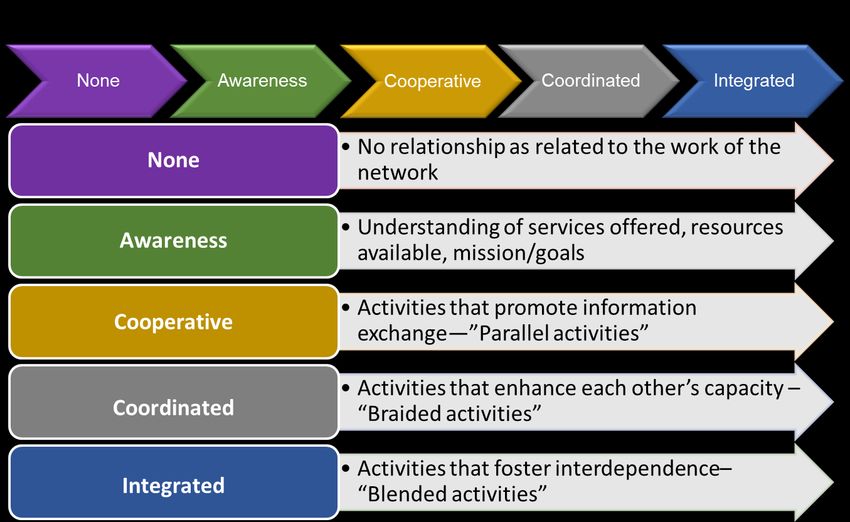
6.2 Collaborative Activities .............................................................................................................. 18
6.3 Connections, Silos and Readiness for Change ............................................................................ 21
7 Food Access System Models and Best Practices ................................................................................ 22
7.1 No Hungry Kid Center for Best Practices ................................................................................... 22
7.2 Rural Health Information Hub: Food System Approaches to Address Food Insecurity ............. 24
7.3 Evidence-Based Strategies to End Childhood Food Insecurity and Hunger in Vermont ........... 24
7.4 Food Research and Action Center Resource Library .................................................................. 27
7.5 Planning for Food Access and Community-Based Food Systems: A National Scan and
Evaluation of Local Comprehensive and Sustainability Plans ............................................................... 28
8 Findings............................................................................................................................................... 29
8.1 Food Access, Availability and Affordability .............................................................................. 30
8.2 Input from People with Lived Experience .................................................................................. 32
8.2.1 Food Eaten in Households .................................................................................................. 32
8.2.2 Food Shopping Patterns ...................................................................................................... 32
8.2.3 Food Assistance Programs .................................................................................................. 33
8.2.4 Transportation ..................................................................................................................... 33
9 What’s Next ........................................................................................................................................ 33
10 Appendix A: Monadnock Children’s Food Access Alliance Key Stakeholders ................................. 35
111 Appendix B: Food Sources List .......................................................................................................... 40
12 Appendix C: Food Sources Maps ....................................................................................................... 52
13 Appendix D: Listening Sessions, Interviews and Surveys.................................................................. 61
14 Appendix E: Survey Templates and Discussion Guides ..................................................................... 62
15 Appendix F: Impact-Feasibility Rubric .............................................................................................. 75
16 Appendix G: References and Data Sources ........................................................................................ 76
List of Tables
Table 1: Food Sources Categories .............................................................................................................. 16
Table 2: Food Access System Sector Players ............................................................................................. 17
Table 3: Alliance Representation by Sector ................................................................................................ 18
Table 4: High Cost of Living Limits Food Budgets ................................................................................... 25
Table 5: Other Top Challenges ................................................................................................................... 25
Table 6: Gaps in Vermont's Food System ................................................................................................... 26
List of Figures
Figure 1: Food Insecure Children Ineligible for Federal Nutrition Programs, 2019, Feeding America ....... 9
Figure 2: Childhood Poverty Levels ........................................................................................................... 10
Figure 3: Households Without a Vehicle .................................................................................................... 10
Figure 4: Social Vulnerability Indices for Monadnock Region Communities............................................ 11
Figure 5: Food Budget Shortfall for Food Insecure Individuals ................................................................. 12
Figure 6: Alliance Members’ Level of Food Security-Related Work......................................................... 18
Figure 7: Collaborative Activity Levels...................................................................................................... 19
Figure 8: Strength of Collaborative Relationships Among Alliance Members .......................................... 20
Figure 9: Collaborative Processes ............................................................................................................... 21
21 INTRODUCTION
Many families and children in the Monadnock Region experience food insecurity which is defined by the
U.S. Department of Agriculture (USDA) as a lack of consistent access to enough food for an active, healthy
life. According to Feeding America, the overall food insecurity rate in Cheshire County was 9.5% in 2019
and the rate for children was 12.7%.1 These rates are higher than the state averages which were 8.8% and
10.9% respectively. The rates for children in Sullivan and Hillsborough counties, which have communities
located in the Monadnock Region, were 14.4% and 10.9% respectively. Feeding America released a
companion study that illustrates the projected impact of the COVID-19 pandemic on local food insecurity
in 2020 and 2021.2 The 2021 projection for children in New Hampshire is 9.7%, an increase of 0.9% from
2019. The study states that the pandemic caused an economic recession that ended years of declining rates
of food insecurity in the United States. The report goes on to say that the increase in food insecurity during
the pandemic would likely have been worse without the response of federal and local governments and the
private sector.
The Feeding America study cautions, however, that, “… the future remains tenuous for people who have
experienced uncertain access to enough food for their families.” It took ten years after the 2008 Great
Recession for food insecurity rates in the United States to return to pre-recession levels. According to the
February 2020 New Hampshire Fiscal Policy Institute report, Food Insecurity and Economic Conditions
During the Great Recession and the COVID-19 Crisis, the situation could be even more tenuous for New
Hampshire residents if past experience is an indicator.3 The state’s pre-recession household food insecurity
levels recovered at a more gradual rate than the rest of the nation. The report concluded that to ensure
individuals and families are able to access food and mitigate increases in food insecurity during and after
the COVID-19 crisis, relevant policies and support programs for the people most affected will be needed.
The Monadnock Region Food Access Analysis provides a comprehensive analysis of assets and gaps in
present children’s and families’ food security programs in the Monadnock Region. The analysis was
conducted by Southwest Region Planning Commission (SWRPC) during the spring of 2021 on behalf of
the Monadnock Children’s Food Access Alliance (Alliance). This report includes the findings of the
analysis. The Alliance will use the report findings to develop a Food Access Plan that fills identified gaps
in programs and services and outlines funding opportunities.
The Alliance is a diverse network of partners committed to improving the overall health of children and
families in the Monadnock Region through increasing access to affordable, healthy food. Alliance partners
represent multiple sectors of the food access system including:
• Food Access System (e.g., farmers, extension educators, farmers’ market managers, transportation
agency managers, food retailers, food service directors, farm to institution program managers).
• Emergency Food (e.g., food pantry managers, soup kitchen coordinators).
• Food Access and Health (e.g., public health representatives, nutrition educators, human services
program managers, nutrition assistance programs, case/social workers).
• Food Policy (e.g., advocates, state and local government officials, food policy experts).
• Food Systems Research (e.g., professors, researchers).
1 Feeding America. 2019. “Map the Meal Gap”. https://map.feedingamerica.org/county/2019/child/new-hampshire
2 Feeding America. 2021. “The Impact of the Coronavirus on Local Food Insecurity in 2020 and 2021”.
https://www.feedingamerica.org/research/coronavirus-hunger-research
3 NH Fiscal Policy Institute. 2020. “Food Insecurity and Economic Conditions During the Great Recession and the COVID-19
Crisis.” https://nhfpi.org/resource/food-insecurity-and-economic-conditions-during-the-great-recession-and-covid-19-crisis/
3• People with Lived Experience (e.g., lower-income and food insecure household members).
Led by the Monadnock Farm and Community Coalition (MFCC), Alliance partners have a long history of
collaborating to develop a healthy, equitable and affordable food system in the Monadnock Region. The
MFCC also provides leadership to the Healthy Monadnock Alliance Food Access Working Group. The
Healthy Monadnock Alliance, which is supported by Cheshire Medical Center, is a partnership of
community leaders from across the Monadnock Region who create and foster local initiatives to achieve
better health and wellness for all. The activities of the Food Access Working Group, led to the creation of
the Alliance. The Working Group’s goals are to:
• Expand local food access to include low- and moderate-income families.
• Encourage support for the local food system.
• Educate consumers on the benefits of locally produced food, especially youth and lower-income
populations.
This report contains a detailed description of the present food access system in the Monadnock Region
including: 1) household food insecurity and related demographic data; 2) region-wide inventory of food
access points, programs, and services; 3) maps depicting connections and gaps within the food access
system; 4) Alliance network assessment; and, 5) description of food access system models and best
practices.
SWRPC recommends that this analysis be updated from time to time to reflect future changes to the current
food access system landscape. The COVID-19 pandemic influenced temporary changes to the food access
system before and during the period this analysis was conducted. In a December 2020 literature review
conducted by the University of New Hampshire Carsey School of Public Policy, it was reported that usual
food acquisition patterns were disrupted and household budgets were strained or depleted by job or wage
losses and medical expenses.4 Household budgets were further constrained by sharp increases in food
prices. As a result of social distancing requirements and recommendations, food insecure households were
challenged with navigating where and when to acquire food (e.g., limiting trips to retailers). In addition,
there were changes to the charitable food landscape including changes to hours of operation and closures,
either temporary or permanent, which further complicated access to food sites. More limited public
transportation and health concerns for older adults and other vulnerable populations may have also
contributed to reduced access to available food sites during the pandemic. Transit providers and volunteer
driver programs affiliated with the Monadnock Regional Coordinating Council for Community
Transportation reported significantly decreased ridership throughout the pandemic. During key informant
interviews and listening sessions, Alliance stakeholders reported decreases in usage of food access
programs and services during the pandemic.
4Jessica Carson and Sarah Boege. 2020. “The Intersection of Food Availability, Access, & Affordability with Food Security and
Health.” UNH Carsey School of Public Policy. https://nhchildrenshealthfoundation.org/assets/2021/02/Carsey_Food-Insecurity-
Literature-Review_Final_121720.pdf
42 KEY FINDINGS
Rates of Food Insecurity, Contributing Factors and Health Outcomes
• Childhood food insecurity rates in Cheshire and Sullivan counties are higher than the state average,
while in Hillsborough County rates are the same as the state average.
• Although community level food insecurity data are not available, it is for both poverty and lack of
transportation which can serve as proxy measures for food insecurity. Studies have found these
measures to be strong predictors of food insecurity.
• Poverty/low household income is the number one risk factor for food insecurity. Childhood poverty
rates are highest in the towns of Hinsdale, Winchester, Alstead, Richmond, and Stoddard. The
Alliance may want to consider these findings when prioritizing target communities for food access
interventions.
• Lack of transportation, specifically, lack of a car, is the number two risk factor for food insecurity.
The towns of Keene, Peterborough, Alstead, Sullivan, and Swanzey have the highest percentages
of households without vehicles.
• The average annual food budget shortfall reported by food insecure individuals in Cheshire,
Hillsborough and Sullivan counties is higher than the state average.
• Following the Great Recession, pre-recession household food insecurity levels recovered at a more
gradual rate in New Hampshire than the rest of the nation. A similar trend could occur as a result
of the COVID-19 pandemic and should be monitored.
• Households in sparsely populated rural areas spend a larger percentage of household income on
food than households in more densely populated/urban areas.
• Food insecurity can cause negative health outcomes in children such as decreased nutrient intakes,
birth defects, poor oral health, behavioral problems, asthma, greater risk of hospitalization, and
developmental problems.
Food Assistance Programs and Where People Shop for Food
• Children and families who are eligible are not enrolling in federal nutrition programs. More data
is needed to explain why. The Alliance should be alert to any new findings that emerge.
• Lower-income food insecure people who are not eligible for SNAP have difficulty buying food.
• Survey responses indicate that the vast majority of households typically shop at grocery stores to
purchase food (95%). This includes families enrolled in SNAP and tracks closely with national
trends.
• Research shows that SNAP households are located, on average, within two miles of a store that
accepts SNAP benefits. However, they will travel more than three miles to get to their primary
grocery store.
• While not as intensively researched as SNAP, evaluations of the National School Lunch and
Breakfast Programs have shown reductions in food insecurity among children, along with decreases
in obesity and improvements in overall health.
Inventory of Food Sources
• The inventory resulted in the identification of a total of 467 food sources across six categories.
• Farm food options are limited in the area where Sullivan, Cheshire, and Hillsborough counties
intersect.
5• Accessing food assistance can also be challenging in the area where Sullivan, Cheshire, and
Hillsborough counties intersect where SNAP and WIC sites are sparse.
Monadnock Children’s Food Access Alliance Network
• By June 2021, the Alliance had grown into a cross-sector network of 30 partners that serve as key
players in the Monadnock Region food access system.
• The Food Access/Health and Food System sectors are the most highly represented within the
Alliance with 53% and 23% of members respectively.
• Increased representation in the government sector may help the Alliance to have more influence on
policy at state and local levels.
• All partner organizations have some degree of their work that touches on addressing food
insecurity.
• The Community Kitchen, Southwestern Community Services and Monadnock Farm and
Community Coalition scored highest in their levels of collaborative activities with other network
partners.
Potential Strategies
• Conduct a joint outreach campaign with consistent messaging to increase awareness of SNAP,
WIC and other federal nutrition programs. Focus efforts in most vulnerable communities.
• Work collaboratively with DHHS to sign people up for SNAP and WIC.
• Support state, regional and local economic development efforts
• Support efforts to increase the minimum wage, as well as access to universal health care, affordable
housing and childcare.
• Partner with the Monadnock Regional Coordinating Council to expand community transportation
services, including volunteer driver programs and transit services.
• Integrate transportation services with nutrition incentives programs.
• Review results of the mobile food pantry survey conducted by MFCC and engage with
implementation efforts if results are favorable.
• Establish food buying clubs for people on SNAP, Electronic Benefits Transfer (EBT), etc.
• Establish a wholesale program with C&S Wholesale Grocers paired with local farm or food
distributers to integrate fresh produce in the program. This could reduce stigma and help lower
income people feel more empowered by purchasing food.
3 APPROACHES
In this analysis, both quantitative and qualitative methods are used to identify and analyze the prevalence
of household food insecurity and associated demographic and geographic characteristics in the Monadnock
Region. Quantitative and qualitative methods are also used to identify assets and gaps across the various
components of the food access system including food access points, federal food assistance programs,
emergency food programs, and other services that help people to access nutritious, affordable food.
Upstream factors such as household poverty and access to transportation, health care, and affordable
housing are analyzed to gain a better understanding of their impact on household food insecurity. The
analysis also includes an assessment of the Alliance partner network to identify silos within the network
and opportunities to improve collaboration. Using data collected from the food source inventory, maps
6were created to illustrate the geographic distribution of food access points and services by category as well
as service area gaps throughout the region.
Strategies for collecting and using quantitative data sources include:
• A literature scan for prior analyses as well as a review of national and New England-based food
access system models and best practice strategies.
• Requests for information at Alliance meetings and via survey.
• Consultation with subject matter experts and Alliance stakeholders.
• Collection and analysis of data from the U.S. Census, USDA and other sources which are cited
throughout and at the end of this report.
Qualitative data were collected through listening sessions, one-on-one interviews and surveys with key
stakeholders, including food insecure individuals and households. In addition, stakeholder meeting notes
and past reports developed by the Alliance were reviewed to gather additional relevant qualitative data.
SWRPC consulted the USDA Community Food Security Assessment Toolkit 5 and other resources to
develop the survey templates and interview and listening session guides. The USDA toolkit includes
standardized measurement tools for assessing various aspects of community food security. Alliance
partners were consulted for assistance with identifying data sources, including reports and data produced
by their organizations.
Multiple sets of questions were selected for use during listening sessions and interviews, and in surveys.
Questions for food access system stakeholders addressed three areas: community food security, the food
access system and the Alliance collaborative network. Questions for people with lived experience
addressed household food security, community food security, food shopping patterns, and household food
assistance.
A total of 196 stakeholders participated in the listening sessions, interviews and surveys. 161 of these
stakeholders participated in the Mobile Food Pantry Survey conducted by the Monadnock Farm and
Community Coalition in partnership with The Community Kitchen. The results of the survey were shared
with SWRPC and are included in this analysis. Appendix D includes a summary of the input gathering
activities. Survey templates and key informant interview and listening session guides are included in
Appendix E.
Care was taken to coordinate data collection efforts with the Mobile Food Pantry Feasibility Study that was
conducted during the same period as this food access analysis. This included coordinating stakeholder
outreach, surveys and other qualitative data collection activities between the two projects. In addition to
the overlapping project timelines, there was overlap in the organizations that were being solicited for
assistance with collecting data and information from their constituents. This occurred in two ways: 1)
maintaining ongoing communication between project leads to coordinate outreach to stakeholders and 2) a
joint decision to share data collected from the Mobile Food Pantry Survey, which included many of the
same questions as the food access analysis survey. The survey was targeted to food insecure households.
5
US Department of Agriculture. 2002. “USDA Community Food Security Assessment Toolkit.”
https://www.ers.usda.gov/publications/pub-details/?pubid=43179
73.1 KEY INFORMANT INTERVIEWS
A total of 11 key informant interviews were conducted with food access system stakeholders. Many of the
participants were partners in the Monadnock Children’s Food Access Alliance. Questions for food access
system stakeholders address three areas: community food security, the food access system and the Alliance
collaborative network.
3.2 LISTENING SESSIONS
Four listening and information gathering sessions were conducted during regularly scheduled Alliance
meetings. These were conducted in March, April, May, and June of 2021. These sessions were used to
gather additional information about community food security, the food access system and the Alliance
collaborative network. A combined survey and listening session was conducted at the June meeting to
gather information for the Alliance partner network assessment. Listening session participants represented
multiple stakeholder domains.
3.3 TARGETED SURVEYS
Surveys were targeted to people with lived experience, which include food insecure individuals and
households. The surveys were administered in-person at an event hosted by the Winchester ELMM Center
and electronically via the Mobile Food Pantry Survey. In addition to demographic and geographic data,
survey questions address household food security, community food security, food shopping patterns, and
household food assistance. A total of 265 participants responded to the surveys.
3.4 DATA SOURCES AND REVIEW OF PAST WORK
Appendix G includes a master list of data sources referenced for the food access analysis. Regional data
sources were identified with the assistance of Alliance partners. These include reports produced by Alliance
partner organizations. In addition, a review of past work was conducted, including a review of relevant
data and information gathered by the Alliance as well as documents created by the Healthy Monadnock
Alliance Food Access Working Group, including meeting discussion notes.
3.5 ASSET MAPPING
SWRPC developed a series of maps to illustrate locations of food sources and programs located throughout
the region. Household poverty and vehicle access are used as proxy measures for community level food
insecurity. The data for the maps was generated from the food source inventory. The maps are included
in Appendix C.
84 RATES OF FOOD INSECURITY AND CONTRIBUTING FACTORS
According to Feeding America, 40% of food insecure children in Cheshire County that are at or below
federal poverty level did not qualify for food assistance from federal nutrition programs in 2019 because
they did not meet the threshold eligibility requirements.6 The rates for Hillsborough and Sullivan Counties
were 40% and 27% respectively. Figure 1 indicates the percentages of children at or below federal poverty
level that are likely ineligible for federal nutrition programs for the three counties and the state.
Figure 1: Food Insecure Children Ineligible for Federal Nutrition Programs, 2019, Feeding America
Percentage of Children Ineligible for Food Assistance
45%
40% 40% 40%
40%
35%
30% 27%
25%
20%
15%
10%
5%
0%
Cheshire County Hillsborough County Sullivan County New Hampshire
Source: Feeding America, 2019
It is difficult to directly assess community level food insecurity because data are available at national, state
and county levels only. However, there are community level demographic measures that have been found
to be predictive of household food insecurity which are
USDA household food insecurity data
presented in detail later in this section. There is convincing
has a lag time and can’t get it below
evidence linking simple measures of total household income to county level. You have to use proxy
food security. Poverty is the number one predictor of increased measures because food insecurity data
risk for community level food insecurity among children and is not granular.
households. In 2019, more than one-in-three US households
with incomes below the official poverty line were food Alliance Stakeholder
insecure.7
Figure 2 below shows the percentage of five-year old children that are below poverty level for communities
in the region.
6 Feeding America. 2019. “Map the Meal Gap”. https://map.feedingamerica.org/county/2019/child/new-hampshire
7Alisha Coleman-Jensen, Matthew P. Rabbitt, Christian A. Gregory, and Anita Singh. 2019. “Household Food Security in the
United States in 2018.” Economic Research Report. 270. U.S. Department of Agriculture, Economic Research Service.
https://www.ers.usda.gov/publications/pub-details/?pubid=94848
9Figure 2: Childhood Poverty Levels
Source: 2019 American Community Survey Estimates
Note that Hinsdale, Winchester, Alstead, Richmond, and Stoddard have the highest childhood poverty rates
in the region. The Alliance may want to consider these findings when prioritizing target communities for
food access interventions.
Research identifies transportation access as relevant to food
People have food benefits but don’t
accessibility, linking both lack and cost of transportation to food
have transportation to get to services.
insecurity.8 Evidence reveals that, after poverty, “households We need to fund the costs of car
without vehicles” is the second leading risk factor for increased repairs, inspection and registration.
risk of food insecurity. 9 Figure 3 shows the percentages of
households without vehicles for communities in the region. Alliance Stakeholder
Figure 3: Households Without a Vehicle
Source: 2019 American Community Survey Estimates
8 Eona Harrison, Brandi Gilbert, Susan J. Popkin, and Elaine Waxman. 2019. “Tackling Food Insecurity by Bringing Data to
Communities”. Urban Institute. https://www.urban.org/research/publication/tackling-food-insecurity-bringing-data-communities
9 James D. Wright, Amy M. Donley, Marie C. Gualtieri, and Sara M. Strickhouser. 2016. “Food Deserts: What Is the Problem?
What Is the Solution?” Society 53(2):171–81. https://www.springerprofessional.de/en/food-deserts-what-is-the-problem-what-is-
the-solution/9831922
10Social vulnerability indices (SVI) indicate the degree to which a community exhibits certain social
conditions that predict communities’ vulnerability and resilience to public health threats, including food
insecurity. Figure 4 shows the communities in the region that ranked the highest in terms of social
vulnerability. The higher the value, the higher the level of social vulnerability. Those census tracts shaded
in dark green have the highest levels of social vulnerability. Those shaded in lighter greens have the next
highest levels of social vulnerability. As can be seen, the town of Winchester and census tract 9711 in
Keene ranked the highest in overall social vulnerability. As with poverty data, the Alliance can use this
information to target activities in communities that have the greatest need.
Figure 4: Social Vulnerability Indices for Monadnock Region Communities
Description Census Overall Socioeconomic Household Minority Housing Type
Tract Composition Status & &
& Disability Language Transportation
Greenville 185.01 0.6701 0.5876 0.4914 0.701 0.6048
Hillsborough, 255 0.5155 0.6529 0.8625 0.1031 0.4021
Windsor
Alstead, Gilsum, 9701 0.6151 0.6323 0.7973 0.1271 0.677
Marlow, Surry
Jaffrey 9705 0.7457 0.6151 0.866 0.5773 0.6392
Marlborough, Troy 9708 0.6598 0.4192 0.7045 0.5945 0.7766
Swanzey 9709 0.4777 0.5395 0.7182 0.4914 0.3093
Keene (north) 9710 0.701 0.1821 0.9347 0.8454 0.6667
Keene (east) 9711 0.8351 0.9175 0.8935 0.2955 0.646
Keene (center) 9713 0.6632 0.7045 0.512 0.7663 0.3849
Keene (south) 9714.01 0.6804 0.945 0.0275 0.433 0.8557
Hinsdale 9716 0.7079 0.8316 0.8522 0.3093 0.457
Winchester 9717 0.8797 0.9141 0.9519 0.0206 0.921
Source: Centers for Disease Control and Prevention, 2019
Appendix C includes three maps that depict visually the level of social vulnerability for each community
in the region.
The Carsey School of Public Policy’s (CSPP) December 2020 literature review, The Intersection of Food
Availability, Access, & Affordability with Food Security and Health, is an excellent source for exploring
the complex factors that contribute to household food insecurity, the impact of food insecurity on health
outcomes and the effectiveness of specific programs and initiatives in reducing food insecurity. In addition
to poverty and lack of transportation, the document addresses a range of socio-economic and health factors
within households that contribute to food insecurity. In the report, it was concluded that, “Generally, factors
that strain household budgets, like adding people to the household or losing a job, are associated with
increasing food insecurity, while factors that enhance household spending power, like having a working
teenager or receiving child support, reduce food insecurity. These influences converge simply because
food security comes with a price tag: food secure households spend about 20 percent more on food than
food insecure households with similar composition.”
Discussed in the CSPP report are other complex factors that are associated with very low food security in
low-income households. These include poor health, unmet medical needs, disability, and depressive
symptoms. Parents with poor physical and mental health may be other contributing factors in lower-income
11households with children. Substance misuse may be another factor. The Alliance may want to review the
2019 Monadnock Rural Communities Opioid Response Planning Project Needs Assessment Report to better
understand possible connections between substance misuse and food insecurity in the region. The analysis
was conducted by SWRPC on behalf of the Monadnock Rural Communities Opioid Response Project
Consortium. The analysis identified factors that contribute to substance misuse that are similar to those
associated with food insecurity, including poverty, lack of transportation, job loss, homelessness, and poor
physical and mental health. There may be opportunities for the Alliance to collaborate with the Consortium
in addressing these social determinants of health that contribute to both food insecurity and substance
misuse.
4.1 AFFORDABILITY OF FOOD
Collectively, food insecure individuals in Cheshire County reported a food budget shortfall of $4,347,000
in 2019 according to Feeding America.10 That means that the average annual food budget shortfall per food
insecure individual in Cheshire County was $604. The annual food budget shortfall represents the
additional dollar amount that food insecure individuals report needing, on average, to purchase just enough
food to meet their food needs. The average annual food budget shortfall reported by food insecure
individuals in Hillsborough and Sullivan Counties was $618 and $600 respectively. In comparison, the
average annual food budget shortfall reported by food insecure individuals statewide was $595, less than
in each of the three counties. Figure 5 indicates the average annual food budget shortfall reported by food
insecure individuals in the three counties and the state.
Figure 5: Food Budget Shortfall for Food Insecure Individuals
Average Annual Food Budget Shortfall for
Food Insecure Individuals
$620
$615
$610
$605
$600
$595
$604 $618 $600 $600
$590
Cheshire County Hillsborough County Sullivan County New Hampshire
Source: Feeding America, 2019
The CSPP literature review concluded that, “…food affordability is not a static characteristic of food or
food sources, but is best understood alongside characteristics of people, households, and communities.
Specifically, food affordability does not refer to the cost of food alone, but should also consider non-food
demands on household income, and the availability of nutrition supports to help defray those costs.” The
report goes on to say, “Most research on food insecurity and income does not attempt to explicitly measure
10 Feeding America. 2019. “Map the Meal Gap”. https://map.feedingamerica.org/county/2019/child/new-hampshire
12‘food affordability’.” The Supplemental Poverty Measure (SPM) helps to explain the relationship between
income and food insecurity.11 The SPM accounts for different stresses on household income such as job
loss.
The CSPP pointed out that, “There is no standard measure or threshold for delineating food costs as
“affordable” or not, and as a result, research seeking to quantify the role of affordability is not cohesive. In
contrast, the consumer-resource-related measure most clearly and explicitly linked to food insecurity is not
a complex measure of affordability that accounts for food prices, spending patterns, and resources, but
rather, is simply household income.”
In addition to household income, the rural nature of the
There are lots of interlocking problems
Monadnock Region is a factor the Alliance may want to
in rural areas. The needle hasn’t really
consider in its efforts to address issues of food affordability. moved a lot in such areas as minimum
Evidence suggests that food affordability varies between rural wages, high housing costs and fewer
and urban counties in the United States.12,13 One study found options for childcare.
that households in rural counties spent a larger percentage of
household income on food than households in urban counties.14 Alliance Stakeholder
This was due in part to the lower incomes among the rural
households. All of these factors are associated with lower food affordability. The study also found that
food became less affordable as the poverty rate increased. This was a function of households spending an
increasing share of household income on food. Yet another study found that rural county households spend
19 percent of income on food compared to 17 percent in urban counties.15 The study also found that rural
places have lower household incomes as compared to urban counties, as well as lower access to food
retailers, higher poverty rates, and lower average SNAP benefits per participant.
4.2 ADDRESSING FOOD INSECURITY THROUGH FEDERAL FOOD ASSISTANCE
PROGRAMS
There is evidence that the Supplemental Nutrition Assistance Program (SNAP) reduces food insecurity,
partly because it increases household food purchasing power. Households with SNAP benefits use SNAP
for more than 60 percent of their at-home food expenditures, which particularly benefit households with
children, lower-income households, and rural area households. 16,17 A study using US Census Bureau
household data found SNAP participation was associated with a 31 percent decrease in the likelihood of
11 Vanessa Wright, Neeraj Kaushal, Jane Waldfogel, and Irv Garfinkel. 2014. “Understanding the Link between Poverty and
Food Insecurity among Children: Does the Definition of Poverty Matter?” Journal of Children & Poverty 20(1):1–20.
https://www.ncbi.nlm.nih.gov/pmc/articles/PMC4096937/
12 Anne Cafer, Georgianna Mann, Sujith Ramachandran, and Michelle Kaiser. 2018. “National Food Affordability: A County-
Level Analysis.” Preventing Chronic Disease. https://www.cdc.gov/pcd/issues/2018/18_0079.htm
13 Frances Hardin-Fanning, and Mary Kay Rayens. 2015. “Food Cost Disparities in Rural Communities.” Health Promotion
Practice 16(3):383–91. https://pubmed.ncbi.nlm.nih.gov/25305093/
14 Anne Cafer and Michelle Kaiser. 2016. “An Analysis of Differences in Predictors of Food Affordability between Rural and
Urban Counties.” Journal of Poverty 20(1):34–55. https://www.tandfonline.com/doi/abs/10.1080/10875549.2015.1094760
15 Anne Cafer, Georgianna Mann, Sujith Ramachandran, and Michelle Kaiser. 2018. “National Food Affordability: A County-
Level Analysis.” Preventing Chronic Disease. https://www.cdc.gov/pcd/issues/2018/18_0079.htm
16 Anne Cafer and Michelle Kaiser. 2016. “An Analysis of Differences in Predictors of Food Affordability between Rural and
Urban Counties.” Journal of Poverty 20(1):34–55. https://www.tandfonline.com/doi/abs/10.1080/10875549.2015.1094760
17 Laura Tiehen, Constance Newman, and John A. Kirlin. 2017. The Food-Spending Patterns of Households Participating in the
Supplemental Nutrition Assistance Program: Findings From USDA’s FoodAPS. United States Department of Agriculture
Economic Research Service (ERS). https://www.ers.usda.gov/publications/pub-details/?pubid=84779
13being food insecure.18 Another study conducted by Mathematica Policy Research on behalf of the USDA
reported a 10.6 percentage point drop in food insecurity over a six month period, from 65.1 percent of
households at enrollment to 54.5 percent of those same households.19
Other food assistance programs have been found to be helpful in
reducing household food insecurity, although they have not been as We need better data at the state
intensively researched as SNAP. Evaluations of the National School level of use of food assistance
Lunch Program (NSLP) and School Breakfast Program have shown programs by children. if a kid
the programs found reductions in food insecurity, along with account in school is empty, no
one knows about it.
decreases in obesity and improvements in overall health among low-
income children.20,21 A study of the Expanded Food and Nutrition
Alliance Stakeholder
Program (EFNEP), which educates low-income, SNAP-eligible
families about nutrition and resource management found an increase
in food security in participants after taking the program.22 There is not sufficient evidence to suggest that
other food assistance programs have been effective in reducing food insecurity.
4.3 FOOD INSECURITY AND HEALTH OUTCOMES
Evidence shows that food insecurity is associated with negative health outcomes. There are numerous health
risks associated with food insecurity in children including lower nutrient intakes, birth defects, decline in
oral health, behavioral problems, asthma, greater risks of hospitalization, and cognitive problems.23,24 The
youngest children living in a food insecure households may experience early childhood development
delays.25
Food affordability can also impact child and family health. Affordable food helps families to purchase the
quantities of quality food they need to stay healthy. On the other hand, unaffordable food reduces available
resources for meeting healthcare-related expenses. Households may need to make trade-offs by spending
less on medical expenses to purchase food. For example, adults unable to meet both food and medication
18 Caroline Ratcliffe, Signe-Mary McKernan, and Sisi Zhang. 2011. “How Much Does the Supplemental Nutrition Assistance
Program Reduce Food Insecurity?” American Journal of Agricultural Economics 93(4):1082–98.
https://www.ncbi.nlm.nih.gov/pmc/articles/PMC4154696/
19 James Mabli, Jim Ohls, Lisa Dragoset, Laura Castner, and Betsy Santos. 2013. “Measuring the Effect of Supplemental
Nutrition Assistance Program (SNAP) Participation on Food Security.” Mathematica Policy Research.
https://www.fns.usda.gov/snap/measuring-effect-snap-food-security
20 Craig Gundersen, Brent Kreider, and John Pepper. 2012. “The Impact of the National School Lunch Program on Child Health:
A Nonparametric Bounds Analysis.” Journal of Econometrics 166(1):79–91.
https://www.sciencedirect.com/science/article/abs/pii/S0304407611001205
21 Judith S. Bartfeld, and Hong-Min Ahn. 2011. “The School Breakfast Program Strengthens Household Food Security among
Low-Income Households with Elementary School Children.” The Journal of Nutrition 141(3):470–75.
https://pubmed.ncbi.nlm.nih.gov/21228262/
22 Jamie A Farrell, Loraine S. Cordeiro, Jing Qian, Lisa Sullivan-Werner, and Jerusha L. Nelson-Peterman. 2018. “Food
Affordability, Food Security, and the Expanded Food and Nutrition Education Program.” Journal of Hunger & Environmental
Nutrition 13(2):180–91. https://www.tandfonline.com/doi/abs/10.1080/19320248.2017.1315326
23 Craig Gundersen and James P. Ziliak. 2015. “Food Insecurity and Health Outcomes.” Health Affairs 34(11):1830–39.
https://www.healthaffairs.org/doi/10.1377/hlthaff.2015.0645
24 Shilpa Pai and Kandy Bahadur. 2020. “The Impact of Food Insecurity on Child Health.” Pediatric Clinics 67(2):387–96.
https://pubmed.ncbi.nlm.nih.gov/32122567/
25 Jessica Pedroso, Gabriela Buccini, Sonia Isoyama Venancio, Rafael Pérez‐Escamilla, and Muriel Bauermann Gubert. 2020.
“Maternal Mental Health Modifies the Association of Food Insecurity and Early Child Development.” Maternal & Child
Nutrition. https://onlinelibrary.wiley.com/doi/full/10.1111/mcn.12997
14needs may be forced to make difficult choices. One analysis found that food insecure adults with chronic
diseases stretched their budgets through medication underuse.26
In terms of overall health, there is consistent evidence that SNAP participation has positive effects. SNAP
participants report better self-rated health than their low-income non-SNAP counterparts. SNAP
participation is associated with lower health care expenditures (by around $1,400 annually per person) and
fewer doctors’ office visits, despite reporting more well visits, compared with non-SNAP low-income
adults. One study analyzed monthly Medicaid discharge data in Massachusetts from both before and after
the state increased SNAP benefits in 2009, finding that after the benefits increase, Medicaid cost-growth
fell by 73 percent. A reduction in hospital admissions following the SNAP increase was largely responsible
for the declining Medicaid costs. Similarly, a study of low-income older adults enrolled in both Medicare
and Medicaid in Maryland found that SNAP participation and higher benefit amounts were associated with
lower hospital utilization, although not with lower emergency department use.27
Based on these findings as well as those indicated in the above section, the Alliance should consider
focusing on strategies to increase SNAP participation as an effective way to both decrease childhood food
insecurity and improve health outcomes.
5 INVENTORY OF FOOD SOURCES
A comprehensive inventory was developed to help the Alliance understand both the distribution and
availability of food options across the Monadnock Region and gaps that exist within the overall food access
system. The inventory includes food access points and services that serve the region. CSPP is to be
acknowledged for providing many of the data sets which were used to produce the 2019 report, Mapping
the Food Landscape in New Hampshire.28 More than 4,000 food sites statewide are captured in the CSPP
report, including sites in the Monadnock Region. The report’s author, Jessica Carlson, first obtained data
through a marketing database, which provided a starting point for the list of food sites. These data were
then augmented by and checked for accuracy against food protection data held by the state, data from the
USDA Food and Nutrition Service, and data from various New Hampshire-based websites (e.g., Made in
New Hampshire).
SWRPC examined additional data sources to confirm that the sites listed in the CSPP report were up to date
and to identify congregate meal sites which were not addressed in the CSPP report. These include the UNH
Food Access Map, NH Department of Education, NH Food Bank, NH Department of Agriculture, NH
Department of Health and Human Services Women, Infants and Children Nutrition Program (WIC) and
Supplemental Nutrition Assistance Program (SNAP), and data compiled by Alliance partners.
Table 1 indicates the food source categories that were used to create the inventory. Most of the categories
were used by the CSPP in the Mapping the Food Landscape in New Hampshire report.
26 Seth A. Berkowitz, Hilary K. Seligman, and Niteesh K. Choudhry. 2014. “Treat or Eat: Food Insecurity, Cost-Related
Medication Underuse, and Unmet Needs.” The American Journal of Medicine 127(4):303-310.e3.
https://pubmed.ncbi.nlm.nih.gov/24440543/
27 Laura Samuel, Sarah L. Szanton, Rachel Cahill, Jennifer L. Wolff, Pinchuan Ong, Ginger Zielinskie, and Charles Betley. 2018.
“Does the Supplemental Nutrition Assistance Program Affect Hospital Utilization Among Older Adults? The Case of Maryland.”
Population Health Management 21(2):88–95. https://www.ncbi.nlm.nih.gov/pmc/articles/PMC5906726/
28 Jessica Carson. 2019. “Mapping the Food Landscape in New Hampshire.” UNH Carsey School of Public Policy.
https://carsey.unh.edu/publication/mapping-food-landscape-NH
15Table 1: Food Sources Categories
Category Subcategory
Nonfarm Retail Food Sites Grocery stores, convenience stores, non-traditional food outlets, specialty
fresh food outlets.
Farm Retail Food Sites Farmers markets, farm stands, community supported agriculture sites.
Retail Sites Accepting SNAP Nonfarm and farm retail sites.
and WIC
Food Pantries Food Pantries.
Food Support Sites for Special National School Lunch Program (NSLP), Child and Adult Care Food Program
Populations (CACFP), Summer Food Service Program, Fresh Fruit & Vegetable Program,
Afterschool Snack Program, Congregate Meals.
Federal Nutrition Application Federal Nutrition Programs (SNAP, CSFP, WIC, SFSP, TANF, TEFAP).
Sites
A complete list of food sources is included in Appendix B. Maps illustrating the inventory results are
included in Appendix C. The series of maps display all of the food sources located in the region. New
Hampshire retail food sites located 10-miles beyond the Monadnock Region’s borders were included in the
inventory and maps. They were included to address the assumption that Monadnock Region residents,
especially those living near the region’s borders, travel outside the region to shop at grocery stores and
other retail food sites that are located closer to their homes. As previously mentioned, Appendix C includes
three maps that depict visually the level of social vulnerability for each community in the region. The top
two social determinants that have been found to be the most predictive of increased risk for food insecurity
among children are poverty and households without vehicles.29
A number of factors that are likely to have an impact on household food insecurity in the region were
considered when conducting and analyzing the food sources inventory. It is recommended the Alliance
take these factors into consideration when developing the Monadnock Region Food Access Plan. The
factors include data and information pertaining to food affordability, access and availability; key social
determinants that have been found to be predictors of household food insecurity; rural nature of the region;
impact of COVID-19 pandemic; and Monadnock Region-specific findings from the CSPP Mapping the
Food Landscape in New Hampshire report.
Findings and observations that arose while conducting the food sources inventory are included in Section
8 of this report. However, there are two notable findings in the CSPP report related to availability of farm
food and accessing food support in the region that warrants mentioning here. First, farm food options are
limited in the area where Sullivan, Cheshire, and Hillsborough Counties intersect. According to the report,
“These sites include intermittent farmers’ markets, seasonal or year-round farm stands, and farms that offer
bundles of produce directly to customers during the growing season, called community supported
agriculture, or CSAs.” Second, accessing food support can be challenging in the area where Sullivan,
Cheshire, and Hillsborough Counties intersect where SNAP and WIC sites are sparse.
29Vanessa Wright, Neeraj Kaushal, Jane Waldfogel, and Irv Garfinkel. 2014. “Understanding the Link Between Poverty and
Food Insecurity in Children: Does the Definition of Poverty Matter?” Journal of Children and Poverty. 20(1): 1-20.
https://www.ncbi.nlm.nih.gov/pmc/articles/PMC4096937/
166 MONADNOCK CHILDREN’S FOOD ACCESS ALLIANCE
NETWORK
SWRPC conducted an assessment of the Alliance partner network. The assessment consisted of the
following activities:
1. Compile a list of all participating organizations and describe their roles within the network.
2. Conduct a survey, key informant interviews and listening session to:
a. Measure alignment of partner organization missions with the issue of food insecurity.
b. Assess level of collaboration among Alliance partners.
c. Identify aspects of the collaborative process that could contribute to the potential success
of the Alliance.
3. Identify connections and silos within the network.
4. Assess community and partner readiness.
The assessment results will help the Alliance to:
• Visualize and explore relationships among partners as well as the structural strengths and
weaknesses of the network.
• Develop strategies to overcome gaps within the network to better serve the needs of food insecure
children and households in the region.
• Build relationships and a system to share resources and knowledge across the network.
• Unite the efforts of multiple initiatives, organizations and agencies working on increasing access
to affordable, healthy food in the region.
6.1 KEY PLAYERS
By June 2021, the Alliance had grown into a cross-sector network of 30 partners that serve as key players
in the Monadnock Region food access system. They have demonstrated a strong commitment to focus their
collective expertise and resources on improving the overall health of children and households through
increasing access to affordable, healthy food. Appendix A includes a complete list of Alliance partners
along with descriptions of their organizational missions, populations and geographic areas served, program
and service eligibility criteria, and the roles they play in the food access system. A review of the list of
Alliance partners reveals that all five sectors of the food access system are represented, with some sectors
more highly represented than others. Table 2 lists the five sectors and describes the types of representatives
that are included in each.
Table 2: Food Access System Sector Players
Sector Types of Representatives
Food System Farmers, extension educators, farmers’ market managers, transportation agency
managers, grocery/convenience store managers/owners, food service directors.
Emergency Food Food bank & food pantry managers, soup kitchen coordinators.
Food Access and Health Public health representatives, nutrition educators, human services program
managers, nutrition assistance programs, welfare office staff, case/social workers.
Food Policy Advocates, state & local government officials, food policy council members, economic
development department directors.
Food System Research Professors, researchers.
17You can also read