The Family: America's Smallest School - Policy Information Report
←
→
Page content transcription
If your browser does not render page correctly, please read the page content below
Policy Information Report

The Family: America’s Smallest School
This report was written by:            Table of Contents
Paul E. Barton
Richard J. Coley
                                       Preface ............................................................................................................2
Educational Testing Service
                                       Acknowledgments ..........................................................................................2
The views expressed in this report
are those of the authors and do not    Highlights .......................................................................................................3
necessarily reflect the views of the   Introduction ...................................................................................................6
officers and trustees of Educational
Testing Service.                       The Parent-Pupil Ratio ..................................................................................8

Additional copies of this report can            What Research Reveals . ......................................................................8
be ordered for $15 (prepaid) from:              Out-of-Wedlock Births .......................................................................10
Policy Information Center                       Number of Parents in the Home .......................................................11
Mail Stop 19-R
Educational Testing Service                     The New Inequality ............................................................................13
Rosedale Road                          Family Finances ...........................................................................................14
Princeton, NJ 08541-0001
(609) 734-5212
                                                Median Family Income ......................................................................15
pic@ets.org                                     Children Living in Poverty . ...............................................................16
Copies can be downloaded from:                  Food Insecurity ..................................................................................17
www.ets.org/research/pic
                                                Parent Employment ...........................................................................17
                                       Literacy Development in Young Children ..................................................19
Copyright © 2007 by
                                                Early Language Acquisition ..............................................................19
Educational Testing Service.
All rights reserved. Educational                Reading to Young Children ...............................................................20
Testing Service, ETS, and the ETS
                                       The Child Care Dimension ..........................................................................23
logo are registered trademarks of
Educational Testing Service                     A Look at Day Care for the Nation’s 2-Year-Olds . ............................23
(ETS). LISTENING. LEARNING.
                                                       Type of Day Care ........................................................................24
LEADING. is a trademark of ETS.
                                                       Quality of Day Care . ..................................................................25
September 2007
Policy Evaluation and                  The Home as an Educational Resource .....................................................26
 Research Center                                Literacy Materials in the Home . .......................................................26
Policy Information Center
Educational Testing Service                     Technology . ........................................................................................27
                                                A Place to Study .................................................................................28
                                                Dealing With Distractions . ................................................................28
                                       The Parent–School Relationship . ...............................................................32
                                                Getting Children to School ................................................................32
                                                Parent Involvement in School ...........................................................34
                                       Putting It Together: Estimating the Impact of
                                       Family and Home Factors on Student Achievement .................................37
                                       Concluding Comments ................................................................................39
                                       Appendix Table . ...........................................................................................42
Preface

All parents have witnessed their children doing things,        The authors of this report, Paul Barton and Richard
good and bad, which remind them of themselves.              Coley, tell us how we benefit from paying attention
These incidents serve as powerful reminders of the          to the role of our families. They examine many facets
critical role parents play as teachers. Indeed, “the        of children’s home environment and experiences that
apple does not fall far from the tree,” as the foundation   foster cognitive development and school achievement,
established and nurtured at home goes a long way            from birth throughout the period of formal schooling.
in ensuring student achievement in school as well as        They stress that we should think of strengthening
success in later life. The important educational role       the roles of both schools and families, that schools
of parents, however, is often overlooked in our local,      need parents and communities as allies, and that
state and national discussions about raising student        recognizing the importance of the role families play
achievement and closing achievement gaps.                   should in no way lessen the need to improve schools.
   One of the four cornerstones of The Opportunity             The report also reveals the complexity of any
Compact, the National Urban League’s Blueprint for          effort to strengthen the role that families play in
Economic Equality, is the Opportunity for Children          educating children, the many levels on which such
to Thrive. Through this guiding principle, we assert        efforts need to take place, and the sensitivity that is
that every child in America deserves to live a life free    necessary whenever we contemplate the formation
of poverty that includes a safe home environment,           and functioning of families — our most important
adequate nutrition and affordable quality health care.      institution, and at the same time our most private one.
We further assert that all children in America deserve
                                                               The National Urban League commends Educational
a quality education that will prepare them to compete
                                                            Testing Service for this timely and critically important
in an increasingly global marketplace.
                                                            report and joins it in urging parents, educators,
   For the Opportunity to Thrive to be realized, and        administrators and policymakers to consider its findings.
for us as a nation to reach the ambitious educational
goals that we have set for ourselves, we must keep
clear in our minds that our family is our first and         Marc H. Morial
smallest school.                                            President and CEO
                                                            National Urban League

Acknowledgments

This report was reviewed by Carol Dwyer, Distin-            Institution; and Andrew J. Rotherham, Co-Founder and
guished Presidential Appointee at ETS; Drew Gitomer,        Co-Director, Education Sector. The report was edited
Distinguished Presidential Appointee at ETS; Laura          by Amanda McBride. Christina Guzikowski provided
Lippman, Senior Program Area Director and Senior            desktop publishing. Marita Gray, with the help of her
Research Associate at Child Trends; Isabel V. Sawhill,      5-year-old son, Ryan, designed the cover. Errors of fact
Senior Fellow and Cabot Family Chair at the Brookings       or interpretation are those of the authors.
Highlights

The family and the home are both critical education                             Asian-American families without children. The
institutions where children begin learning long before                          opposite is true for Black and Hispanic families,
they start school, and where they spend much of their                           however; and these families have much lower
time after they start school. So it stands to reason that                       average family incomes than their White and
improving a child’s home environment to make it more                            Asian-American counterparts. There are also large
conducive to learning is critical if we are to improve                          differences in family income across the states,
the educational achievement of the nation’s students                            ranging from median family incomes in excess
and close the achievement gaps. To do this, we need                             of $70,000 in several northeastern states to less
to develop cooperative partnerships in which families                           than $40,000 in New Mexico, Mississippi, and
are allies in the efforts of teachers and schools. The                          Washington, D.C.
kinds of family and home conditions that research
                                                                            • Nationally, 19 percent of children live in poverty.
has found to make a difference in children’s cognitive
                                                                              The percentages increase to nearly a third or more
development and school achievement include those
                                                                              of Black, American Indian/Alaskan Native, and
highlighted below.1
                                                                              Hispanic children. Among the states, the percentage
The Parent-Pupil Ratio. The percentage of two-                                ranges from a low of 9 percent in New Hampshire
parent families has been in long-term decline. Single-                        to a high of 31 percent in Mississippi.
parent families are rapidly becoming a significant
                                                                            • Nationally, 11 percent of all households are “food
segment of the country’s family population.
                                                                              insecure.” The rate for female-headed households is
• Forty-four percent of births to women under age                             triple the rate for married-couple families, and the
  30 are out-of-wedlock. The percentage is much                               rate for Black households is triple the rate for White
  higher for Black women and much lower for Asian-                            households. One-third or more of poor households
  American women. While the percentage decreases                              are food insecure.
  as women’s educational attainment rises, the rate
                                                                            • Rates of parent unemployment are high, and are
  for Black and Hispanic college-educated women
                                                                              alarmingly so for some groups. Nationally, one-
  remains high.
                                                                              third of children live in families in which no parent
• Sixty-eight percent of U.S. children live with two                          has full-time, year-round employment. This is the
  parents, a decline from 77 percent in 1980. Only                            case for half of Black and American Indian/Alaskan
  35 percent of Black children live with two parents.                         Native children. More than 40 percent of children in
  In selected international comparisons, the United                           Alaska, New Mexico, Louisiana, and Mississippi live
  States ranks the highest in the percentage of single-                       in such families.
  parent households, and Japan ranks the lowest.
                                                                            Literacy Development. Literacy development begins
Family Finances. Income is an important factor in                           long before children enter formal education, and is
a family’s ability to fund the tangible and intangible                      critical to their success in school.
elements that contribute to making the home an
                                                                            • There are substantial differences in children’s
educationally supportive environment. At all income
                                                                              measured abilities as they start kindergarten. For
levels, however, parents have important roles to play
                                                                              example, average mathematics scores for Black and
in facilitating their children’s learning, many of which
                                                                              Hispanic children are 21 percent and 19 percent
are not dependent upon the availability of money.
                                                                              lower, respectively, than the mathematics scores of
• Among racial/ethnic groups, Asian-American                                  White children.
  families, on average, have the highest median family
                                                                            • By age 4, the average child in a professional family
  income; Black families have the lowest.
                                                                              hears about 20 million more words than the average
• On average, White and Asian-American families                               child in a working-class family, and about 35 million
  with children have higher incomes than White and                            more words than children in welfare families.

1
    Readers will find sources for the data and definitions of the variables discussed in this section in the main body of the report.
• Sixty-two percent of high socioeconomic status             a television on a given day, while 59 percent of their
  (SES) kindergartners are read to every day by their        Black peers do so.
  parents, compared to 36 percent of kindergartners
                                                           • A comparison of eighth-graders in 45 countries
  in the lowest SES group. White and Asian-American
                                                             found that U.S. students spend less time reading
  children, those who live with two parents, and
                                                             books for enjoyment and doing jobs at home than
  children with mothers with higher education levels
                                                             students in the average country participating in the
  were also more likely to have a parent read to them
                                                             study. On the other hand, U.S. eighth-graders spent
  daily than their counterparts who were Black or
                                                             more time, on average, watching television and
  Hispanic, lived with one parent, or had mothers
                                                             videos, talking with friends, and participating in
  with lower educational levels.
                                                             sports activities. They also spend almost one more
Child Care Disparities. The availability of high-            hour daily using the Internet.
quality child care is critical when parents work outside
                                                           • One in five students misses three or more days of
the home.
                                                             school a month. Asian-American students have the
• About half of the nation’s 2-year-olds are in some         fewest absences. The United States ranked 25th of
  kind of regular, nonparental day care, split among         45 countries in students’ school attendance.
  center-based care; home-based, nonrelative care;
                                                           The Parent-School Relationship. A significant body
  and home-based relative care. Black children are
                                                           of research indicates that when parents, teachers, and
  the most likely to be in day care.
                                                           schools work together to support learning, students
• Overall, 24 percent of U.S. children were in center-     do better in school and stay in school longer. Parental
  based care that was rated as high quality, 66 percent    involvement in student education includes everything
  were in medium-quality center-based care, and 9          from making sure children do their homework,
  percent were in low-quality center-based care. Of        to attending school functions and parent-teacher
  those in home-based care, 7 percent were in high-        conferences, to serving as an advocate for the school,
  quality settings, 57 percent were in medium-quality      to working in the classroom. How involved are parents
  settings, and 36 percent were in low-quality care.       in their children’s education? Are schools helping to
  More than half of Black, Hispanic, and poor 2-year-      facilitate parental involvement, and doing what they
  olds were in low-quality home-based care.                can to effectively partner with parents?
The Home as an Educational Resource. The                   • Since 1996, parents have become increasingly
resources available at home — books, magazines,              involved in their child’s school. However, parent
newspapers, a home computer with access to the               participation decreases as students progress
Internet, a quiet place for study — can have a lasting       through school, and parents of students earning A
influence on a child’s ability to achieve academically.      averages are more likely to be involved in school
                                                             functions than the parents of students earning C’s
• As of 2003, 76 percent of U.S. children had
                                                             and D’s.
  access to a home computer, and 42 percent used
  the Internet. Black and Hispanic children lagged         Putting It Together: Estimating the Impact of
  behind, however.                                         Family and Home on Student Achievement.
                                                           How closely can stars in this constellation of factors
• Eighty-six percent of U.S. eighth-graders reported
                                                           associated with a child’s home environment predict
  having a desk or table where they could study, just
                                                           student achievement?
  above the international average but well below the
  averages of many countries.                              • The analysis provided here uses four family/home
                                                             factors that previous research has shown to be
• Thirty-five percent of eighth-graders watch four or
                                                             linked to student achievement. To some degree,
  more hours of television on an average weekday.
                                                             each is likely to be related to the others: single-
  Comparisons by race/ethnicity reveal considerable
                                                             parent families, parents reading to young children
  differences in viewing habits: 24 percent of White
                                                             every day, hours spent watching television, and the
  eighth-graders spend at least four hours in front of
                                                             frequency of school absences.
• Together, these four factors account for about
  two-thirds of the large differences among states
  in National Assessment of Educational Progress
  (NAEP) eighth-grade reading scores.
                       * * * * *
    The nation has set high goals for raising student
achievement. Schools play a critical role in this effort,
and it is appropriate that a serious national effort
is being made to improve them. However, family
characteristics and home environment play critical roles
as well. Reaching our ambitious national goals will
require serious efforts to address issues on both fronts.
Introduction

Recognizing the family as the basic socializing and                      to promote the value of early childhood education,
nurturing institution for children is intuitive. Common                  new commission reports, and more national leaders
sense tells us that the love and attention that babies                   pushing for universal pre-kindergarten programs.
and children receive, their sense of security, the                       These efforts all stem from an explicit recognition
encouragement they are given to learn, the intellectual                  of the need to supplement family efforts if we are to
richness of their home environment, and the attention                    succeed in improving student learning and reducing
that is devoted to their health and welfare are all                      achievement gaps.
critical elements in the development of children who
                                                                            A new report card by UNICEF on the state of
are able and motivated to learn. Ironically, however,
                                                                         childhood in the world’s economically advanced
something so plain and obvious is often overlooked
                                                                         nations paints a bleak picture for the future of
— or taken for granted.
                                                                         education in the United States. In the report, UNICEF
    Even though public officials, PTA speakers,                          compared the United States with 20 other rich
    educators … often tell us how important a                            countries on their performance in six dimensions
    role the family plays, this message does not                         of child well-being. The United States ranks in the
    translate to a national resolve to improve the                       bottom third of these 21 countries for five of these six
    family as an educational institution.                                dimensions. It ranked 12th in educational well-being,
                                                                         17th in material well-being, 20th in family and peer
   Thus began our 1992 report, America’s Smallest
                                                                         relationships, 20th in behaviors and risks, and 21st in
School: The Family.2 Although the critical importance
                                                                         health and safety.3
children’s families play in their lives in the years
preceding school, during the hours before and after                         Despite these disturbing findings, one can find
the school day, and throughout the days, weeks,                          many good examples of efforts to promote stronger
and months of summer and holiday breaks remains                          family involvement in children’s education, and this
apparent, it also stays largely outside current local,                   report describes some of these. Although our review of
state, and national education policy discussions. The                    current literature identifies many other constructive
purpose of this report is to examine information and                     efforts to improve family and home conditions
evidence regarding the critical role the family plays in                 associated with child development, no major efforts
the education of the nation’s children.                                  were found to raise the prominence of “before-school”
                                                                         and “after-school” issues, identified in this report, in
   Over the past 15 years, state and national efforts
                                                                         the very visible state and national efforts to increase
to raise student achievement and reduce achievement
                                                                         achievement and reduce achievement gaps.
gaps have intensified. The public and public officials
take the issue of improving education seriously, as is                      This report is about the family, not about the
strongly evidenced by the prominence of the No Child                     schools, except in those critical areas where the
Left Behind (NCLB) Act in the national policy agenda.                    family and school must work together. That said, the
NCLB includes requirements for schools to promote                        authors have no intention of minimizing the need
and facilitate stronger school-parent partnerships.                      for improving our nation’s schools — and it would be
                                                                         a misuse of the report’s findings to argue that all of
   Since America’s Smallest School: The Family was
                                                                         the responsibility for educational improvement rests
published, not much seems to have changed with
                                                                         outside of the schools. Indeed, a number of ETS Policy
respect to the importance public policy gives to the
                                                                         Information Center reports have argued that both are
family’s role in children’s learning, even as efforts have
                                                                         important in raising achievement and reducing gaps.
intensified to raise student achievement and reduce
                                                                         A comprehensive review of the available facts and
achievement gaps. Nor has there been much progress
                                                                         evidence on this subject is Parsing the Achievement
toward improving many of the conditions that were
                                                                         Gap: Baselines for Tracking Progress.4
described in that report. There are, to be sure, efforts
2
  Paul E. Barton and Richard J. Coley, America’s Smallest School: The Family, Policy Information Report, Policy Information Center,
  Educational Testing Service, 1992.
3
   See UNICEF, Child Poverty in Perspective: An Overview of Child Well-Being in Rich Countries, Innocenti Report Card 7, 2007.
4
   Paul E. Barton, Parsing the Achievement Gap: Baselines for Tracking Progress, Policy Information Report, Policy Information Center, Educa-
  tional Testing Service, October 2003.
It is understandable that education reform efforts       subgroups. The authors also discuss how reading to
would focus on improving schools. In the broader            young children influences their language development.
arena of public policy, however, we will have to go far
                                                            The Extended Family: The Child Care Dimension.
beyond this focus if we hope to significantly improve
                                                            The report looks at the wide variety of child care
student learning and reduce the achievement gap.
                                                            available to parents, and the vast differences in the
This report highlights some of the important family
                                                            quality of that care.
characteristics and home conditions that research
has found makes a significant difference in children’s      The Home as an Educational Resource. A home
cognitive development and school achievement.               environment that is conducive to learning is critical
Because the home is, indeed, “America’s smallest            to children’s ability to succeed in school. The authors
school” — though clearly not its least significant one      examine the importance of resources and conditions that
— it behooves us to take whatever steps are necessary       support learning in the home (e.g., appropriate reading
to assure the homes of all of our nation’s students can     materials, a home computer with access to the Internet,
provide the critical support children need to achieve. If   and a quiet place to study). The authors also look at
we are to improve America’s academic standing within        conditions that can distract students from learning, such
the global community, and close our all-too-persistent      as spending too much time watching television, playing
achievement gaps, we must help ensure nurturing             computer games, and surfing the Internet. Finally, the
home environments and supportive, encouraging               authors examine trends related to these factors across
family lives for all students.                              different racial/ethnic and socioeconomic groups.

   This is by no means a small endeavor. It will require    The Parent-School Relationship. The authors
policy reform, government and social interventions,         examine why it’s important for parents to be involved in
and above all, cooperative partnerships among               their children’s school and to take a proactive approach
schools, families, and communities.                         to encouraging their children’s learning efforts. The
                                                            authors then highlight trends in these behaviors.
                       * * * * *
                                                            Putting It Together: Estimating the Impact of
The report is organized as follows:
                                                            Family and Home on Student Achievement. The
The Parent-Pupil Ratio. Research indicates an               authors explore how a constellation of family and
upward trend in single-parent families and large            home characteristics can be used to predict student
differences in family-composition trends across             achievement.
racial/ethnic and socioeconomic groups. The report
                                                            Concluding Comments. The authors discuss what family
examines these changing patterns and explains how
                                                            trends imply about the future state of student learning
they may be leading to a “new inequality.”
                                                            in the United States. They then elaborate on the need to
Family Finances. Many families are stretched thin in        improve conditions in both the home and the school.
meeting the basic needs that will help children become
                                                                                   * * * * *
successful students. The report looks at economic
trends related to child poverty, parent employment,         This report is packed with statistics and research
and food insecurity.                                        findings, and the authors have drawn upon many
                                                            sources — from small research studies, to national
Literacy Development. Children’s experiences during
                                                            censuses and data bases, to international surveys.
the first years of their lives — their interactions with
                                                            Readers will have different interests, different
the people and world around them — are critical
                                                            perspectives, and different needs. The authors hope
to their future learning. The report examines the
                                                            that the information in this publication will be helpful
differences in early language development and school
                                                            to a diverse audience — an audience with a common
readiness among children of different population
                                                            interest in improving student learning and reducing
                                                            achievement gaps.
The Parent-Pupil Ratio

Our society relies on parents to nurture and socialize                  obstacles to the future and well-being of
children. It follows then that having two parents                       millions of children. The problems are much
participating in the child-rearing effort is better than                more acute among black children …. The
having just one, even if only from the standpoint of                    disadvantage of black children relative to
logistics and time: time to talk with children, read to                 white children is due almost entirely to the low
them, help them with homework, get them up and off                      income of black family heads … Approximately
to school, check their progress with their teachers, and                one-half of black children have the additional
so on.                                                                  burden of having mother-only families. Many
                                                                        begin life with an under-educated teenage
    Two-parent families are more likely than single-
                                                                        mother, which increases the likelihood that
parent families to be participating in the workforce
                                                                        they will live in poverty and raises additional
and to have middle-class incomes. Today, having a
                                                                        impediments to their life prospects.6
“decent” family income is more dependent than ever
on having two parents working. Families headed only                     The most recent and large-scale synthesis of
by mothers — as the majority of single-parent families              research on single-parent families in the United States
are — have, on the average, much lower incomes                      is “Father Absence and Child Well-Being” by Wendy
and fewer benefits that go along with employment                    Sigle-Rushton and Sara McLanahan, who start with
(such as medical insurance) than two-parent families.               this overview:
Adequate housing, medical care, and nutrition
                                                                        Cohabitation has replaced marriage as
contribute to children’s cognitive development and
                                                                        the preferred first union of young adults;
school achievement.5 While logic, common sense,
                                                                        premarital sex and out-of-wedlock childbearing
and research all lead to the conclusion that children
                                                                        have become increasingly commonplace and
growing up with one parent may have a disadvantage,
                                                                        acceptable; and divorce rates have recently
it is often not an easy subject to discuss.
                                                                        plateaued at very high levels. One out of three
                                                                        children in the United States today is born
What Research Reveals
                                                                        outside of marriage, and the proportion is
Despite continuing sensitivity about the topic, there                   twice as high among African Americans.7
is a growing body of research on family structure and
its relationship to children’s well-being. While the                   Researchers must consider several issues when
research generally focuses on whether a child lives                 assessing the impact growing up in a single-parent
with one versus two parents, there is some research                 family can have on children’s academic success. First
on the effects of mother-only families; some research               they need to determine whether children raised in
on children with divorced parents; some on children                 single-parent households are different from those who
with young, unmarried parents; and some research                    grow up with two parents in the home in ways that
that focuses on the effects on children of growing up               affect learning and academic success. And, if they do,
with absent fathers. The first comprehensive reporting              researchers need to then clarify how they differ. They
of this research was undertaken by a committee of the               must then disentangle the factors that contribute to
National Research Council (NRC), which synthesized                  these differences, which involve separating factors
and cited more than 70 studies published between 1970               related to low income from those that are entirely
and 1988. The NRC concluded that:                                   due to a growing up in a single-parent family. While
                                                                    research can illuminate issues related to income, it’s
    High rates of poverty, low educational                          far more difficult to find scientific evidence of the
    performance, and health problems are serious                    effect growing up in a single-parent household has on

5
    or a synthesis of research on such family factors, see Barton, 2003.
   F
6
   Gerald David Jaynes and Robin M. Williams, Jr. (Eds.), A Common Destiny: Blacks and American Society, National Research Council,
  National Academy Press, 1989.
7
  Wendy Sigle-Rushton and Sara McLanahan, “Father Absence and Child Well-Being,” in Daniel P. Moynihan, Timothy M. Speeding, and Lee
  Rainwater (Eds.), The Future of the Family, Russell Sage Foundation, 2004, p. 116.
learning. We can, however, identify with considerable                         lower self-esteem than those growing up in two-
confidence the overall effects — always bearing in                            parent households. Among women, research reveals
mind that we are talking about averages, not individual                       a negative correlation between poor adult physical
situations.8                                                                  health and growing up with a divorced mother.9
   Sigle-Rushton and McLanahan summarize the                                  While, at first glance, all of these issues may not
results of the simple correlations, which “can easily be                   seem to be related to school achievement, each
interpreted as the probability that a random person,                       (e.g., delinquent behavior, drug use, and aggressive
drawn for a given family structure, will experience the                    behaviors) can adversely affect school achievement.
outcome of interest.” They summarize the results of                        And although these behaviors appear to be separate
their research as follows:                                                 and distinct issues, they are often related, with one
                                                                           condition resulting in another.
• Academic Success. “Studies demonstrate quite
  conclusively that children who live in single-mother                        Evidence also links these variables to other school
  families score lower on measures of academic                             problems. For example, a Bureau of the Census
  achievement than those in two-parent families.”                          publication reports that the percentage of school-
  The differences are substantial (in statistical                          age children of never-married parents were more
  terms, about a third of a standard deviation after                       than twice as likely to repeat a grade than children
  controlling for age, gender, and grade level).                           of married parents (21.1 percent compared to 8.4
                                                                           percent, respectively); the percentage for children of
• Behavioral and Psychological Problems. Father
                                                                           separated, divorced, or widowed parents was 13.4
  absence is correlated with a higher incidence of
                                                                           percent. Very similar differences were found for the
  behavioral and psychological problems that may
                                                                           percentage of children who were ever suspended from
  include shyness, aggression, or poor conduct.
                                                                           school. And for both repeating a grade and being
• Substance Abuse and Contact With Police.                                 suspended from school, the rates were much higher
  Father absence is correlated with a greater tendency                     for children in families living below the poverty line
  to use illegal substances, have early contact with the                   than for children living above it.10
  police, and be delinquent.
                                                                               A recent report from the ETS Policy Information
• Effect on Life Transitions. Daughters who grow                           Center found a close relationship between states’ high
  up in single-parent families are likely to have                          school completion rates and the percentage of children
  sexual relationships at an earlier age than those                        living in one-parent families, after controlling for
  raised from two-parent homes, and are more likely                        social economic status (SES). The single-parent family
  to bear children outside of marriage. Their early                        factor, by itself, explained over a third of the variation
  partnerships also tend to be less stable.                                in high school completion rates (SES, single-parent
• Economic Well-Being in Adulthood. Research                               families, and high student mobility together explained
  has established a strong link between growing up                         almost 60 percent of the variation).11 Another recent
  in a single-mother family and having lower income                        ETS analysis found that the variation among the states
  as adults.                                                               in the prevalence of one-parent families had a strong
                                                                           correlation with the state variation in eighth-grade
• Adult Physical Health and Psychological Well-                            reading achievement.12
  Being. Adults from single-mother families have

8
    n this matter of disentangling effects, and for a comprehensive look at marriage and children, see the fall issue of The Future of Children
   O
   (titled “Marriage and Well-Being”) published by the Brookings Institution (www.futureofchildren.org).
9
   Sigle-Rushton and McLanahan, 2004.
10
   Jane Lawler Dye and Tallese D. Johnson, A Child’s Day: 2003 (Selected Indicators of Child Well-Being), Current Population Reports, p. 70-109,
    U.S. Census Bureau, Washington, D.C., January 2007.
11
    Paul E. Barton, One-Third of a Nation: Rising Dropout Rates and Declining Opportunities, Policy Information Report, Policy Information
    Center, Educational Testing Service, February 2005.
12
     Paul E. Barton and Richard J. Coley, Windows on Achievement and Inequality, Policy Information Report, Policy Information Center,
    Educational Testing Service, 2007.
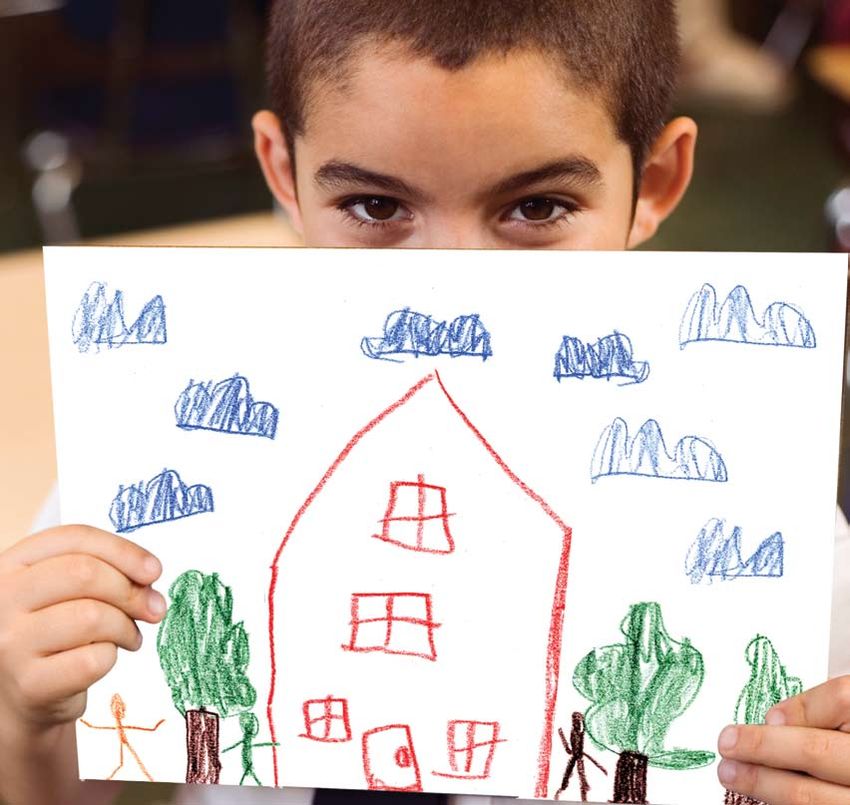
Having documented the correlation between having                                          higher were out-of-wedlock; this was also the case for 43
two parents and student educational achievement, this                                        percent of births to Hispanic mothers.13
section now examines data on parenthood trends in
the United States.                                                                           Figure 2
                                                                                             Percentage of Out-of-Wedlock Births to Women
Out-of-Wedlock Births                                                                        Under Age 30, by Educational Attainment of the
Of the 2.3 million births to women under age 30 in 2003-                                     Mother, 2003-2004
04, about 1 million (or 44 percent) were to unmarried
women. Figure 1 shows the percentage of out-of-wedlock
births for women in each racial/ethnic group.
                                                                                                                  All                                          44
                                                                                                      Less than
                                                                                                    high school                                                                 62
Figure 1
Percentage of Out-of-Wedlock Births to Women                                                      High school                                                        51
Under Age 30, by Racial/Ethnic Group, 2003-2004                                               diploma or GED

                                                                                                 Some college                                            37
               All                                 44
                                                                                            Bachelor’s degree                         13

          Black                                                         77                   Master’s degree
                                                                                                     or more                 4

Mixed Race                                                   60
                                                                                                                         0       10        20     30      40      50       60        70
                                                                                                                                                Percentage
      Hispanic                                      46
                                                                                             Source: Data from 2004 American Community Surveys reported in Irwin Kirsch, Henry
                                                                                             Braun, Kentaro Yamamoto, and Andrew Sum, America’s Perfect Storm: Three Forces
          White                             34                                               Changing Our Nation’s Future, Policy Information Report, Policy Information Center,
                                                                                             Educational Testing Service, January 2007.

          Asian                 16

                     0           20           40           60           80            100       It’s important, however, to understand that this
                                               Percentage                                    dichotomy between in- and out-of-wedlock births
                                                                                             oversimplifies the variation of family types. According
Source: Data from 2004 American Community Surveys, reported in Irwin Kirsch, Henry           to the demographer, Harold Hodgkinson:
Braun, Kentaro Yamamoto, and Andrew Sum, America’s Perfect Storm: Three Forces
Changing Our Nation’s Future, Policy Information Report, Policy Information Center,
Educational Testing Service, January 2007.                                                        Four million children of all ages now live with
                                                                                                  one or more grandparents, and one million
                                                                                                  children of all ages are the sole responsibility of
   These data paint a grim picture of the status of                                               their grandparents … A number of factors have
marriage and childbirth in the United States. Seventy-                                            created this group, such as parents who are in
seven percent of Black, 60 percent of mixed-race, and                                             jail, in drug rehabilitation centers, or those who
46 percent of Hispanic births were out-of-wedlock. Most                                           simply are not capable of raising their children.
of these out-of-wedlock births were to women with low                                             The problems of raising young children when
levels of educational attainment. As shown in Figure                                              you are 65 years old are severe — yet, for many
2, overall, the proportion of out-of-wedlock births falls                                         grandparents there is no alternative.
substantially with each additional level of education
mothers attain. The proportions are higher, however, for                                          The Statistical Abstract of the United States,
some groups. Among Black mothers, for example, more                                               2002, indicates the following family types were
than half of births to those with a bachelor’s degree or                                          raising children under 18 years old: 46 percent

13
     American Community Survey data, reported in Kirsch, Braun, Yamamoto, and Sum, 2007.

10
Figure 4
Percentage of Children in Single-Parent Families,
by State, 2004
of married couples; 43 percent of unmarried
couples; 60 percent of single women; 22 Utah 17
Idaho 23
percent of gay couples; and 34 percent of Nebraska 23
lesbian couples. Several of these categories Iowa 24
are new for the Census … and little is known Kansas 24
Minnesota 24
about how many children are being raised by North Dakota 24
each type. However, many teachers report an New Jersey 25
increase in the number of children being raised Colorado 26
Indiana 26
by same-sex couples.14 New Hampshire 26
Vermont 26
Number of Parents in the Home Connecticut 27
Montana 27
What is the trend for children living in two-parent South Dakota 27
families in the United States? In the nation as a whole Wyoming 27
Hawaii 28
in 2004, 68 percent of children were living with both Illinois 28
parents, down from 77 percent in 1980. There were Wisconsin 28
substantial declines among the White, Black, and California 29
Massachusetts 29
Hispanic populations of children with two parents in Oregon 29
the home over that period, as shown in Figure 3. The Virginia 29
lowest percentage of children living with two parents West Virginia 29
Alaska 30
was among Black children — just 42 percent in 1980, Kentucky 30
dropping to 35 percent in 2004. Thus, the majority of Pennsylvania 30
Black children live in single-parent homes. Washington 30
U.S. 31
Arizona 31
Figure 3 Michigan 31
Missouri 31
Percentage of Children Under Age 18 Living With
Nevada 31
Both Parents, by Race/Ethnicity, 1980 and 2004 Texas 32
Maine 33
83
Maryland 33
80 77
75 Ohio 33
74
New York 34
70 68 North Carolina 34
65
Oklahoma 34
60 Tennessee 34
Percentage
Delaware 35
50 Georgia 35
Alabama 36
42 Florida 36
40
35 Arkansas 38
New Mexico 38
30 Rhode Island 39
South Carolina 40
’80 ’04 ’80 ’04 ’80 ’04 ’80 ’04
Mississippi 42
All White Hispanic Black
Lousiana 44
Source: U.S. Census Bureau, Statistical Abstract of the United States, Table 60, June 29, 2005.
0 10 20 30 40 50 60 70
Percentage
Source: Data on one-parent families from Kids Count State-Level Data Online (www.aecf.
org/kidscount/sld/compare_results.jsp?i=721).
14
Harold L. Hodgkinson, Leaving Too Many Children Behind: A Demographer’s View on the Neglect of America’s Youngest Children, Institute of
Educational Leadership, April 2003.
11The variation among the states in the percentage
of single-parent families is considerable, as shown in Figure 5
Figure 4. The low is 17 percent in Utah, while South Percentage of One-Parent Families,
Carolina, Mississippi, and Louisiana have percentages Selected Cities, 2004
of 40 or higher.
San Diego 31
A comparison among large cities is shown in
Austin 33
Figure 5. San Diego and Austin had the lowest
percentages of children in one-parent families, Los Angeles 36
although about one-third of families fall into this Houston 36
category. Atlanta and Cleveland had the highest
percentages of single-parent families, with about two- Charlotte 38
thirds of the cities’ families falling into this category. New York 43
International comparisons are also available, Chicago 45
although there are variations in the years for which
Boston 52
data are available. In comparison with nine other
countries where data were available, the United States Cleveland 63
had the highest percentage of one-parent families (28 Atlanta 66
percent) and Japan the lowest (8 percent). There were
substantial increases in all countries in this statistic for 30 40 50 60 70
the time periods available (see Figure 6). In addition, Percentage
Source: U.S. Census Bureau, 2005 American Community Survey.
Figure 6
Change in the Percentage of Single-Parent Households, Selected Countries, Various Years
35
30 28
25 24
20 20 20 20
Percentage
20 19 19
17
15 15
15 13
14
13
12
11
10 9
8
7
5
5
0
’80 ’03 ’85 ’02 ’91 ’04 ’80 ’05 ’81 ’04 ’81 ’03 ’81 ’01 ’88 ’00 ’81 ’04 ’80 ’00
es n d) ar
k d
om da ce s n
at de ifie lan na an lan
d pa
St e n m
Ire gd Fr r Ja
d Sw (u De
n
Ki
n Ca the
ite an
y d Ne
Un rm i te
Ge Un
Note: Data are for children under 18 (except for Australia and Ireland, where data are for children under 15).
Source: Compiled by the Bureau of Labor Statistics from national population censuses, household surveys, and other sources. Some data are from
unpublished tabulations provided by foreign countries (www.childstats.gov/intnllinks.asp?field=Subject1&value=Population+and+Family+Characteristics).
12for most of the countries included in this comparison,
about one-fifth of families with children were single-
parent families. It is clear that the phenomenon of a
rising rate of children living with one parent is by no
means confined to the United States.
The New Inequality
The nation is very familiar with inequality based on
race/ethnicity and income. Reducing and eliminating
achievement gaps is national policy in education,
and NCLB puts teeth into this policy by requiring the
disaggregation of test scores by race/ethnicity and
poverty. It is time to recognize that there is another
form of inequality in the circumstance of growing up
and getting educated: It is whether a child grows up
with two parents in the home, or one. (Once again, it is
important to understand that the authors are speaking
in terms of averages.)
This form of inequality cuts across racial and
ethnic subgroups and family income status. However,
it is disproportionately concentrated in minority
and low-income populations. For example, as Figure
3 shows, more than half of Black children are not
living with two parents. Efforts to compensate for the
disadvantages children experience when growing up
in homes lacking the personal and economic resources
to support their learning will disproportionately
benefit students in minority and poor families. If
low income were combined with not living with two
parents — recognizing the double deficit — minority
students would predominate in any targeted effort to
compensate for deprivations and life conditions of
the kind that have been shown to hinder educational
achievement. The next sections of the report identify
some of the family and home conditions that can
affect educational achievement.
13Family Finances
Most agree that schools must be adequately funded — and not just nickels and dimes. It takes financial
if they are to educate students successfully, although resources to buy books for children to read, shoes for
there continues to be significant disagreement them to wear to school, and a quiet place for them
over how much funding is sufficient. Families also to read and study. And, more so than parents with
require resources to function effectively as educating salaries, parents who earn hourly wages may find
institutions, although it’s difficult to pin down exactly it difficult (and cost-prohibitive) to take time off to
what constitutes “adequate resources.” attend a parent-teacher conference or to do volunteer
work at school.
The report does not argue that lower income
alone is the source of educational inadequacies in the Still other important supports for educational
family, just as its authors would not argue that a lower development involve substantial resources:
school budget in itself can be blamed for low student nutritious food, adequate clothing, glasses to correct
achievement. In fact, the premise of our 2003 report, a child’s vision problems, and treatment for children’s
Parsing the Achievement Gap, was that it was necessary health problems. Research has shown that these all
to “decompose” income, examining the conditions and affect student learning and school attendance. Safety
behaviors that are shown by research to be correlated net programs may make a considerable difference,
with school achievement – which may or may not be of course, in helping families meet such needs.
“determined” by how much money the family has. However, there are large holes in the net, and many
families may not have the knowledge and ability to
The most thorough examination of the effects
access these programs.
of family income on the success of children was
performed by Susan E. Mayer. She cautions about Another problem many families in economic straits
ascribing “causation” to simple statistical correlations, face is the need to move from one place to another to
and in her analysis sorts out what can be attributed find jobs and affordable housing. This often means
to income alone. While she does find a relationship that their children will have to change schools as well
between family income and success, she says it — and that’s a problem, since research has shown
is smaller than generally thought to be. Also, she that changing schools frequently can have a negative
suggests that the attributes that make parents impact on student achievement.
attractive to employers may be similar to those that
The United States has the greatest inequality in the
make them good parents.15
distribution of income of any developed nation — an
In Parsing the Achievement Gap, we identified inequality that has been rising decade by decade. In
factors and conditions, which did not include income, 2004, according to data from the U.S. Census Bureau,
that were related to achievement. Then we looked the top and most affluent quintile (or fifth) had 50
at how the factors differed in high- and low-income percent of the aggregate household income, while the
families. The gaps in these factors mirrored the gaps in bottom and poorest quintile had 3.4 percent of the
achievement between children in high- and low-income income. Put another way, the top-income households
families. Examples of these factors were birthweight, had more than 14 times more income than the
changing schools, and reading to young children. bottom-income households.16 As New York Times
columnist Paul Krugman writes: “We’ve gone back to
This report also highlights ways families can
levels of inequality not seen since the 1920s.”17
support and encourage learning that do not depend
directly on financial resources. These include setting This section provides several measures of family
time limits on watching TV, reading to children, and financial resources and examines the distribution of
making sure that they get to school. Unfortunately, those resources among population subgroups and
some important learning supports do require money among the states. The authors examine median family
15
usan E. Mayer, What Money Can’t Buy: Family Income and Children’s Life Chances, Harvard University Press, 1997.
S
16
Carmen DeNavas-Walt, Bernadette D. Proctor, and Cheryl Hill Lee, Income, Poverty, and Health Insurance Coverage in the United States:
2005, U.S. Census Bureau, August 2005.
17
“Gilded No More,” The New York Times, April 27, 2007.
14income, the proportion of children who live in poverty, Figure 7
and the proportion who live in families where parent Median Annual Family Income for Families With
employment is unstable. Children, by State, 2005
While it is hard to disentangle the effects of income
from other characteristics associated with social class, Connecticut 76,266
it is clear that children from poor families often miss New Jersey 76,120
out on many enriching extra-curricular activities that Maryland 74,669
Massachusetts 72,279
their more affluent peers participate in. For example, New Hampshire 70,403
only 20 percent of school-age children in families with Minnesota 65,162
Virginia 64,414
poverty incomes take lessons of some sort, compared to
Alaska 63,083
31 percent of children in families at or above the poverty Hawaii 62,488
line. And only 23 percent of children in poor families Delaware 61,708
Illinois 60,393
belong to clubs, compared to 36 percent of children Rhode Island 60,230
whose families are at or above the poverty line.18 Colorado 58,416
Wisconsin 58,348
Michigan 57,009
Median Family Income Vermont 56,799
Large differences exist across states and population New York 56,680
Washington 56,462
subgroups on any measure of income. Here we focus Pennsylvania 56,362
on the median income of families with children under California 56,291
Nebraska 55,018
age 18 in the household, and show the variations Iowa 54,992
across states and among racial/ethnic groups. Table 1 Wyoming 53,722
shows the 2005 median income for families with and Ohio 53,543
North Dakota 53,323
without children, by racial/ethnic groups. Indiana 52,744
Utah 51,988
Table 1 Kansas 51,745
Median Family Income for Families Maine 51,705
With and Without Children, 2005 Nevada 51,356
Georgia 51,269
Total With No South Dakota 51,077
Income Children Children Missouri 50,966
Oregon 49,934
All $56,194 $55,176 $57,258 Florida 49,126
White, not Hispanic 63,156 66,235 60,979 Arizona 47,406
North Carolina 46,486
Black 35,464 31,705 42,079 Idaho 46,320
Asian American 68,957 70,292 67,087 South Carolina 46,124
Tennessee 45,897
Hispanic 37,867 36,403 41,276 Kentucky 45,274
Source: U.S. Census Bureau, Current Population Survey, 2006 Annual Social and Economic Texas 45,081
Supplement (http://pubdb3.census.gov/macro/032006/faminc/new03_000.htm). Montana 44,815
Louisiana 43,316
Alabama 43,094
Oklahoma 42,311
As Table 1 shows, there are large income differences
Arkansas 41,120
among racial/ethnic groups. On average, Asian- West Virginia 40,598
American families have the highest incomes and Black New Mexico 39,275
Mississippi 37,433
families have the lowest. The table also shows that D.C. 36,274
families with no children have slightly higher incomes,
on average, then those with children. There are two 20 30 40 50 60 70 80
noticeable exceptions, however. White and Asian- Thousands of Dollars
American families with children have higher incomes Source: Income data are from U.S. Census Bureau and the 2005 American Community
Survey.
than White and Asian-American families with no
18
Dye and Johnson, 2007.
15children. The opposite is true for Black and Hispanic Figure 9
families: Those with children have lower average Percentage of Children in Poverty, by State, 2005
incomes than their counterparts with no children.
New Hampshire 9
Large differences also show up across the states, as Maryland 11
Utah 11
Figure 7 shows. Connecticut, New Hampshire, New Wyoming 11
Connecticut 12
Jersey, Maryland, and Massachusetts all have median
Minnesota 12
annual family incomes over $70,000, contrasting New Jersey 12
Hawaii 13
sharply with the median incomes in Mississippi and
North Dakota 13
Washington, D.C., which are about half that of the Virginia 13
aforementioned states. Colorado 14
Delaware 14
Iowa 14
Children Living in Poverty Massachusetts 14
Wisconsin 14
As Figure 8 shows, differences exist in poverty rates Alaska 15
Kansas 15
among families of different racial/ethnic groups. In Nebraska 15
2005, 11 percent of White children under the age of Nevada 15
Vermont 15
18 were living in poverty, as were 13 percent of Asian/ Washington 15
Pacific Islander children. Those percentages increase Illinois 16
Indiana 17
to 29 percent of Hispanic/Latino children, and to Maine 17
about one-third of American Indian/Alaskan Native Pennsylvania 17
Florida 18
and Black children. Idaho 18
Oregon 18
South Dakota 18
Figure 8 U.S. 19
Percentage of Children in Poverty, California 19
Michigan 19
by Racial/Ethnic Group, 2005 Missouri 19
New York 19
Black 36 Ohio 19
Rhode Island 19
Arizona 20
American Indian/ 32
Georgia 20
Alaskan Native Montana 20
North Carolina 21
Tennessee 21
Hispanic/Latino 29 Kentucky 22
Oklahoma 23
South Carolina 23
U.S. 19 Alabama 25
Arkansas 25
Texas 25
New Mexico 26
Asian/Pacific Islander 13 West Virginia 26
Louisiana 28
Mississippi 31
White 11
0 10 20 30 40
Percentage
0 10 20 30 40 50
Percentage
Source: Poverty data are from the American Community Survey, reported in Kids Count
Source: Poverty data are from the American Community Survey, reported in Kids Count State-Level Data Online (www.aecf.org/kidscount).
State-Level Data Online (www.aecf.org/kidscount).
Poverty is also spread unevenly around the country,
as Figure 9 shows. While 9 percent of children in New
Hampshire were living in poverty in 2005, 31 percent
of Mississippi children were living in poverty.
16Food Insecurity Figure 10
Despite the existence of federal food aid programs, Prevalence of Food Insecurity by Household
many U.S. families are unable to adequately feed Characteristics, 2005*
everybody in the family. According to the U.S.
Department of Agriculture, 11 percent of U.S. All households 11
households (12.6 million families) were classified as
“food insecure” at some time during 2005. This means Household composition:
that these households, at some time during the year, Female head, no spouse 31
were uncertain of having, or unable to acquire, enough Other household with child** 19
food to meet the needs of all household members Male head, no spouse 18
because they had insufficient money or lacked other With children under age 6 17
food resources. With children under age 18 16
Married couple families 10
Good nutrition is vital for developing minds
and bodies. Researchers using the Early Childhood Race/ethnicity:
Longitudinal Study–Kindergarten Cohort to Black 22
investigate the relationship of food insecurity to Hispanic 18
achievement found that kindergartners from less food- Other 10
secure homes scored lower at the beginning of the White 8
kindergarten year than other children, and learned less
over the course of the school year.19
0 10 20 30 40
Percentage
Figure 10 shows the percentage of households who
were food insecure in 2005 by demographic groups. * Food insecurity is defined as households, at some time during the year, that were uncer-
* Food
tain insecurity
of having, is defined
or unable as households,
to acquire, enough at some
food time the
to meet during the of
needs year, that members
all their were uncertain of
having, orthey
unable
had to acquire, enough food to meet the needs of all their members because they
The 11 percent average masks the disadvantages because
had insufficientwith
insufficient
money
money or
or other
other
resources
resources for food.
for arrangements,
food.
** Households children in complex living e.g., children of other relatives
experienced by certain population subgroups. or unrelated roommate or boarder.
**Households with children in complex living arrangements, e.g., children of other relatives or
For example, nearly one-third of female-headed Source: Data calculated by the Economic Research Service using data from the December
unrelated roommate or boarder.
2005 Current Population Survey Food Security Supplement.
households were food insecure at some time during
2005, triple the rate for married-couple families. The
rate for Black households, at 22 percent, was nearly Parent Employment
triple the rate of White households. In addition, nearly
As one would expect, families with low incomes will
one-fifth of Hispanic households were food insecure.
typically be those that have had less success in the
The government further breaks down the food job market. Of course, income can come from other
security statistics on households having “low food sources, and for those most in need, a substantial
security” (households able to obtain enough food by portion will come from the safety-net programs,
using various coping strategies) and “very low food such as food stamps, unemployment insurance, and
security” (households in which normal eating patterns welfare. Beyond providing a steady income, parents
were disrupted and food intake was reduced due to who maintain steady employment also model socially
insufficient money or other resources). In 2005, responsible behavior for children to follow.
7 percent of U.S. households were classified as “low
Figure 11 shows the percentage of children who
food security,” and 4 percent were classified as “very
live in families where no parent has full-time, year-
low food security.” Again, it is important to remember
round employment, broken out by racial/ethnic group.
that this combined 11 percent represents 12.6 million
Overall, these percentages are high, and for some
households.20
groups the rates are alarming. While 27 percent of
19
Joshua Winicki and Kyle Jemison, “Food Insecurity and Hunger in the Kindergarten Classroom: Its Effect on Learning and Growth,”
Contemporary Economic Policy, Vol. 21, No. 2, April 2003, pp. 145–157.
20
U.S. Department of Agriculture, Economic Research Service, Food Security in the United States: Conditions and Trends (www.ers.usda.
gov/Briefing/FoodSecurity/trends.htm).
17You can also read