To What Extent Does In-Person Schooling Contribute to the Spread of COVID-19?
←
→
Page content transcription
If your browser does not render page correctly, please read the page content below
DECEMBER
 2020

 To What Extent Does
 In-Person Schooling
 Contribute to the Spread
 of COVID-19?
 EVIDENCE FROM MICHIGAN
 AND WASHINGTON
 AUTHORS:
Dan Goldhaber, CALDER/CEDR Scott Imberman, MSU Katharine O. Strunk, EPIC/MSU

 Bryant Hopkins, EPIC/MSU Nate Brown, CEDR Erica Harbatkin, EPIC/MSU

 Tara Kilbride, EPIC/MSU

 EPIC
 Education Policy
 Innovation Collaborative
To What Extent Does In-Person Schooling Contribute to the Spread of COVID-19?

 Evidence from Michigan and Washington

 Dan Goldhaber
 Scott A. Imberman
 Katharine O. Strunk
 Bryant Hopkins
 Nate Brown
 Erica Harbatkin
 Tara Kilbride

Abstract
The decision about how and when to open schools to in-person instruction has been a key
question for policymakers throughout the COVID-19 pandemic. The instructional modality of
schools has implications not only for the health and safety of students and staff, but also student
learning and the degree to which parents can engage in job activities. We consider the role of
instructional modality (in-person, hybrid, or remote instruction) in disease spread among the
wider community. Using a variety of regression modeling strategies to address unobserved
heterogeneity, we find that simple correlations show in-person modalities are correlated with
increased COVID cases, but accounting for both pre-existing cases and a richer set of covariates
brings estimates close to zero on average. In Ordinary Least Squares (OLS) specifications, in-
person modality options are not associated with increased spread of COVID at low levels of pre-
existing COVID cases but cases do increase at moderate to high pre-existing COVID rates. A
bounding exercise suggests that the OLS findings for in-person modality are likely to represent
an upper bound on the true relationship. These findings are robust to the inclusion of county and
district fixed effects in terms of the insignificance of the findings, but the models with fixed
effects are also somewhat imprecisely estimated.

Acknowledgements
We are grateful to the Michigan Department of Education, the Michigan Center for Educational Performance
Information, the Michigan Department of Health and Human Services, and the Washington Office of Superintendent
of Public Instruction and the Washington Department of Health for providing some of the data necessary to conduct
this research. In particular, we thank Roderick Bernosky, Josh DeBradbander, Tom Howell, Carl Jones, Joshua
Long, Sarah Lyon-Callo, Michael McGoarty, and Holly Willson from Michigan, as well as Jessica Vavrus from
Washington. In addition, we appreciate research assistance from Jeremy Anderson, Trevor Gratz, Emily Mohr, Jesse
Nagel, and Meg Turner. We would also like to thank Alyssa Bilinski, Sarah Cohodes, James Cowan, Todd Elder,
Mike Garet, Elizabeth Halloran, Doug Harris, and Roddy Theobald for providing valuable feedback on this work at
various points along the way. Any errors are our own. In addition, all opinions expressed in this paper are those of
the authors and do not necessarily reflect the views of our institutions or funders.
1. Introduction
 There is substantial concern about the extent to which in-person K-12 schooling may
increase the spread of COVID-19, both within schools and their wider communities. As of late
autumn, 2020, school systems around the nation have been in flux. Many districts – and in
particular large, urban districts – have been for the most part operating remotely since March of
2020 (Meckler & Strauss, 2020). In other districts, many students have been learning in-person
at least a portion of the time since the beginning of the 2020-2021 school year (Sawchuk, 2020).
As COVID infection rates reach unprecedented levels across the United States (Hanna & Wolfe,
2020), many state and local education policymakers are shuttering school buildings in favor of
remote learning while others are making plans to remain in-person or to open buildings for in-
person learning (Education Policy Innovation Collaborative, 2020; Sawchuk & Gewertz, 2020).1
 As policymakers consider whether and how to open school buildings for in-person
instruction or shift to remote learning, they are forced to balance fears about COVID risk with
the potential for steep and inequitable learning loss for school-age children (Dorn et al., 2020).
There is a growing concern that remote schooling is not working well for students in general, and
in particular for students who have been traditionally underserved by the public school system:
Black, Latino, and low-income students, as well as students with disabilities (Agostinelli et al.,
2020; Dorn et al., 2020). These concerns are beginning to be borne out in the literature; a recent
study in Dallas public schools suggests that there is widespread learning loss associated with the
COVID pandemic. Evidence of learning loss is apparent across the country and in other
countries where schools closed (Donaldson, 2020; Kuhfeld, Soland, Tarasawa, Johnson, Ruzek,
& Liu, 2020a).2 There are also concerns about the impact of school closures on the economy as
parents—and women in particular—are forced to reduce work hours to provide childcare and
support remote learning (Green et al., 2020; Miller, 2020).
 The debate about whether or not to open schools for in-person learning has become
heavily intertwined with political beliefs about the risk-reward tradeoffs inherent in the pandemic
(Valant, 2020). In the summer of 2020, for instance, President Trump noted the importance of
schools being open in the fall, “So what we want to do is we want to get our schools open. We
want to get them open quickly, beautifully, in the fall” (Trump, 2020).3 Trump’s Council of
Economic Advisors has also stressed the view that having students back in schools in person is
key to economic recovery from the pandemic as it allows parents of young children to return to
work (Council of Economic Advisors, 2020).
 President Trump and his administration are hardly alone in their view that schools should
be open for in-person learning. In the midst of rapidly growing COVID spread across the
country, a bipartisan (though mainly Democratic) group of seven northeastern governors released
a statement in November 2020 in favor of in-person schooling (with appropriate protections),

1
 Schools in Detroit, New York City, Indiana, and Kentucky, for instance, had been open for in-person schooling for
some students, but went fully remote in the face of rising COVID rates (Balingit, 2020; Richards, 2020; Wisely,
2020). Michigan closed all high schools for in-person learning for three weeks starting on November 18, 2020
(Oosting et al., 2020). This “pause” was extended through the winter holiday break. As a result, there has been a
200% increase in the proportion of districts operating fully remotely in December relative to the beginning of
November (Education Policy Innovation Collaborative, 2020).
2
 Notably, Kuhfeld et al (2020) cautions that there is likely bias in these estimates, as a full quarter of students –
largely low-income and minority students – are “missing” from the sample.
3
 President Trump also, at the time, encouraged adherence to CDC guidelines for school openings. Interestingly,
those guidelines were removed from the CDC website on October 29th, 2020 (Frick, 2020).

 1
despite the growing spread of COVID (Blad, 2020a), and President-Elect Joseph R. Biden Jr. has
called on Congress to provide necessary funding to safely reopen schools during his first 100
days in office (Blad, 2020b). The view that schools can be open in person with a reasonable
degree of safety reflects positions held by various groups such as the American Academy of
Pediatrics, the National Association of School Nurses, and the National Academy of Sciences,
Engineering, and Medicine, all of which emphasized the importance, during the summer of 2020,
of having students physically present in schools (American Academy of Pediatrics, 2020).
 Yet these professional and academic groups have not unequivocally backed in-person
schooling. Rather, they have recommended in-person schooling only with appropriate safety
measures (and funding for these measures) to mitigate the risk of COVID transmission. This is
broadly consistent with the position taken by the nation’s two largest teachers’ unions, although
the unions have demanded far more stringent mitigation strategies than have many other
stakeholders, going so far as to support local decisions to sue or strike should teachers feel
unsafe when required to return to in-person instruction (Perez Jr, 2020; Will, 2020).
 One of the reasons for uncertainty about whether schools should be open for in-person
education has been the shifting evidence about whether children transmit the coronavirus, at all
and/or at rates that might be dangerous for in-school or community spread. President Trump, for
instance, suggested at several points in the summer of 2020 that children do not transmit COVID
(Dale et al., 2020). Since then, the CDC has made it clear that children, while typically having
milder reactions to infection, can transmit the virus both to other children and to adults (Lopez et
al., 2020).4
 While it is now clear that children do transmit the virus, a growing number of health
experts suggest that they are less likely to be vectors of the disease than are adults (see, for
example, Weisberg et al., 2020). As evidence of this, researchers point to school systems both in
the U.S. and around the world, noting that there are few places where schools appear to be
vectors for large COVID outbreaks (Barnum, 2020; Lewis, 2020).5 Indeed, the best evidence to
date –using data from the United States and from Germany and Sweden – suggests that schools
are not major spreaders of the coronavirus (Isphording et al., 2020; Oster, 2020; Stage et al.,
2020; von Bismarck-Osten et al., 2020). That said, there are documented cases of outbreaks tied
to spread inside school buildings (Furfaro & Bazzaz, 2020), so the question of community spread
is whether having in-person schooling changes the rate of spread in the communities in which
students are enrolled in schools. This will depend both on the use of measures to prevent COVID
spread in schools as well as the counterfactual of how students and their families might behave if
they were not in school.
 In this paper we use data from two states – Michigan and Washington – on COVID case
rates at the county level linked to information on school district instructional modality to assess
the relationship between in-person schooling and the spread of COVID in communities. We
estimate a series of models that predict county-level COVID rates, growth, and spread (the
amount of time it takes to for COVID cases to double) and account for previous trends in
COVID spread. We also estimate models that separately predict COVID incidence and spread by
age group. This allows us to examine whether or not there are differential impacts of in-person

4
 There is mixed evidence about the likelihood that children are more likely than adults to transmit the virus
(Garabedian and Haffajee, 2020), but the most current evidence is that older children are more likely than younger
children to pass the virus on to others (Lewis, 2020).
5
 Other developed countries generally appear to prioritize keeping schools open, while closing bars, restaurants, etc.
(Cook, 2020; Porter, 2020).

 2
schooling on COVID rates for those who are school-age relative to adults within various age
ranges.
 The relationship between instructional modality and COVID outcomes is likely to be
correlated with various district and county level factors. The ordinary least squares (OLS)
models we estimate include a rich set of covariates designed to control for these, such as mask
wearing, geographic and population features, and political partisanship. In addition, we estimate
specifications with school district or county fixed effects, exploiting within district or county
(over time) variation so as to better control for unobserved factors that may influence COVID
spread, particularly in ways that may cause spurious correlations between instructional modality
and disease outcomes.
 On the whole, our findings suggest that school districts’ choices to offer hybrid or fully
in-person instruction are not significantly contributing to COVID spread in communities when
there are low or modest pre-existing case rates in the population. But there are some important
reasons to be cautious about this conclusion. First, we do find, consistent with epidemiological
predictions, that in-person schooling is predicted to lead to community COVID spread when pre-
existing case rates in the counties in which school districts are located are high. Our estimates
suggest that this relationship becomes statistically significant around the 95th percentile of pre-
existing COVID case rates during our observation period in Michigan and the 75th percentile in
Washington. And, as we describe below, community case rates in Michigan and Washington
were quite different during the period we model, so the case rate in which in-person schooling is
estimated to lead to increased community spread in Washington is considerably lower than the
case rate in Michigan.
 We reach the above conclusions based on a number of econometric models and
specification checks. It is clear the correlation in simple regressions between in-person and
hybrid school district modalities and COVID case rates is positive. Models that account for the
potential that the effects of in-person schooling could differ by community case rates and include
covariates that attempt to control for compliance with social distancing and virus mitigation
strategies result in significant reductions of the coefficients on instructional modality. In these
models, on average, the relationships between instructional modality and COVID case rates are
close to zero and no longer statistically significant. We estimate alternate models that use
districts’ estimated proportion of students actually attending school in each modality and find
that, in Michigan, districts in which low proportions of students return to school in person or in
hybrid modalities are particularly unlikely to contribute to spread, though even at higher levels of
in-person take-up there is no evidence that returning to classrooms drives COVID outcomes in
the surrounding communities, except at very high levels of existing community spread. In
Washington, it appears that how districts bring students back to school buildings matters; when
case rates in surrounding communities are at the 50th percentile or above, districts in which the
far majority (over three-quarters) of students attend school in-person appear to contribute to
COVID spread. These findings also hold for different age categories in the population.
 An important caveat to the above findings is that our results could be biased based on
unobserved factors that affect school modality offerings or choices to attend in-person schooling
and are also related to COVID spread in communities. Our findings from models that include
district or county fixed effects help account for unobserved heterogeneity and are broadly
consistent with the OLS in terms of the insignificance of the findings for in-person schooling.
Because these models are also somewhat imprecisely estimated, we employ a bounding exercise
suggested by Altonji et al. (2005) and Oster (2019) to assess the degree to which our main results

 3
may be biased by unobserved factors that are correlated both with instructional modality
decisions and community spread. This exercise suggests the OLS findings on in-person modality
likely represents an upper bound on the true relationship. In other words, if the estimates from
our OLS models are biased, it is likely in the direction that would overstate rather than understate
the relationship between in-person modality and COVID spread. All together these results across
multiple model specifications that address different types of statistical bias suggest that we can
reasonably rule out modest positive average causal effects of modality on COVID spread in
communities with low to moderate levels of pre-existing COVID case rates.

2. Background
 The tension between school safety and potential and realized learning losses associated
with remote schooling underscores the debate about whether schools should offer in-person
instruction. While there is some documentation of COVID spread that can be traced to individual
schools (Furfaro & Bazzaz, 2020; Martin & Ebbert, 2020; Razzaq, 2020; Stein-Zamir et al.,
2020; Wisely, 2020), the public narrative, buoyed by safe school openings in parts of Asia,
Europe, and Australia (Macartney et al., 2020; Yoon et al., 2020), is that in-person schooling is
not associated with significant increased viral transmission (Harris & Carpenter, 2020; Issa,
2020; Oster, 2020; Simchuk, 2020). However, it remains unclear if this holds during periods of
high and increasing infection rates like the U.S. experienced in late autumn of 2020.
 At the same time, emerging research suggests that some students are not well served by
the shift to remote instruction. There are concerns that teachers and schools may lack the
necessary resources to transition to remote learning (Cummings et al., 2020; Kamenetz, 2020;
Organisation for Economic Co-operation and Development, 2020; Weir, 2020), and that student
engagement may be lower with remote than in-person instruction (Dorn et al., 2020). One
estimate suggests that as many as three million students across the United States have not
received any formal education since schools closed their physical doors in March 2019 (Korman
et al., 2020). Not surprisingly, there is mounting concern about learning loss, especially for the
students most impacted by school building closures who tend to be more likely to be lower-
income, Black, and Latino (e.g., Center on Reinventing Public Education, 2020; Gross et al,
2020; Education Policy Innovation Collaborative, 2020). Virtual learning appears to be less
effective than in-person classes for lower performing students in particular (Hart et al., 2019;
Heppen et al., 2017; Loeb, 2020). Estimates from a variety of different localities suggest
significant learning losses among already disadvantaged students who are falling behind where
they would be in the absence of the pandemic (Dorn et al., 2020; EmpowerK12, 2020; Hoffman
& Miller, 2020; Korman et al., 2020; Kuhfeld, Soland, Tarasawa, Johnson, Ruzek, & Lewis,
2020; Kuhfeld, Soland, Tarasawa, Johnson, Ruzek, & Liu, 2020b; Malkus, 2020; von Hippel,
2020).6 These learning losses are estimated to have lasting negative impacts both on the future
6
 A large literature on summer slide provides some context for understanding the implications for learning loss that
researchers and policymakers can extrapolate to pandemic-driven school closures (von Hippel, 2020). More
recently, however, losses are estimated based on interim tests. One such study found that third- through eighth-grade
students performed similarly in reading in fall 2020 as their counterparts in fall 2019, while math achievement was
5-10 percentile points lower for these students. Note, however, that the magnitudes of these effects are a bit
uncertain for two reasons in particular. First, a large number of students were not tested. Second, the exams were
taken at home and were not proctored (Kuhfeld, Soland, Tarasawa, Johnson, Ruzek, & Lewis, 2020). Region-
specific data from the United States point to much more troubling trends (e.g., EmpowerK12, 2020; Donaldson,
2020). A study drawing from national exams taken in person in the Netherlands found that students lost
approximately 20% of a school year following an eight-week lockdown (Engzell et al., 2020).

 4
earnings of these students and the U.S. economy as a whole (Azevedo et al., 2020; Hanushek &
Woessmann, 2020; Psacharopoulos et al., 2020).
 Evidence for school closure as a mitigation strategy for the spread of COVID-19 comes
largely from retrospective analyses of school closures during prior flu outbreaks and pandemics.
These studies, many of which focused on the 2009 H1N1 pandemic, largely found that
efficiently timed school closure during a flu outbreak was an effective measure for reducing
spread (Bin Nafisah et al., 2018; Jackson et al., 2014, 2016). Descriptive studies of non-
pharmaceutical interventions during the 1918 flu pandemic found that cities that closed schools
had lower death rates than cities that did not close schools and that cities that implemented
control measures that included school closure had lower spread (Bootsma & Ferguson, 2007;
Winslow & Rogers, 1920). School closures during the 1918-1919 flu pandemic did not appear to
have negative effects on student learning or future adult outcomes such as wages—though these
closures lasted for shorter periods than COVID closures (Ager et al., 2020).
 While knowledge from past pandemics provided a foundation for developing virus
mitigation measures early in the current pandemic, there are health reasons to wonder about the
degree to which school closures may not have the same mitigating effects on the spread of
COVID as they appeared to have on earlier outbreaks, and on influenza outbreaks specifically
(Viner et al., 2020). In particular, children are more likely to become infected with the flu and
transmit the flu than are older adults (Wallinga et al., 2006), whereas there is some evidence that
children may be less likely to become infected with COVID than older adults (Goldstein et al.,
2020; Lee et al., 2020).7 A literature review on children’s role in the spread of COVID-19 finds
that while children do transmit the virus, they do not appear to seed outbreaks (Ludvigsson,
2020). However, another study finds evidence that children do, in fact, both contract COVID at
similar rates to their teachers and spread it even when they are asymptomatic (von Bredow,
2020). The closest analogy to schools and COVID-19 transmission may therefore come from
research on school closures in response to other coronaviruses, such as the 2013 severe acute
respiratory syndrome (SARS) outbreak, when closures did not appear to reduce spread (Cowling
et al., 2008; Pang, 2003; Viner et al., 2020).
 The handful of studies that have examined whether COVID infections in schools appear
to spread within and outside of the school reach mixed conclusions. Two retrospective case
studies—one in three schools in northern France and one in two Helsinki area schools—find that
infected students did not appear to spread COVID beyond the school setting (Dub et al., 2020;
Fontanet et al., 2020). A study of children who were infected with the virus in Mississippi finds
that children who were infected were no more likely to have attended school or child care than
control group children who were not infected (Hobbs et al., 2020). However, a study tracing a
large outbreak in an Israeli high school shows that the outbreak was seeded by two cases and
spread beyond the school (Stein-Zamir et al., 2020). One can also look to higher education for
evidence; Mangrum and Niekamp (2020) show that students returning from spring break led to

7
 Children are also less likely to exhibit COVID-19 related symptoms or to exhibit only mild symptoms (Nikolai et
al., 2020), though it is not clear whether the presence of asymptomatic or mildly symptomatic cases would increase
or decrease spread. On the one hand, being asymptomatic may be indicative of lower viral load (Zhou et al., 2020)
and hence a reduced risk of transmission to others. But it is also possible that asymptomatic but infected students are
more likely to infect others because they are not identified as being contagious. Even children without symptoms
can carry viral loads high enough to infect others (Hu et al., 2020; T. C. Jones et al., 2020), and limited testing
capacity, combined with lower demand for testing among those who are asymptomatic or at lower risk for severe
symptoms, may lead to an undercount of cases among children (Couzin-Frankel et al., 2020).

 5
large increases in COVID cases in the wider communities around colleges, and there is also
evidence of higher death rates in communities in close proximity (Ivory et al., 2020).
 Not only are there concerns about school-based spread amongst students, but school staff
have also noted the potential for within-school spread impacting the adults who work in the
schools. Indeed, this has been one of the primary arguments from the national teachers’ unions.
One study found that 42 to 51% of school employees had increased risk or potentially increased
risk of severe COVID (Selden et al., 2020). There is even less evidence about how adults in K12
schools are impacted by in-person schooling, with two observational studies and one simulation
providing evidence that in-person schooling may contribute to higher rates of infection among
staff and their partners, while a third suggests that childcare providers did not have a higher risk
of infection (Cohen et al., 2020; Gilliam et al., 2020; Ismail et al., 2020; Vlachos et al., 2020).8
 A growing literature has examined the role of instructional modality in community spread
of COVID. A small number of papers investigate whether school openings are associated with
increased community spread, including two relatively rigorous studies that employed quasi-
experimental approaches to isolate the impact of school re-opening. This research has found that
re-opening K12 schools was not associated with increased community spread (Isphording et al.,
2020; Stage et al., 2020; von Bismarck-Osten et al., 2020).9
 A larger set of papers examine whether school closures are an effective strategy for
mitigating community spread. The majority of these studies are correlational and yield mixed
results; several suggest that closing school buildings is associated with reductions in COVID
spread (Auger et al., 2020; Haug et al., 2020; Liu et al., 2020; Yehya et al., 2020), whereas
others find that building closures were ineffective in stemming the spread of the disease (Chang
et al., 2020; Iwata et al., 2020).10 One of the quasi-experimental studies on re-openings in
Germany also examined school closures and found that they were not associated with significant
decreases in transmission among children or adults (von Bismarck-Osten et al., 2020).
 There is to-date a dearth of evidence from the U.S., where extant studies are either survey
based (Gilliam et al., 2020) or draw on data aggregated to the state-level to estimate the effect of
statewide mandates, or both (Auger et al., 2020; Yehya et al., 2020). Because local context and

8
 A study of school transmission in England found higher rates of incidence among staff than students and higher
rates of staff-to-staff and student-to-staff transmission than the other way around (Ismail et al., 2020). A study
comparing infection rates of parents, teachers, and teachers’ partners under in-person versus remote learning in
Sweden found that the group exposed to in-person instruction was more likely to test positive for COVID-19
(Vlachos et al., 2020). A simulation drawing from data in one Washington county suggested in-person schooling
would increase the infection rate of students, teachers, and staff in the school building (Cohen et al., 2020). By
contrast, a study using self-reported survey data from United States child care providers in spring 2020 found that
exposure to child care was not associated with increased risk of infection (Gilliam et al., 2020).
9
 Two of these studies employed quasi-experimental methods by exploiting exogenously determined staggered
school reopening dates after summer break in Germany and found that re-openings were not associated with
increased case counts (Isphording et al., 2020; von Bismarck-Osten et al., 2020). A descriptive paper on school re-
openings found that openings in Denmark and Norway were not associated with increased community transmission
(Stage et al., 2020).
10
 A interrupted time series analysis of statewide school closures in the U.S. found they were associated with
reduced state-level incidence of COVID-19 in spring 2020 (Auger et al., 2020), and an observational study of virus
mitigation strategies in the U.S. found that states that closed schools later in the outbreak experienced higher rates of
mortality (Yehya et al., 2020). Two studies examining the effects of closures across multiple countries found that
closure was among the most effective mitigation strategies for reducing COVID-19 spread (Haug et al., 2020; Liu et
al., 2020). By contrast, another multiple-country study found that school closure was the least effective mitigation
strategy (Banholzer et al., 2020), and observational studies in Australia and Japan also found that school closures did
not appear to reduce incidence of covid-19 (Chang et al., 2020; Iwata et al., 2020).

 6
the timing of the modality decision play significant roles in the extent to which school closures
mitigate spread or school openings exacerbate it, the effect of these local decisions on
community spread is relevant yet relatively unexplored thus far in the literature.
 The role of in-person schooling in community COVID spread is of central importance to
children, teachers and other school staff, families, and the broader economy and has been at the
heart of the public debate about local, state, and national responses to the pandemic. There are,
however, two significant empirical challenges associated with determining whether instructional
modality – in-person, remote, and hybrid variations in between – influences the community
spread of COVID. The first is that there is no systemic data collection about transmission in
schools. This is perhaps best exemplified by the fact that Robert Redfield, the Director of the
CDC, referenced a voluntary (schools self-report) COVID tracker for virus spread inside K-12
schools.11 Particularly problematic for this work is the fact that limited COVID testing capacity,
combined with lower demand for testing among those who are asymptomatic or at lower risk for
severe symptoms, may lead to an undercount of cases among children (Couzin-Frankel et al.,
2020). Even when children do get tested, rapid antigen tests appear less likely to detect the virus
(Albert et al., 2020). When cases are identified, inadequate resources for contact tracing may
undermine the ability to trace cases back to schools. Limited resources for testing and contact
tracing are especially evident in the United States, where testing has not kept pace with the rising
infection rates (Johns Hopkins University, 2020).
 A second challenge is that there are good reasons to think that associations between
instructional modality and COVID spread could be driven by spurious relationships. On the one
hand, it is likely that any relationship between in-person schooling and COVID incidence or
spread in the United States is inflated given that in-person schooling in the U.S. has been highly
politicized. There is evidence, for instance, that political sentiment was a stronger predictor of
school opening decisions than local case counts at the beginning of the 2020-21 school year
(Center on Reinventing Public Education, 2020; Gross et al., 2020; Valant, 2020). More
specifically, districts are opting to open in-person in communities that are more heavily
Republican-leaning, and/or that have a greater tolerance for the risks of COVID spread in
school.12 In addition, there is mounting evidence that Republicans are less likely to practice
physical distancing amidst the pandemic, and that political ideology matters more for the use of
COVID mitigation strategies than other factors such as COVID rates and demographic
characteristics (Adolph et al., 2020; Brenan, 2020; Clinton et al., 2020; Gollwitzer et al., 2020;
Grossman et al., 2020; Schneider, 2020; Van Kessel & Quinn, 2020). Yet these same
communities, on average, have higher rates of COVID-19 infection and death (Jones & Kiley,
2020). As such, it is difficult to disentangle whether in-person schooling is causing COVID rates
to increase, or whether any relationship between in-person schooling and COVID rates is caused
by the surrounding communities’ COVID risk tolerance which drives both COVID spread and
the decision to return to in-person schooling.
 Assigning the likely direction of bias in models estimating the relationship between in-
person schooling and COVID spread is not straightforward. There may be factors that lead to a
spurious relationship in the opposite direction, suggesting a relationship between remote
instruction and COVID spread where there may be none. In particular, there is evidence that U.S.

11
 For more detail on this tracker, see https://covidschooldashboard.com.
12
 Additionally, teachers unions, which have more power in blue states where mask-wearing and social distancing
are more prevalent (Allcott et al., 2020; Katz et al., 2020), have opposed what they see as “reckless re-openings” and
threatened strikes in response to planned re-openings (Cassella et al., 2020).

 7
schools in urban areas and with high rates of low-income families were more likely to begin the
2020-21 school year with remote learning (Center on Reinventing Public Education, 2020; Gross
et al., 2020). Lower income workers are also less likely to have the opportunity to work from
home. As a result, we might expect differential spread among adults at work based on income
(Gould & Shierholz, 2020; Schaner & Theys, 2020). This makes it possible, and even likely, that
there is increased COVID spread in the same communities in which districts are opting for
remote instruction, but for reasons unrelated to modality decisions, thus creating a spurious
correlation between remote schooling models and COVID incidence. In addition, the concern
raised above about inadequate testing leading to artificially low COVID case rates could be
particularly the case in communities that offer in-person schooling. If in-person schooling
suggests a higher tolerance for risk and/or lesser concern about the potential dangers associated
with the disease, then it may be that communities that embrace in-person instruction are
precisely those that are less likely to get tests in the event they feel ill or are asymptomatic after
encounters with a COVID-positive person. This would lead to an underestimate of COVID
spread in communities with in-person schooling, which would then bias any estimates of the
relationship between instructional modality and COVID rates or growth.
 It is also worth noting that the estimated effect of in-person schooling on COVID spread
greatly depends on what students and staff are doing under the counterfactual condition of no in-
person schooling. While it may be natural to assume that removing students from contexts in
which they are in close quarters in school buildings will allow for greater social distancing and
COVID mitigation practices, the counterfactual for students and school personnel who are not in
public school buildings is not necessarily a safer environment. There is evidence, for instance,
that some families whose schools closed for in-person education formed “learning pods,” in
which groups of students learn together with a tutor, parents, babysitter, or a certified teacher
(Blum & Miller, 2020). In other communities, local community centers and nonprofits helped
families to form pods and provided an adult caregiver who could help to oversee students’
remote learning (Pillow, 2020). These pods may be in private homes or other contexts that do not
require or allow for social distancing and mitigation strategies. Moreover, it is likely that
individuals mix across and beyond their pods, as students in a pod then socialize with other
children or family members outside of school hours (Natanson, 2020). Some families are moving
their children to private schools, which are more likely to offer in-person schooling and may
have varied safety practices (Dickler, 2020). Other families are sending their children to child
care centers or hiring babysitters, both of which require the mixing of adults and children across
family units and thus could on their own foster disease spread (Gilman, 2020). In short, we do
not know what students do if school buildings are not open for instruction, but it is unlikely that
the majority of students learn by themselves from home and do not interact with other children or
adults outside of their family units. Thus, COVID spread can occur at the same or even greater
rates in communities that are keeping school buildings closed.
 It is also critical to consider the possibility of heterogenous modality effects. There is
variation across school districts by a given modality in the local level of COVID cases. Having
schools open in a local context where there are high levels of the virus would likely play a
different role in community spread than doing so where the virus is less pervasive (Auger et al.,
2020; Cohen et al., 2020; von Bismarck-Osten et al., 2020). Thus it is important that researchers
consider the level of pre-existing community COVID rates when modeling instructional
modality effects on COVID outcomes.

 8
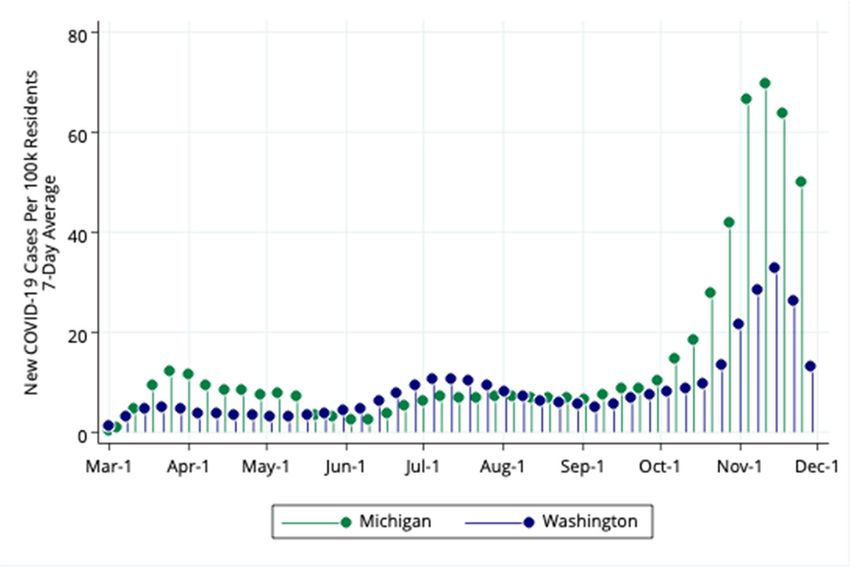
For all these reasons, it is important to be cautious when interpreting findings about the
role of instructional modality in COVID spread. In the next section, we describe in detail how we
attempt to control for the various non-school factors that could influence community spread, and
how we attempt to account for unobserved factors in particular. Our paper adds to the extant
literature in several ways. First, we are able to include a near-census of districts in two states that
have reacted very differently to the pandemic, Michigan and Washington. In these two states, we
have data on the instructional modality as well as estimated enrollment by modality for nearly
every school district in each state, which we pair with county-level measures of COVID case
rates. Second, we examine the relationship between instructional modality and COVID outcomes
for different age groups, enabling us to better understand whether public schools induce COVID
spread across the age spectrum. Third, we are able to assess not only the initial school re-opening
decisions in each district, but also changes they made in each month of the fall semester. This
enables us to assess the relationship between changes in modality and changes in community-
based COVID spread within individual counties, thus holding constant many of the unobservable
characteristics that may contribute to the COVID incidence and to district decisions about
instructional modality.
 The remainder of the paper proceeds as follows: Section 3 reviews our data from both
Michigan and Washington, highlighting similarities and differences across the two contexts.
Section 4 outlines our methods of estimating the relationship between instructional modality and
COVID spread in the surrounding communities. Section 5 describes our results. Section 6
concludes with a discussion of our results and implications for decisionmakers during this time
of uncertainty.

3. Data and Measures
 We focus our study on two states that have approached responses to COVID quite
differently since the beginning of the pandemic – Michigan and Washington – and use data from
several sources to understand how districts’ instructional modality decisions (fully in-person and
fully remote schooling at the extremes) and students’ attendance by modality influence the
spread of COVID-19. We utilize data on reported COVID-19 cases collected by the Center for
Disease Control and Prevention (CDC), as well as the respective state health agencies (i.e.,
Michigan Department of Health and Human Services [MDHHS] and the Washington
Department of Health [WADoH]). District-level information on educational modality is
collected by each of the states’ departments of education, in Michigan from the Michigan
Department of Education (MDE) and the Center for Educational Performance Information
(CEPI) and in Washington from the Washington Office of the Superintendent of Public
Instruction (OSPI), via monthly surveys administered to school districts. Although the data used
for the analysis are relatively consistent across both states, below we provide details on slight
differences in the data from Michigan and Washington as well as context about changes in
COVID incidence.

COVID-19 Data in Michigan and Washington

 Daily counts of newly confirmed COVID cases are available publicly for all counties in
both Michigan (N=83) and Washington (N=39). As we show in Figure 1, both states experienced
significant increases in new reported COVID cases relatively early in 2020. Like nearly every
state, infections again rose during the summer months and reached unprecedented levels in

 9
November. However, the patterns of community spread across the two states are somewhat
different. In particular, while both states show relatively low and slightly growing cases from the
late summer through mid-October, cases in Michigan start to pick up and grow exponentially
around mid-October. We do not see evidence of exponential growth in Washington, though there
is some acceleration in November.
 We calculate average daily COVID incidence counts across a rolling 7-day window,
creating a more stable measure compared to single-day counts which tend to fluctuate due to
reporting irregularities, particularly on weekends and holidays. We then use county population
estimates from the 2014-2018 American Community Survey to convert these average counts to
relative rates per 100,000 county residents. The resulting 7-day average rates per 100,000
residents form the basis of the main outcome measure of COVID growth used in our analysis:
the 7-day average rate on the first day of the month. In addition, we examine two measures of
COVID spread as specification checks for our main models that attempt to capture periods of
exponential growth as seen in Michigan in late-October and November. The first is the rate of
exponential growth in 7-day averages (calculated as described above) between the last and
penultimate weeks of the month. A number of studies estimate this measure of growth to model
the exponential nature of viral spread and to correct for outliers with very high case rates
(Bursztyn et al., 2020; Courtemanche et al., 2020; Lyu & Wehby, 2020; Mangrum & Niekamp,
2020). Exponential growth is widely used to model spread in the early phases of epidemics when
cases are relatively low (Bertozzi et al, 2020). Since the 2020-21 school year began prior to the
second wave, an exponential growth model could capture the beginning of the fall wave.
 The third outcome measure is COVID-19 doubling time (Muniz-Rodriguez et al., 2020),
or the number of days it would take to double the cumulative case count. A higher doubling time
points to lower transmission while a smaller doubling time points to higher transmission. For
context, the doubling time in the United States was estimated at 2.7 days in the early peak (Lurie
et al., 2020).13 Following Ebell & Bagwell-Adams (2020), we calculate doubling time using the
5-day rolling average. As with the 7-day averages described above, this approach helps to
mitigate noise from local reporting idiosyncrasies in small counties. As is evident in Figure 1,
there does not appear to be exponential growth occurring until relatively late in the fall of 2020
for Michigan, and potentially never in Washington to date. As a result, we consider these growth
measures to be specification checks for our main measure, and we focus mostly on the results for
Michigan.
 We also examine our outcomes for COVID case broken down by age groups by county
using the following categories: 0-19, 20-39, 40-59, 60 years and older. In Michigan, these daily
rate data are obtained through a data use agreement with the MDHHS. In Washington, these data
are publicly available as weekly rates via the Washington Department of Health. We are
particularly interested in the 0 to 19 year age group, as these numbers should reflect COVID
spread amongst the school-age population, arguably where school related COVID outcomes
would most likely appear.

District Instructional Modality Data

13
 In Michigan, the doubling time was 2.7 prior to the March 24, 2020 stay-at-home order (Executive Order 2020-
21) and 21.5 when the order was in place. In Washington, it was 4.3 prior to the March 23, 2020, stay-at-home order
and 31.9 during the order (Lurie et al, 2020).

 10
Both states’ departments of education are surveying school districts monthly to collect
information about the mode in which instruction is being delivered during the pandemic. In
Michigan, districts are asked to indicate how they plan to deliver instruction in each upcoming
month, while in Washington, districts report the mode in which instruction was delivered on the
final day of the month. In order for the timing of the surveys to align as closely as possible across
states, we assign Washington end-of-month surveys to the subsequent month. (e.g., Michigan
districts’ modalities at the beginning of October are compared to Washington districts’
modalities on September 30th). Michigan modality data are available for the months of
September, October, and November. Because the first Washington survey was conducted on the
last day of September (which we infer as representing instructional modalities for the beginning
of October), these data are only available for the months of October and November.
 The definitions of instructional modalities vary slightly between the two states due to
differences in the ways their surveys are structured. For Michigan, the definitions of instructional
modality are based on what districts offer their general education students. We define “in-
person” districts as those that provide general education students with the opportunity to receive
full-time in-person instruction, although in some cases students may opt for either hybrid or
remote instruction. “Hybrid” districts are those that offer some or all of their general education
students in-person schooling at least some portion – usually two to three days – of a week.
“Remote” districts are as those that provide all instruction in a remote or virtual format for all of
their general education students. These definitions are mutually exclusive and are based only on
the mode of instruction provided to general education students and therefore may not reflect the
modality provided to special populations of students. For instance, if a district provides fully
remote instruction to all general education students and fully in-person instruction to all special
education students, it would be classified as a remote district. (See Education Policy Innovation
Collaborative (2020) for more detail on the Michigan modality definitions.)
 Washington districts are classified as “in-person” if they indicated they provided
“typical/traditional in-person” instruction to elementary, middle, and/or high school students,
classified as “remote” if all of their students, or all except small subgroups of students, received
fully-remote instruction, and classified as “hybrid” if all students received “partially in-person”
instruction or the district used a “phase-in” approach where some students received partially or
fully in-person instruction while others still received remote instruction.
 One concern with discrete district instructional modality data is that not all students
choose to enroll in the in-person or hybrid modality even if it is offered. In both Michigan and
Washington, districts were also asked to approximate how many of their students received (or
were expected to receive) each mode of instruction. In Michigan, districts were asked to select
one of the following percentage ranges: 0%, 1-24%, 25-49%, 50-74%, 75-99%, or 100%. The
Washington survey is structured similarly, but uses slightly different percentage ranges: 0%, 1-
10%, 11-25%, 26-50%, 51-75%, or 76-100%. In various specifications we use these estimates of
student enrollment by modality to assess the relationship between estimated actual in-person or
hybrid enrollment and COVID case rates and spread.

Community Characteristics

 We utilize a rich set of covariates that are hypothesized to influence both instructional
modality and COVID-19 incidence. First, we consider factors associated with an increased risk
of spreading COVID-19 and/or an increased risk of adverse outcomes for members of the

 11
community who contract the virus. We use population size and age group estimates from ACS to
capture information about private school enrollment to county population and the age
distribution within each county.14 We focus specifically on the proportions of county residents
that are school-aged children (because their risk of exposure is most impacted by decisions to
open or close school buildings) and adults aged 65 or above (because they are at a higher risk of
severe illness if infected). To account for the high levels of risk among nursing home residents
and staff, we estimate the proportion of residents living in these facilities using the total number
of occupied beds reported in the COVID-19 Nursing Home Dataset (Centers for Medicare and
Medicaid). We also include the numbers of religious institutions and religious adherents per
capita from the U.S. Religion Census (Religious Congregations and Membership Study, 2010),
as gathering in churches or similar community institutions other than schools may pose more
opportunities for the virus to spread.
 We also consider contextual factors believed to shape local responses to the pandemic.
As a proxy for efforts taken by members of a community to mitigate the risk of COVID-19
spread, we include county-level estimates of mask usage from a July 2020 survey conducted by
The New York Times and Dynata.15 To capture local economic conditions, we include 2019
unemployment rates from the Local Area Unemployment Statistics program (Bureau of Labor
Statistics) and individual poverty rates from ACS. For information about the political climate of
a county, we also include the share of votes from each county in the 2016 presidential election
that were cast for Donald Trump (drawn from the County Presidential Election Returns 2000-
2016 dataset from the MIT Election Data and Science Lab).
 Table 1 provides summary statistics by state, month, and modality. In September, 58% of
Michigan districts offered fully in-person instruction, typically as one option available to parents
along with hybrid or fully remote instruction. Twenty-four percent provided only remote
instruction with no fully or partially in-person options, and most of these districts were located in
or near large urban areas. The remaining 18% adopted a hybrid model where students attend in-
person for part of the week and participate in remote instruction for the remainder of the week. In
Washington, the vast majority of districts elected to adopt either a fully-remote (64%) or hybrid
(27%) model at the beginning of school the year. The remaining 9% of districts, located
predominantly in rural areas, elected to proceed fully in-person.
 In both states, districts that began the year with fully remote or hybrid instruction tended
to shift toward modalities with more in-person instruction in subsequent months. By the
beginning of November, 64% of Michigan districts provided fully in-person instruction to at
least some of their students, while 20% provided hybrid instruction, and the remaining 16% were
fully remote. In Washington, there were about half as many fully remote districts in November
(33%) as there were in October. Most of these districts shifted from fully remote to hybrid
instruction, while a few transitioned to fully in-person instruction; 48% of the state’s districts
provided hybrid instruction in November, while 12% provided fully in-person instruction.
 Since we weight our regressions by student enrollment to better model the relationship
between modality and COVID spread, Table 1 provides weighted summary statistics. As can be
seen at the top of each panel of the table, the weighted shares of students enrolled in in-person
districts is much smaller than the share of districts offering that modality. In Washington,

14
 We use 1-year estimates of county population and age distribution from the 2019 ACS, and 5-year estimates of
private school enrollment and poverty from the 2014-2018 ACS (as 1-year estimates are only available for counties
with populations of at least 65,000).
15
 Data are publicly available here: https://github.com/nytimes/covid-19-data/tree/master/mask-use

 12
although approximately 10% of districts offer in-person instruction across the two months, only
approximately 2% of students are enrolled in these districts, reflecting the largely rural and
smaller nature of in-person districts. Because of this, in Washington we combine in-person and
hybrid districts into a single category.
 In both states, there are notable economic, political, and racial divides between districts
offering in-person and remote instruction. Remote districts in Michigan tend to have larger
shares of Black students than in-person and hybrid districts, and this gap widens after September.
Similarly, remote districts in Washington tend to have larger shares of Hispanic students
compared to in-person districts, consistent across months. Remote districts in both states also
tend to be in counties with higher shares of votes cast for Donald Trump in the 2016 election and
less frequent mask usage, compared to in-person districts. Although we observe discrepancies in
poverty rates across in-person and remote districts in both states, they occur in opposite
directions. In Michigan, remote districts tend to be in higher-poverty counties, while they tend to
be in lower-poverty counties in Washington. In both states, these economic discrepancies
increase in magnitude over time as more districts shift toward in-person modalities.
 In each state there are a set of districts that did not report their instructional modality in
each month, as shown in Appendix Table 1A. Less than 3% of districts in Michigan are missing
modality data in any given month. In Washington, approximately 3% of districts are missing data
in October and 10% in November. The districts with missing modality data are largely similar to
the districts without missing data, although in Michigan districts with missing data have a larger
share of economically disadvantaged students and special education students, while Washington
districts with missing data have a larger share of Black students and are more likely to be located
in suburban/town locales.

4. Methods

 To begin to examine the association between school district instructional modality
choices and county-level COVID-19 incidence, we estimate equation (1) by ordinary least
squares:

 , , ℎ 1

where COVID is one of three measures of COVID-19 incidence for county c at the beginning of
month t+1: a) 7-day average COVID cases per 100,000 individuals; and as specification checks
b) exponential COVID growth rate;16 and c) doubling time17. For outcome (a), we also include
lagged, 7-day average COVID-19 case rates per 100,000 individuals ending on the final day of
each of the last four weeks of month t-1, which we refer to as “pre-existing cases”, along with
the square of this value. We include lagged COVID rates in this way to allow for growth rates to
be high when existing cases are low (exponential growth) but to slow at higher case rates as
behavioral responses and increased immunity “bend the curve” and start reducing growth. The

16
 ℎ ln 1 ln , 1 where , are total cases
at time t.
17
 where t is time in days between observations and r is the percentage growth rate in
the five-day rolling average of cases per 100k persons during period t.

 13
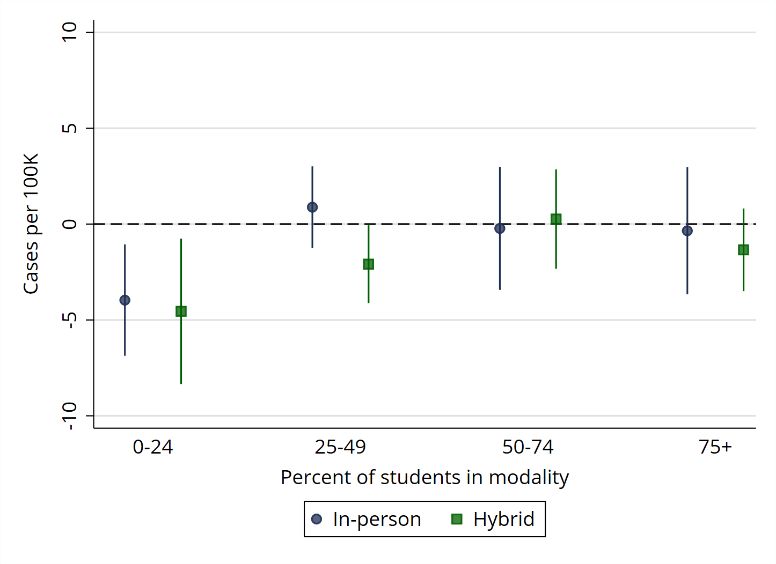
second and third specifications do not adjust for pre-existing COVID-19 cases in month, t-1 as
these are mechanically included in the dependent variable. In alternative specifications we also
estimate our models using the age-specific outcomes for the following age groups: 0-19, 20-39,
40-59, and 60 years and over. All regressions are weighted by district enrollment and standard
errors are clustered at the county level.
 Our primary interest is the extent to which community spread is influenced by
instructional modality, which is captured by the in-person (IP) and hybrid (H) variables for
school district j at time t. These variables are captured multiple ways and slightly differently by
state as described in Section 3. Hence, we utilize a few different specifications in how we
consider modality. First, in Michigan we estimate models using the modality chosen by the
school district:
 : , 2 .

As noted in the prior section, in Washington, although approximately 10% of districts offer in-
person instruction, only about 2% of students are enrolled in these districts. Given this, we
combine the variables into a single combined indicator:

 : , _ 3 .

In both states, for outcome (a), we also estimate models that interact these indicators with pre-
existing COVID rates to allow for the impact of instructional modality to vary with baseline
COVID rates:

 : , , 4
 , , ,

 : , _ _ , _ ,

Importantly, many epidemiologists argue that in-person schooling is less likely to risk health and
safety if cases in the community are low, but considerably riskier when cases are high (Boyle,
2020). This specification provides us with the ability to estimate levels of existing COVID rates
where a given modality starts to affect overall disease spread.
 Our data also include measures of district reported shares of students who enroll in in-
person or hybrid modality when given the option. One key issue with using the district modality
choice is that even if a district is in-person or hybrid they will often give parents the option of
keeping their children in a remote instruction, and evidence suggests that take-up of this option
may be substantial (e.g., Education Policy Innovation Collaborative, 2020). Hence, while the
district modality is a policy decision, the impact of modality on COVID rates is a function of the
interaction of modality preferences of parents and the district policy. In both states, districts
report these shares in ranges, though the actual ranges differ slightly. Further, while Michigan
reports both in-person and hybrid shares, Washington only reports the combination of students
enrolled in these modalities. Hence, we estimate model (1) with the following modality
variables:

 14
You can also read