Climate and Disaster Resilience - Pubdocs.worldbank.org.
←
→
Page content transcription
If your browser does not render page correctly, please read the page content below
Climate and Disaster Resilience
Pacific Island countries face unique development challenges.
They are far away from major markets, often with small
populations spread across many islands and vast distances,
and are at the forefront of climate change and its impacts.
Because of this, much research has focused on the challenges
and constraints faced by Pacific Island countries, and finding
ways to respond to these.
This paper is one part of the Pacific Possible series, which
takes a positive focus, looking at genuinely transformative
opportunities that exist for Pacific Island countries over the
next 25 years and identifies the region’s biggest challenges
that require urgent action.
Realizing these opportunities will often require collaboration
not only between Pacific Island Governments, but also with
neighbouring countries on the Pacific Rim. The findings
presented in Pacific Possible will provide governments
and policy-makers with specific insights into what each
area could mean for the economy, for employment, for
government income and spending.
To learn more, visit www.worldbank.org/PacificPossible,
or join the conversation online with the hashtag
#PacificPossible.
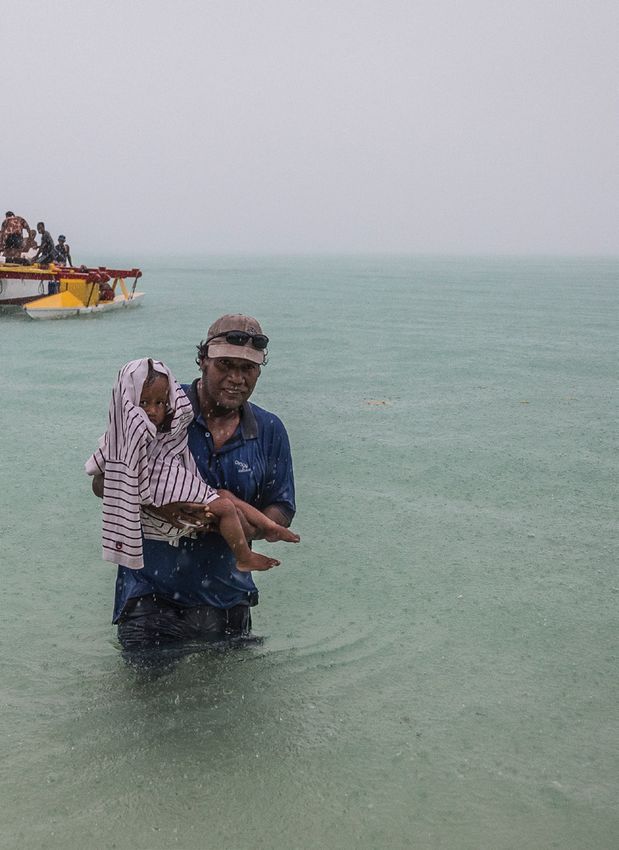
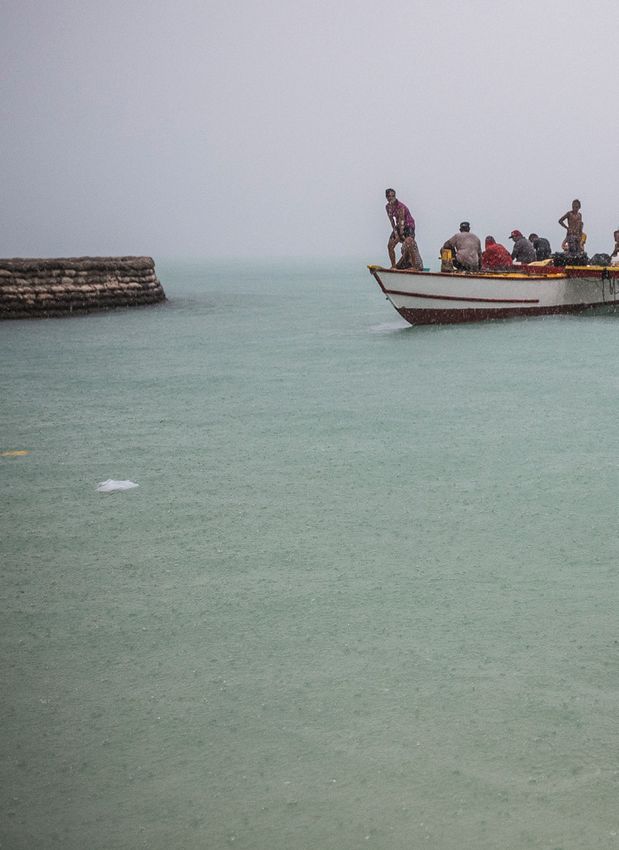
Cover photo: Vlad Sokhin/Panos
Table of Contents
Executive Summary................................................................................................................................. 3
Introduction .......................................................................................................................................... 13
1.     Current Risks and Projected Climate Changes .............................................................................. 15
     1.1       Current Risk and Exposure in PICs ........................................................................................ 15
     1.2       Climate Change and its Effect on PICs .................................................................................. 19
     1.3       Impact on Poverty and Gender ............................................................................................. 22
2.     Managing climate and Disaster Risks............................................................................................ 27
     2.1       Reducing Exposure ................................................................................................................ 28
     2.2       Reducing vulnerability........................................................................................................... 28
     2.3       Adaptation and Development Deficit ................................................................................... 30
3.     Adaptation to Climate Change and Disaster Risk for Key Sectors ................................................ 30
     3.1       Estimating Costs of Adaptation............................................................................................. 30
     3.2       Sea Level Rise and Coastal Protection .................................................................................. 31
     3.3       Managing Water Resources and Flooding ............................................................................ 35
     3.4       Adapting Infrastructure to Changes in Rainfall and Temperature........................................ 43
     3.5       Improving the resilience of buildings to tropical cyclone winds........................................... 49
     3.6       Adaptation in the Agricultural Sector ................................................................................... 56
4.     The Case of Atoll Islands ............................................................................................................... 60
Reference .............................................................................................................................................. 64
Annex on detailed methodology (Volume II of the report): ................................................................. 67
Annex 1 - Climate change and Pacific Islands ....................................................................................... 67
Annex 2 - Sea Level Rise and Coastal Protection .................................................................................. 67
Annex 3 - Managing Water Resources and Flooding ............................................................................ 67
Annex 4 - Adaptation for Infrastructure ............................................................................................... 67
Annex 5 - Improving the Resilience of Buildings to Tropical Cyclones ................................................. 67

                                                                                                                                                         2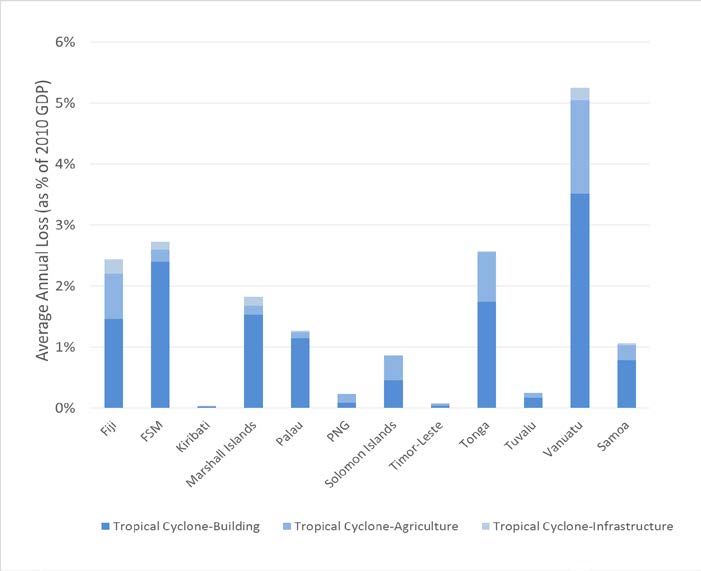
Executive Summary
The Pacific region is known to be one of the most exposed to natural hazards and climate change in
the world. Pacific Island Countries (PICs) are exposed to a wide variety of natural hazards, including
cyclones, droughts, earthquakes, electrical storms, extreme winds, floods, landslides, storm surges,
tsunami and volcanic eruptions. Some of these hazards will be exacerbated by climate change.
Average ocean and land temperatures are increasing, and the seasonality and duration of rainfall is
changing. Over the coming decades, tropical cyclones are expected to increase in intensity, though
not necessarily in frequency, and to move closer to the equator. Because of higher ocean temperature
and ice sheet melt, sea level is rising, thereby worsening coastal erosion and saline intrusion and
increasing the severity of storm surges. All these impacts adversely affects agriculture, fisheries,
coastal zones, water resources, health, and ecosystems and thus threaten entire communities and
economies. The mere existence of low-lying atoll island nations like Kiribati, Tuvalu and RMI is
threatened by sea level rise and storm surges, since they are only 1-3m above sea level.
People and economies in the Pacific are particularly vulnerable to hazard and climate change
impacts because of geographical remoteness and isolation, dispersion across a large area in the
Pacific Ocean, economic and social challenges and the degradation of natural resources.
Vulnerability to extreme climate events is now increasing with population growth and migration
(internal and external), poor coastal development and land use planning, unplanned urban growth,
and water and ecosystem degradation including pollution of sub-surface and coastal waters.
Vulnerability is exacerbated for the poorest populations (mostly in Kiribati, Vanuatu and FSM), who
live in small communities on remote outer-islands, often on lands which are vulnerable to flooding
and cyclones, and who rely on subsistence-farming and fishing for their livelihoods. These people have
limited access to education and health facilities and lack the financial capacity (savings, insurance) to
cope with the impacts of natural hazards and climate change. Women also suffer more from climate
extremes than men, because they tend to depend more on natural resources for livelihood and
subsistence, and are vulnerable to gender-based violence in the aftermath of disasters.
Despite a consensus that PICs will be disproportionately impacted by climate change, assessing the
future cost of climate-change impacts in the Pacific Region is challenging. Firstly, there are deep
uncertainties on the speed and sometimes direction of climate changes, especially at local scales.
There are large differences on rainfall and storm surges changes between the projections of different
climate models that do not seem to be diminishing with time. And given the small size of the PICs and
the extensive ocean dominated areas where they are located, downscaling changes in climate and
natural hazards at the country level gives an even wider range of potential changes. For instance, in
Kiribati some models project an increase in extreme peak daily rainfall of 53% in 2050 while others
predict an increase of 92%, for the same emissions scenarios. In addition, even if models were
perfectly accurate, uncertainty would not disappear because future levels of greenhouse gas
emissions, which by nature cannot be forecasted, largely determine future climate change. Secondly,
climate change impacts will depend on the socio-economic choices made by countries for the next
decades. It will be much more expensive to adapt to climate change in a society which heavily depends
on agriculture production, with high poverty rates, inequalities, and poorly-managed infrastructure
than in an inclusive society with safety nets and resilient infrastructure. Rapid and inclusive
development can mitigate some climate change impacts by 2030, especially the impacts on the
poorest (Hallegatte et al, 2016). Finally, the costs and benefits of adaptation will be determined by

                                                                                                       3
priorities of individual PICs. For instance, the best adaptation strategy will differ if the objective is
economic efficiency, or if the objective is to remain below a defined level of risk.
Despite these challenges, it is possible to design resilient development strategies using new decision
frameworks. Indeed, many decisions made now concerning development strategies and
infrastructure investment in the PICs need to take into account climate change. Given the
uncertainties around future climate change and associated impacts, infrastructure should be made
resilient to possible changes in climate conditions. This aim implies that policy makers using climate
information must change their practices and decision-making frameworks, for instance by adapting
uncertainty-management methods. Five methods can be considered (Hallegatte, 2009):
(i) Selecting strategies that yield benefits even in absence of climate change, and therefore
create no or little regret if the climate does not change as expected. Example of no-regret
strategies include reducing leaks in water distribution systems, increasing the standards
of new buildings, or increasing the frequency of road maintenance.
(ii) Favouring reversible and flexible options, like insurance, early-warning systems or easy-
to-retrofit coastal defences.
(iii) Buying ‘‘safety margins’’ in new investments, with for instance restrictive land-use
planning, higher coastal protection defences or bigger drainage capacity for urban
infrastructure and roads.
(iv) Promoting strategies focused on institutions, policies and behaviour change, including the
‘‘institutionalization’’ of long-term investment planning, multi-criteria assessment and
use of a range of policy and financial investment instruments.
(v) Reducing decision time horizons. For instance, in areas that could be flood-prone in the
future, building cheaper houses with shorter lifetime that can be replaced quickly and at
lower cost.
This report uses these generic methods to provide recommendations for climate resilient
development in the PICs in the following sectors: coastal protection, flood management, water
resources management, protection of infrastructure against changes in temperature and
precipitations, protection of buildings against cyclone winds, and adaptation in the agriculture sector.
Improving Coastal Protection
The highest adaptation costs for PICs by 2040 will be coastal protection. In order to protect PICs from
coastal erosion, sea and river flooding, and submergence, three “hard” options have been considered
within this report including: (i) beach nourishment (particularly in areas with high tourism revenue);
(ii) sea and river dike construction; and (iii) port upgrade. The level of protection required and the
associated cost of these options varies largely between countries and the sea level rise scenarios, but
the costs are always significant. In the best case, with a sea level rise of 40cm by 2100, costs in the
2040s vary between USD 3 million per year in Palau (1% of GDP assuming constant growth) to USD 97
million in the Solomon Islands (3% of GDP) and USD 17 million in Kiribati (4% of GDP). In the worst
case, with a sea level rise of 126cm by 2100 and increased cyclones intensity, costs go up to USD 329
million per year in Fiji (3% of GDP) and USD 58 million in the Marshall Islands (13% of GDP). These
figures far exceed the cost of coastal adaptation reported in other region – 0.8 % of the GDP for Sub
Saharan Africa and less than 0.4% in other regions. Those high costs are primarily comprised of
4expenditure on the construction and maintenance of sea walls (more than 75% of the total in most
countries). It is important to note that these costs assume that only the principal population centres
will be protected, and not the outer islands and less densely populated coastal segments. This means
that additional costs will be associated with internal migrations and densification of the population
behind coastal protections.
Table 1 Range of adaptation costs for coastal protection by country (best case-worst case scenario)
(million USD per year at 2012 international prices)
Country 2020s 2040s 2040s as % of projected GDP
(includes residual damages)
Fiji 71-230 86-329 1-3%
Micronesia, Fed. Sts. 6-20 8-28 1-3%
Kiribati 13-42 17-54 4-11%
Marshall Islands 13-42 16-58 4-13%
Palau 2-9 3-11 1-2%
Solomon Islands 81-280 97-347 3-11%
Tonga 8-28 9-35 1-4%
Vanuatu 36-130 42-161 2-8%
Samoa 4-15 7-21 0-1%
Source: World Bank estimates
There is little prospect that the high costs of building sea walls could be financed by the countries
themselves. Accordingly, the international community will have to assess the trade-off between large
initial expenditures on construction that is designed to protect coastal communities for many years
into the future versus expenditures and emergency relief and recovery programs when disasters
occur. Some countries – e.g. the UK and France – have abandoned attempts to protect all of their
coastlines from storm and wave damage; some of the Pacific Island countries may need to make a
similar choice and set priorities in the geographical allocation of expenditures on coastal protection.
To manage the uncertainties around future climate change and shoreline behaviour, flexibility
should be incorporated into the design of coastal protection interventions. In some situations, hard
structural options could be combined with softer non-structural options (e.g: ecosystem based
approaches, beach nourishment) to reduce the cost and mitigate the environmental and social
impacts. Ensuring that future population growth is concentrated outside coastal zones and relocation
of the existing population may be considered, although the implementation might be challenging due
to land scarcity and tenure issues. Another option could be to raise buildings above coastal inundation
levels to reduce the need for hard-infrastructure protection. In all cases, strengthening institutional
capacity for integrated coastal management is an essential element of responding to climate change.
Managing floods and water resources
Many climate scenarios suggest that total annual precipitation will increase in most PICs as a result
of climate change. This increase will be accompanied by greater variation in rainfall between wet and
5dry months, with more intense rainfall in the wettest periods of the year. For example, in Fiji while
the 1 in 20 year peak rainfall event in 24 hours today is 245 mm, it would be about 300 mm in 2050
with climate change. There is also a potential for more severe droughts, especially for the Solomon
Islands and Tuvalu and to a less extend Fiji, Palau and RMI. Hence, adaptation to climate change should
involve measures to: (i) increase the capacity to store water that is accumulated in wetter months for
use in the drier months; and (ii) manage the run-off caused by more intense periods of rain.
Table 2– Changes in high 1 in 20 year rainfall over 24 hour period by country for 2050
(mm of rain relative to recent climate)
Country No Climate Change Median Climate change Extreme Climate Change
FJI 245 292 348
FSM 63 78 123
KIR 145 224 365
MHL 72 85 125
PLW 197 245 284
SLB 84 102 119
TON 57 68 82
TUV 83 102 127
VUT 189 230 281
SAM 79 97 116
Investment in increased water storage and rainwater harvesting, especially on islands with limited
amounts of land suitable for reservoirs, will be critical. The alternative to investing in more water
storage may be reliance upon desalination facilities or other alternative water resources, which
(depending on scale) can result in a significant capital costs in addition to ongoing operational and
maintenance costs.
A combination of initiatives will be required to minimize future flood risk. A key approach should be
effective land-use planning for future urban development, as in general it is cheaper to keep economic
assets out of flood prone areas than to build storm and flood defences to protect them. However, as
for coastal protection, the implementation of such initiatives may be constrained by land scarcity and
tenure issues. Alternatives include any combination of measures to provide protection to assets or
accommodation to flood flows. One option for adapting to climate change would be to increase the
existing design standards for flood defences, drainage infrastructure and buildings to a higher
standard of protection, which would cater for any increases in risk due to higher rainfall, without
resulting in a lower standard of protection over time due to climate change. Another strategy may be
to ensure that the floor levels of all new buildings are raised so that their main thresholds are a metre
or more above ground level. This would also benefit PICs who are vulnerable to coastal inundation
and sea level rise.
A “one size fits all” approach to flood risk and drought management will not be appropriate for PICs.
The selection of the best combination of interventions for each PIC will require a comprehensive
investigation of the costs and benefits of each option, which will be specific to the needs of the
beneficiaries. Limited investigations have been conducted in PICs to date, in part due to the lack of
quality hydrological data upon which to base investigations.
6Adapting infrastructure to changes in rainfall and temperature
Even if coastal protection is provided to protect infrastructure from seal level rise and storm surges,
additional expenses will be required to protect power and telecommunication, water and sewers,
urban, roads and other transport, hospitals, schools and housing infrastructure from changes in
rainfall and temperature. The materials and designs used in building infrastructure, as well as the
frequency of maintenance, would need to be altered to maintain the same quality of infrastructure
services as in the absence of climate change. For example, in buildings it will be necessary to increase
the capacity of ventilation systems in order to cope with more humidity and higher temperatures, and
to strengthen the roofs to withstand higher levels of rain. In urban designs larger drainage and water
storage systems will be required to cope with higher rainfall.
Assuming countries raise construction standards as they become richer (for example new urban
drainage systems are built to withstand a 1 in 20 years event instead of 1 in 10, because the value of
the assets that need protection is higher), the cost of protecting infrastructure against changes in
rainfall and temperature due to average climate change in 2040 will vary from 2% to 20% of
expenditures across the PICs. Fiji and Vanuatu will have lower adaptation costs, while atoll countries
such as FSM and Kiribati will have higher costs. Roads account for more than 50% of the average costs
of adaptation for most PICs and exceed 90% of the average costs in Solomon Islands and Samoa.
Table 3- Costs of protecting infrastructure relative to baseline expenditures
(Average cost of pre-emptive adaptation for all infrastructure assets by country for 2011-50;
20 year planning horizon; $ million per year at 2010 international prices with no discounting)
Country Average cost % of baseline
expenditure
Fiji 20.2 3.0%
FSM 13.4 13%
Kiribati 18.9 21%
MHL 8.1 11%
Palau 4.5 6.3%
SLB 17.3 8.6%
Tonga 8.4 12%
Tuvalu 0.3 5.8%
Vanuatu 7.0 3.9%
Samoa 7.8 7.0%
For most type of infrastructure (e.g: health and schools infrastructure, housing, water supply and
sewers) the lowest regret option is to adapt now to future climate changes. The lowest-regret
strategy often entails planning ahead for only one or two decades. For example, for infrastructure that
has generally a short life-span (such as houses), decision-makers and engineers should not be asked
to design houses with a view to extend their lifetime beyond 20 years. It is cheaper to build
infrastructure that can withstand the climate conditions of the next 10 to 20 years than building
infrastructure that can withstand both current climate and the climate that will be experienced in 30
years. For many types of infrastructure the pre-emptive strategy is fully justified as the marginal cost
is low (e.g: ICT, health and schools, water and sewers).
7For roads, due to the the high costs of comprehensively protecting infrastructure against the worst
case scenario and the high uncertainty surrounding future changes in rainfall, the optimum solution
will be a combination of pre-emptive measures and strengthening preparedness. The lowest regret
option for many PICs appears to be a mix of: (ii) relatively low cost adaptation measures (e.g. first and
foremost proper maintenance but also increase the slope of pavement and/or the capacity of the
drainage systems to reflect changes in future expected runoff or water flow) and (ii) be reactive to
climate change impacts which would involve rebuilding those sections of the roads if and when they
are damaged. However, this assumes that governments will have the financial and technical resources
to react quickly in case of disasters and repair damaged roads promptly, whereas if those conditions
are not met, the costs of being reactive may be largely underestimated. A possible cost-effective
solution for managing future changes in climate and minimize the economic costs associated with a
road failure could be to focus on non-engineering measures such as realignment, environmental
management (increased vegetation land cover, preservation of mangroves…) and land-use planning,
and on strengthening preparedness, and maintaining accessibility to essential infrastructure such as
schools and hospitals following a disaster event by increasing the redundancy of the road network,
thus making sure there are alternatives even if the main road is damaged.
The results provided within this report are indicative, but adaptation strategies need to be designed
on a case by case basis. For instance in some places it may make sense to adapt roads to climate
change by installing higher drainage capacity and elevating the road, while in other places increasing
redundancy in the road network can be a more cost-effective solution. The best solution will depend
on the local context, and in particular on the acceptable level of service failure.
Protecting buildings against cyclone winds
In addition to adapting buildings to withstand sea level rise, increased flooding and changes in
temperature, it may also be necessary to protect them against stronger cyclone winds, as the
intensity of tropical cyclones is likely to increase.
Ensuring that new buildings can withstand at least 1 in 50 year cyclone wind speeds should be a high
priority for policymakers. The changes required to ensure that structures are more robust to cyclones
will usually involve modest adjustments to designs when the buildings are constructed, and small
additional costs. However, the successful implementation of higher building standards will require
actions to improve compliance with the new code, including investment in training of engineers and
contractors, strengthening of the design and construction permitting process, and provision of
enforcement resources.
Reconstruction efforts should seek to ensure that buildings – especially, public buildings – should
incorporate the code improvements necessary to ensure greater resilience to the current and future
distribution of cyclone risks. The benefits of greater wind resistance will increase as a consequence
of climate change over the life of the buildings that are either replaced or reconstructed during the
recovery from these storms.
For existing buildings, cyclone wind retrofitting options can decrease expected losses by 35-50%
(Figure 1). However, such investments are not always justified when the costs of heavy retrofitting to
meet higher standards which would accommodate increased wind speeds are high relative to the
8benefits in terms of loss reduction. It is therefore necessary to prioritize the countries and the
buildings for which retrofitting would be appropriate, in order to ensure cost-efficiency. For instance,
retrofitting will be more cost-efficient in countries which face higher cyclone risks - notably Vanuatu,
Fiji, RMI, Tonga and Samoa where retrofitting public buildings (e.g. schools, hospitals) appears to be
economically justified.
The heavy retrofitting of public buildings becomes a viable policy option when factoring in their role
as evacuation shelters during cyclones. Benefits including avoidance of potential loss of life or injuries
and the loss of the services provided by buildings should be considered in future analyses. For housing
stock, retrofitting is shown to be too expensive in many countries, and therefore early replacement of
the buildings in combination with upgraded construction standards may be a better strategy.
Figure 1 - Loss reductions due to cyclone wind retrofitting options
WSM
VUT
TON
MHL
FSM
FJI
0% 10% 20% 30% 40% 50% 60%
% Reduction of Expected Annual Loss
Public Heavy Public Light Res Light
Adapting the agriculture sector
As the climate changes, increased temperatures and higher risk of seasonal droughts are likely to
decrease crop productivity and negatively affect livestock in PICs. For example, papaya is sensitive
to temperature increase during flower production and higher temperatures result in lower
productivity. Although increases in carbon dioxide concentrations could act as a “fertilizer” for some
crops in the short-run (e.g. rice, sugarcane and sweet potato), the crop yields of cassava, maize, and
taro is likely to decrease by 2050. Livestock may also be negatively impacted due to increased risk of
heat stress.
9Table 4: Relative Changes in Crop Yields (%) under Climate Change in 2050 Relative to 2000
Cassava Maize Rice Sugarcane Sweet potato Taro
Country Worst Best Worst Best Worst Best Worst Best Worst Best Worst Best
case case case case case case case case case case case case
Fiji -36.5 -8.8 -7 1 -11 3.5 -8.3 2.8 -13.4 2 -17.5 1.1
Solomon
-27.8 -17.9 -16.5 -0.3 -16.2 5.9 -12.9 0.9 -15 1.5 -18.6 -4.7
Islands
Source: Rosegrant et al. 2013, in ADB 2013
While the impact on GDP could be overall neutral for the Pacific region by 2050 (although some
countries may experience negative impacts of 1-3 percent of GDP in this time period), by 2100 the
impact could be strongly negative, equivalent to approximately 5 percent of Pacific GDP as all crop
yields decrease. These impacts are likely to be underestimated given that they do not take into
account interaction effects with other biophysical processes, such as salinity intrusion or the incidence
of pests and diseases.
Adaptation to climate change in agriculture in PICs needs to be based on both low-cost no regret
options and perhaps more expensive long-term solutions. Simple low-cost options that both improve
productivity and increase resilience to climate change include mulching and multiple cropping, and
improved farmer education. Longer term solutions should build agriculture systems that can be
resilient to multiple changes, such as short periods of floods or droughts, saline intrusion, extremes of
temperature, erosion, altered patterns of pests and diseases and changes in growing seasons. As agro-
ecological conditions change, farmer re-education will be vital – preferably promoted through farmer-
to-farmer exchanges. Other solutions are likely to incorporate more substantial and sustained
investments, such as the development of new climate-smart crop varieties at regional or national
level, higher design standards for agricultural assets (such as storage sheds and livestock shelters) to
help reduce storm damage, or insurance mechanisms to address residual risks, which require
considerable government involvement including consideration of premium subsidies and product
development and loss assessment.
The Case of Atoll Islands
The atoll nations of Kiribati, Marshall Islands, and Tuvalu are particularly vulnerable to sea level rise
and storm surges. As their highest point of elevation is only a few meters above sea level, in the
absence of adaptation sea level rise will reduce the habitable surface over time and may lead to a
dislocation of the island. For example, for Majuro Atoll in RMI, a 50cm rise in sea level may mean the
disappearance of 80% of its land area (ADB, 2013). In Tuvalu’s Fongafale Island (Funafuti), sea level
rise by 2040 would lead to a more modest but still large loss of about 5.8-10% of Fongafale’s land area
and expose a further 10-11% of land area to occasional inundations.
The cost of managing the risk of sea level rise on atoll nations is likely to be significant. In Kiribati
for example, the cost of coastal adaptation could be between US$ 17 to 54 million in the 2040s, which
10is about 4 to 11% of Kiribati’s GDP. It is unlikely to be affordable for the Government of Kiribati to
allocate such an amount in its annual budget to coastal protection for the next decades and significant
financial support from the international community will be required. Ensuring decent living conditions
on the atoll requires to arbitrate between hard protection options (i.e., through atoll raising, land
reclamation, coastal protection) and softer ones (like rehabilitation or protection of mangroves and
wetlands, early-warning systems, social protection or financial instruments) and to prioritize between
investments in coastal protection, water desalinization, or other infrastructure in transport and
energy. It also requires to carefully identify the trade-offs and synergies between multiple objectives
in different sectors.
In the event that the international community will not allocate an estimated USD 10 to 50 million a
year per atoll nation to protect them against sea level rise, or if the costs of adaption are much
higher than expected, other long term options will need to be considered. Consideration should be
given to the feasibility of a progressive relocation. Such an approach would need to be carefully
planned and available resources would still need to be used to maintain acceptable living conditions
on the atolls for the coming decades. There are political, social and economic sensitivities that would
need to be carefully considered and addressed in the event that this option is adopted, as discussed
in Wyett (2013). It is clear that a progressive and planned relocation of the population away from the
most exposed areas would be less costly and preferable to a last-minute abandonment, which would
require a significant level of emergency assistance.
Former President Anote Tong of Kiribati has spoken of the need to ensure “migration with dignity”
for the country’s population. While the Government of Tuvalu (2012) specifically mentions migration
as a possible climate change outcome, survey data shows that the vast majority of Tuvaluans do not
view this as a major reason for concern and are not, as yet, preparing to migrate due of climate change
(Mortreux and Barnett, 2009). The decision to plan for a relocation of the population, or part of the
population to another country is a difficult one to make, given the uncertainties surrounding the speed
and strength of climate change and sea level rise. In addition, there is also uncertainty related to the
availability of international aid, along with challenges linked to the social acceptability of a planned
migration. However, it makes a lot of sense to start considering this option as a long-term solution to
climate change impacts in atoll countries, using an integrated approach that involves all stakeholders
and carefully examines the threats that climate change poses to life on the atoll nations. The costs of
maintaining acceptable living conditions on the atoll nations for different time horizons should also be
considered.
Conclusions
The findings and recommendations provided in this report should be used carefully and considered
in accordance with the local contexts. Resilient development in PICs under tight budget constraints
will require a compromise between hard protection options (such as sea walls, building retrofitting,
and desalinisation plants, which are very expensive in Pacific Islands given the cost of importing
materials and equipment) and softer options (such as rehabilitation or protection of mangroves and
wetlands, early-warning systems, social protection and rainwater harvesting). It will also require
prioritization between investments in coastal protection, flood protection, water supply, or resilient
infrastructure.
11The trade-offs and synergies between multiple objectives in different sectors will need to be
identified. For instance, water desalinization requires a lot of energy (therefore opportunities for
alternative energy sources such as solar energy should be sought), changes to climate-resistant crops
can affect water demand by the agricultural sector, and land-use patterns can affect the exposure of
the population to extreme events. Integrated design and assessment of adaptation across multiple
sectors should be supported.
12Introduction
Pacific Island Countries (PICs) are among the most exposed nations in the world to natural hazards
(including floods, droughts, tropical cyclones, storm surges, earthquakes, volcanic eruptions, and
tsunamis). They are also highly vulnerable to these hazards, which can result in disasters that affect
their entire economies, human and physical capital, and impact their long-term development agendas.
Since 1950, natural disasters have affected approximately 9.2 million people in the Pacific region,
causing approximately 10,000 reported deaths. This has cost the PICs around US$3.2 billion (in
nominal terms) in associated damage costs (EM-DAT, 2010 1). The PICs are some of the most
economically affected by disasters in the world, with, for instance, average annualized losses
estimated to amount to 6.6% of the GDP for Vanuatu and 4.4% of the GDP for Tonga.
These losses may be compounded by the impacts of climate change. Sea level rise, increasing land
temperatures, changes in the seasonality and duration of rainfall will affect infrastructure, coastal
zones, water resources, agriculture, food security, and thus lives, livelihoods and economies.
Disasters, climate and weather extremes and projected changes in climate, are increasingly
recognized as a major development challenge, as they adversely impact social and economic
development and poverty reduction efforts. Accordingly, the Pacific Possible Strategic Report is being
prepared, in order to take a long term view of the development challenges and opportunities faced
by PICs and focus on activities that could have transformational impacts on countries in the region.
Pacific Possible aims to identify and whenever possible quantify development gains that could be
achieved if the right preconditions are in place. The long-term perspective adopted by Pacific Possible
will consider major changes in the economic environment for PICs and their impact on the PICs
development opportunities. Such changes will include climate change, with projected severe impacts
on PICs, and in particular, atoll nations.
The Pacific Possible includes six thematic focus areas, one of which is “Managing increased stress
on pacific livelihoods.” This focus area will include consideration of natural disasters and the impacts
of climate change on PICs, and this background paper has been prepared to support this process. This
background paper will consider the following key issues regarding the changes in PICs by the year
2040:
1. The potential socio-economic impacts from natural hazards and climate change;
2. The cost of adaptation to minimise potential socio-economic impacts; and identification of
the combination of investments and policies that are likely to have the highest impact in
reducing the socio-economic impacts.
In order to develop effective adaptation strategies, it is essential to distinguish between the impacts
of: (a) changes in the frequency and/or severity of extreme weather events; and (b) changes in
“normal” climate conditions, such as higher mean temperatures, higher mean sea level the level and
pattern of precipitation, ENSO cycles, etc.
1
EM-DAT: The OFDA/CRED International Disaster Database – www.emdat.be – Université Catholique de Louvain
– Brussels – Belgium
13For extreme weather events that underlie disaster risks, the starting point for PICs must be an
assessment of whether current standards and practices offer an appropriate level of resilience in
the context of current climate hazards. As countries develop they tend to invest in higher levels of
resilience because the benefits of preventing losses outweighs the costs as the assets and incomes at
risk grow. Today, the PICs invest less in disaster resilience than would be required to provide them
with a high level of resilience. As such, it is possible that the additional costs of adapting to climate
change-driven increases in extreme weather may be small relative to the costs of investing in greater
resilience to current risks.
Adapting to changes in average climate conditions requires a gradual response. For example, this
could be through changes in the design of infrastructure and other assets, investments in agricultural
research & development, the management of water resources, or coastal adaptation. Given the
uncertainties that exist around the future impacts of climate changes, (particularly future changes in
rainfall patterns or impacts on extreme events), adapting will require flexible or low-regret options
which perform well whatever the future brings. In some cases, the lowest regret option may be to
wait and adapt reactively to climate change impacts, while in some sectors the lowest regret strategy
will be to adapt pre-emptively.
This background paper considers adaptation for a range of sectors and situations, including
infrastructure and buildings, coastal protection, the water sector, and agriculture. Special
consideration is given to regional atoll islands due to their unique challenges, with many of them only
1-3m above sea level and sea levels predicted to rise by 25 cm by 2050 and 60 cm or more by 2100. It
also considers the economic costs of adaptation and proposes some prioritised support for the 2040
timeframe of the Pacific possible.
141. Current Risks and Projected Climate Changes
1.1 Current Risk and Exposure in PICs
The Pacific region is known to be one of the most prone to natural disasters and climate change
in the world. Key reasons are their high exposure to a wide variety of natural hazards (cyclones,
droughts, earthquakes, electrical storms, extreme winds, floods, landslides, storm surges, tsunami and
volcanic eruptions), geographical remoteness and isolation, and dispersion across a large area in the
Pacific Ocean. The region is frequently hit by hazard events. Between 1950 and 2011, extreme
weather-related events in the Pacific islands region affected approximately 9.2 million people in the
Pacific region, approximately 10,000 reported deaths and damage costs of around US$3.2 billion.
Recent estimates show that the expected losses due to natural disasters on an annualized basis in the
Pacific far exceed those in almost all other countries in the world. The impact of natural disasters is
equivalent to an annualised loss of 6.6 percent of GDP in Vanuatu, and 4.3 percent in Tonga.
Climate change is exacerbating the vulnerabilities of PICs. Tropical cyclones- a major cause of losses
and damage for PICs -, are expected to increase in intensity, though not necessarily frequency, over
the coming decades. In addition to changing extreme weather events, climate change is adding
pressure on fragile island systems via increasing average ocean and land temperatures, changes
in the seasonality and duration of rainfall, coastal erosion, saline intrusion and increasing sea
level 2. Climate Change may threaten the existence of entire low-lying atoll island nations, such as
Kiribati, Tuvalu and RMI. These states are only 1-3m above sea level, and thus are threatened by
projected sea level rises of around 60 cm or more by 2100. Climate change is already adversely
affecting agriculture, fisheries, coastal zones, water resources, health, ecosystems and thus
economies of countries and communities. If greenhouse gas emissions are not drastically reduced,
continued changes in climate are likely to exacerbate these negatives effects 3.
In addition, the vulnerability of PICs is also increasing due to economic and social changes and the
degradation of natural resources. Key drivers include population growth and migration (internal and
external), poor coastal development and land use planning, unplanned urban growth, and water and
ecosystem degradation including pollution of sub-surface and coastal waters.
Natural hazards and climate change affect countries differently as highlighted by the country risk
profiles developed under the Pacific Catastrophe Risk Assessment and Financing Initiative (PCRAFI).
Whereas atoll island nations outside the cyclone belt and seismic zones are more affected by slow-
onset events, such as saline intrusions and coastal erosion, rapid onset disasters are frequent
occurrences in the high-volcanic islands. Overall, hydro-meteorological disasters cause the majority of
economic loss, whereas geo-hazards are by far the major cause of human loss.
2
IPCC, 2014 and Australian Bureau of Meteorology and CSIRO, 2011.
3
World Bank, 2012b
151.1.1 Tropical cyclones
Tropical Cyclones have traditionally been the most serious climate hazard for PICs in terms of total
damage and loss (Figure 2). Vanuatu is the most at risk from cyclone events, and is expected to lose
on average 36.8million dollars annually.
Figure 2. Expected Average Annual Losses due to Cyclones in Pacific Island Countries
Source: PCRAFI Country Risk Profiles (World Bank, 2015)
From 1981 to 2016, there have been 27 Category 5 and 32 Category 4 cyclones which have had
significant impacts on PICs. Being struck by a Category 5 cyclone has been a 1 in 10 year event for
Fiji, Tonga and Samoa and a 1 in 5 year event for the Solomon Islands and Vanuatu. Samoa has been
struck by seven Category 4 or Category 5 cyclones with peak wind speeds of greater than 58 metres
per second (m/s). Tropical Cyclone Evan, which struck Samoa in December, 2012, caused total
damage and losses of approximately US$210 million (30% of annual GDP), and Tropical Cyclone Ian,
which struck Tonga in January 2014, resulted in total damage and losses of approximately US$50
million (11% of annual GDP). In March 2015, Tropical Cyclone (TC) Pam struck Vanuatu, Tuvalu and
Kiribati. In Vanuatu, the cyclone killed 11 people and resulted in an estimated US$450 million damage
and losses, equivalent to 64 percent of the GDP. More Recently, TC Winston struck Fiji as an extremely
destructive Category 5 cyclone in February 2016, resulting in the death of at least 42 people and
damage and loss that may exceed that seen following TC Pam.
The historical record suggests that the dramatic increase in impacts associated with tropical
cyclones in the past several decades globally is largely due to increased exposure and vulnerability,
rather than an increase in intensity or frequency of cyclone hazards. There is no consensus on
16changing frequencies or intensities of tropical cyclones on the global scale, 4 although there is
emerging evidence of such changes in the Atlantic which has a record of longer-time series for these
low probability events. For the Pacific, cyclones the time series is not sufficient to identify changes in
their frequency and intensity. 5
Cyclone season in the Pacific is influenced by the El Niño events. This was evident during one of the
most active seasons in 2015/16.i For the first time since satellite observation started, three tropical
cyclones of Category 4 (Saffir-Simpson scale) were observed simultaneously across the north-east
Pacific - Kilo, Ignacio and Jimena - in September 2015. All three were over open water and thus did
not cause damage to PICs. ii
1.1.2 Floods and droughts
Flood risk (from rainfall not associated with cyclones) is very significant in the region yet it is not
consistently recorded. However, ad-hoc information for particular events suggests massive losses
from floods. For example, Fiji experienced devastating floods in 2004, 2009, 2012 (twice) and 2014.
The 2009 event caused damage and loss of 135 million USD (SOPAC, 2009). 6 More recently, flash
flooding in the Solomon Islands in 2014 caused damage and loss estimated at US$108.9 million,
equivalent to 9.2 percent of gross domestic product (GDP), and resulted in the death of 22 people and
affecting approximately 52,000 people in total. The flooding caused damage to major infrastructure,
fully destroying some 675 houses along with the food gardens that many people depend upon for
their livelihood.
Droughts are increasingly affecting PICs. Only 52% of the populations in PICs currently have access
to improved water supply. 7 Water sources are vulnerable to the effects of El Niño events, which have
the potential for significant water-related impacts for many communities across the region. Both FSM
and RMI have declared a state of emergency due to the 2015/16 El Niño induced drought, which has
resulted in increased distance to water sources for many communities across the region. Previous
examples of significant drought in the region include the drought that occurred in Tuvalu in 2011,
which led to severe rationing of fresh water supplies in September/October of that year.
1.1.3 Coastal hazards
Coastal erosion, storm surges and king tides are majors hazards affecting the coasts of the PICs.
There are up to 30,000 islands located within the Pacific Ocean with a total coastline of over 50,000
km. Most of the population, urban centres and critical infrastructure are located on the coast and
4
See Weinkle et al., 2012 and Woodruff et al. 2013.
5 Crompton et al. (2011), for example, argue that one would need to have 260 years of hurricane data to identify any trends
in hurricane frequency associated with anthropomorphic climate change in the Atlantic Ocean. Since South Pacific cyclones
are even less frequent than Atlantic ones, the time series necessary to identify historical trends there would be even longer.
Complete Pacific cyclone data is only available from 1981, so clearly no trend can be deduced from observing this data. There
is a somewhat longer time series available for the Atlantic, but even there the trends are uncertain.
6
For Fiji, in EMDAT for example, there are zero damages recorded for the 2004 flood, 43 million USD for the 2009, 89
million USD for 2012 – but only one event is registered, and there is no record of the flood event in 2014.
7
WHO & UNICEF Joint Monitoring Programme, 2013
17therefore exposed to coastal hazards. However as for floods only ad-hoc information is available on
the economic impact of particular events. For example in November 1979, December 2008 and March
2014 large extratropical storms caused large swell and flooding throughout Majuro, RMI. The cost of
property damaged during the 1979 event was estimated at USD26M and 110 homes were damaged
during the March 2014 event (Hess et al., 2015). According to a recent study 57% of the assessed built
infrastructure for the 12 Pacific island countries is located within 500 metres of their coastlines,
amounting to a total replacement value of US$21.9 billion (Kumar and Taylor, 2015).
1.1.4 Tsunami and Earthquakes
Many PICs are situated within the Pacific “ring of fire” which aligns with the boundaries of the tectonic
plates, making them extremely vulnerable to earthquakes and tsunamis. These tectonic plate
boundaries are extremely active seismic zones, capable of generating large earthquakes and in some
cases, major tsunamis that can travel great distances. Of all hazards that impact on PICs, tsunamis
tend to result in the highest number of fatalities.
The potential impacts of earthquakes and tsunamis various significantly across PICs (Figure 3).
Vanuatu is the most at risk to earthquakes and tsunamis of all PICs, and was affected by devastating
earthquakes and tsunamis several times in the last few decades. For example, in 1999, a magnitude
7.5 earthquake caused extensive damage to Pentecost Island, leaving more than 10 dead, over 100
injured and millions of USD in losses. The earthquake generated a large tsunami including a six-meter
wave. In 2002, a magnitude 7.3 earthquake struck near the national capital of Port Vila, causing
millions of USD in damage to buildings and infrastructure. More recently, in 2009 a devastating
tsunami struck Samoa following an 8.1 magnitude earthquake, resulting in waves of 14 meters which
destroyed over 20 villages and led to 189 fatalities. In 2013, a tsunami struck the Solomon Islands,
following an 8.0 magnitude earthquake, destroying homes and killing 9 people.
18Figure 3. Expected Average Annual Losses due to Earthquakes and Tsunamis in Pacific Island
Countries
Source: PCRAFI Country Risk Profiles (World Bank, 2015)
1.2 Climate Change and its Effect on PICs
1.2.1: Historical changes and their effects
For PICs, climate change manifests itself as changes in air and ocean temperatures, ocean chemistry,
rainfall, wind strength and direction, sea-levels, wave actions, storm surges along with extremes
such as tropical cyclones, drought and storm swell events. The effects of these changes depend on
the biophysical nature of the island and its social, economic and political setting 8 .
Sea level rise, storm surge and swells particularly impact infrastructure. Rates of sea-level rise in the
tropical Pacific, between 1993 and 2009 were about four times the global average (approximately 12
mm per year). 9 Swell events, particularly those that occur during strong El Niño events, lead to waves
surging across low-lying islands causing severe damage to housing and infrastructure as well as natural
8
Nurse et al., 2014
9
Ibid. Global average over 1993-2011 are about 3.3mm yr-1. . Rates of sea-level rise are however not uniform across the
globe and large regional differences have been detected including in the tropical Pacific, where reported rates have been
approximately 12 mm yr -1 between 1993 and 2009; these are generally thought to describe transient rates associated with
natural cyclic climate phenomena such as ENSO. Global sea level is likely to increase in the range of 0.17m (or 170mm) to
0.38m (or 38mm) by 2050 (IPCC fifth Assessment report, WG1, SPM).
19resources, and affect thousands of people across the region. In many islands, changing patterns of
human settlement affect the shoreline processes and cause shoreline erosion. Cyclones can cause
shoreline erosion and damage, but depending on the location can also nourish and replenish a coast 10.
Human activity such as sand mining, pollution and settlement in the near-shore are currently major
factors which have to be addressed to reduce the risk from climate change to shoreline, infrastructure
and ecosystems.
Decreased rainfall threatens freshwater lenses, especially in islands with relatively low mean rainfall
such as Tonga, Cook Islands and Niue, a 25% decrease in the replenishment of groundwater reduces
the thickness of the freshwater lens by about 50%. iii Salt water intrusion from high sea levels/storm
surges can take months or years to recover as freshwater lenses require recharge from significant
rainfalls. Recovery from such shocks during the last El Niño in 1997 in the Cook Islands for example,
took 3 years. iv
1.2.1 Projected changes in temperature and rainfall
Projecting climate change for small islands is challenging. Firstly, the size of the islands are much
smaller than the grid squares of the global circulation models (GCM) that underpin the climate
projections (which are between 200 and 600 km2, depending on the model), resulting in inadequate
resolution over the land areas of virtually all small islands. Secondly, there are limited regional socio-
economic scenarios available at scales relevant to the small islands. Methodology has been developed
to overcome these challenges for the Pacific at the regional level, and allows the determination of
general trends rather than specific outcomes at the country level. Accordingly, although this paper
presents projections for individual PICs, these results should be viewed with caution and as a general
guide for projected changes in climate.
By 2050 mean temperatures in the Pacific Islands are expected to increase by 0.8 to 1.4oC relative
to a baseline of 1980. The latest IPCC projections are between 1.5 oC and 3.7oC by 2100 with much
variation in different seasons 11.
Mean annual precipitation by 2050 is likely to increase slightly in most PICs, with the exception of
Kiribati, where it is likely to increase by 20-25% compared to the historical rainfall data (1948 to 2008)
. However, there is considerable difference amongst the different climate models making it uncertain
as to the extent of change that might occur in the populated areas of Tarawa. There is likely to be
significant variation in the monthly precipitation – that is some months are likely to be dryer and some
wetter – with the annual precipitation remaining about the same (see Annex 1).
10
Etienne and Terry (2012) found that in Fiji, a category 4 cyclone nourished shorelines with fresh coralline
sediments despite localized storm damage.
11
Nurse et al, (2014).
201.2.2 Projections for tropical cyclones
There are likely to be more intense tropical cyclones and associated intense rainfall in the Pacific 12.
Modelling results indicate that it is unlikely that Cyclone Pam and Winston will remain unique, and
more Pam-like storms of similar magnitude affecting the Pacific would be expected in the coming
decades. Cyclones have a big impact on coastlines through storm surges that can be a long way from
the main cyclone area. In March 2015, tidal surges associated with Cyclone Pam (estimated to be 3–5
m), swept across the low-lying islands of Tuvalu and caused more than US$ 10 million in damage,
equivalent to 27% of the GDP. Impact of cyclones are likely to be exacerbated by increasing flooding
as drainage will be hampered by sea-level rise, and the ongoing coastal erosion.
As the Pacific Ocean warms, the range of cyclones could move to the north and south of the current
“typhoon/hurricane belt” and be more damaging. El Niño events are associated with equator-ward
shift in cyclone tracks. Thus, if El Niño like events are to become more frequent or more intense – as
suggested by some climate models - the long-term storm trajectory trends may be going both ways
leading to a larger spread of cyclones outside of the historical cyclone belt (both closer to the equator,
and pole-ward outside the current zone). This trend of changing trajectories is likely to end up being
the most important shift for cyclones associated with climate change in the foreseeable future.
Experience shows that by far most of the mortality, morbidity and damage from cyclones is
experienced in regions that are unaccustomed to them and therefore unprepared. However, most
of the PICs are within the belt, but countries like Tuvalu that are close to the equator may experience
more serious damage as they did in TC Pam and the damages can be severe in such low-lying atoll
countries.
1.2.3 Projections for floods and droughts
Floods and seasonal droughts are likely to continue to increase. The intensity of rainfall is likely to
increase, along with the possibility of urban floods and the associated damage to people and assets.
In low-lying islands and coastal areas, these effects would be compounded by effects of storm surges
which would affect infrastructure and freshwater lenses. The increased temperature and changes in
the rainfall patterns also increase the likelihood of seasonal droughts. Given that much of the
agriculture is rain fed and there is very little water storage, this would also in turn affect agriculture
and water supply.
1.2.4 Projection for sea level rise and ocean acidification
Sea level rise for the Pacific is likely to be about higher than the global average, which is in the range
of 0.17 m to 0.38 m by 2050, and influenced by El Niño–Southern Oscillation (ENSO) like events 13.
However, some recent global sea level rise estimates are considerably more alarming as more
information on glacial melting and other feedback loops has been incorporated into climate models.
12
IPCC 2014, Fifth Assessment Report, Work Group I, Technical Summary
13
Ibid.
21You can also read