Mega-Stress for Mega-Cities - A Climate Vulnerability Ranking of Major Coastal Cities in Asia
←
→
Page content transcription
If your browser does not render page correctly, please read the page content below
Mega-Stress for Mega-Cities
A Climate Vulnerability Ranking of Major Coastal Cities in Asia

                                                                           Shanghai

                                                 CHINA

                       BANGLADESH                                    Hong Kong
                  Calcutta Dhaka
          INDIA

                                                                         Manila
                                                                                 PHILIPPINES
                                        THAILAND
                                                        VIETNAM
                                    Bangkok     CAMBODIA
                                                 Phnom  Ho Chi Minh
                                                  Penh

                                               Kuala
                                              Lumpur
                                                       MALAYSIA

                                                  SINGAPORE

                                                                        INDONESIA
                                                           Jakarta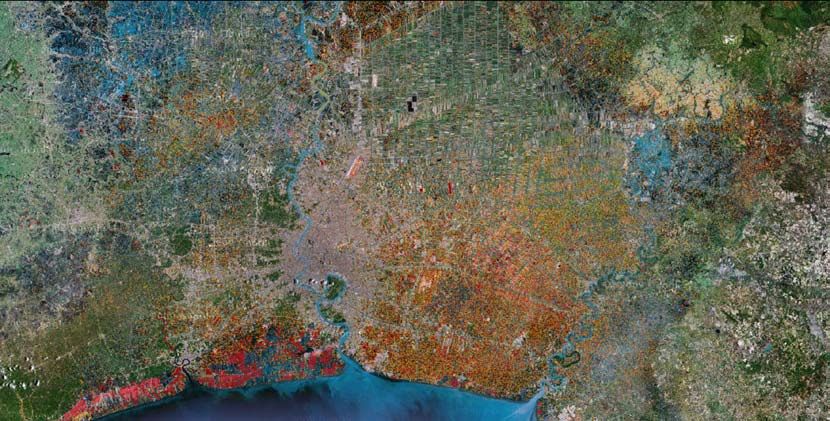
Table of Contents

          Section I
  3-6     Executive Summary

          Section II
  7-8     Context

          Section III
 9 - 10   Methodology

          Section IV
          City Scorecards
11 - 12   Dhaka, Bangladesh
13 - 14   Jakarta, Indonesia
15 - 16   Manila, Philippines
17 - 18   Calcutta, India
19 - 20   Phnom Penh, Cambodia
21 - 22   Ho Chi Minh, Vietnam
23 - 24   Shanghai, China
25 - 26   Bangkok, Thailand
27 - 28   Hong Kong, China
29 - 30   Kuala Lumpur, Malaysia
31 - 32   Singapore, Republic of Singapore

          Section V
33 - 34   Vulnerability Rankings

          Section VI
35 - 36   Policy Recommendations

          Section VII
37 - 39   References and Resources

                      2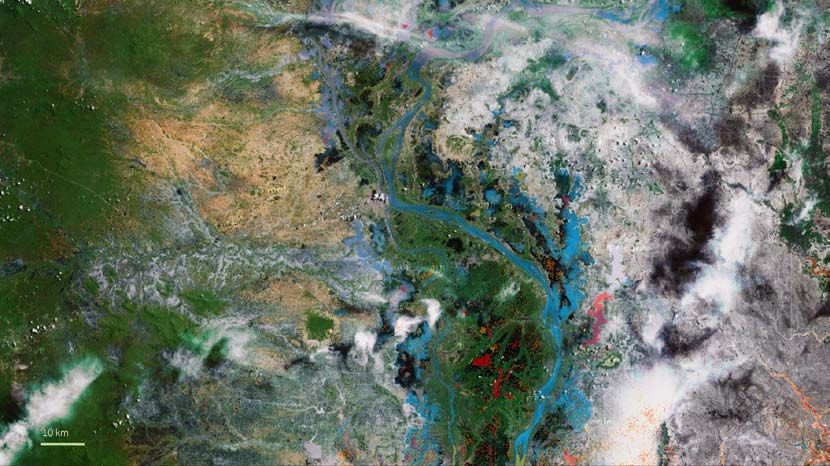
Section I

Executive Summary
Asia is arguably among the regions of the world most vulnerable to climate change. Climate change and climatic
variability have and will continue to impact all sectors, from national and economic security to human health,
food production, infrastructure, water availability and ecosystems. The evidence of climate change in Asia is
widespread: overall temperatures have risen from 1°C to 3°C over the last 100 years, precipitation patterns have
changed, the number of extreme weather events is increasing, and sea levels are rising. Because many of the
largest cities in Asia are located on the coast and within major river deltas, they are even more susceptible to
the impacts of climate change. In response, this report highlights the vulnerability of some of those cities - with
the goal of increasing regional awareness of the impacts of climate change, providing a starting point for further
research and policy discussions, and triggering action to protect people and nature in and around Asia’s mega-
cities from mega-stress in the future.
Cities cover less than 1% of the planet’s surface, and are home to around 50% of the world’s population, and
many of them see a rapid growth trend. Taken together, all cities and urban areas worldwide use 75% of the
world’s energy and are responsible for 75% of global greenhouse gas emissions. Without major breakthroughs
on energy efficiency and emission reductions in cities, we will fail to avoid dangerous climate change in urban
as well as rural areas. Cities are hotspots of innovation and technology and have therefore traditionally been the
places where many of the solutions to the world’s problems have been developed, making all cities potential
leaders in the global effort for a low carbon future.
This report, however, focuses on climate variability and adaptive capacity of cities. It is divided up into four sec-
tions: context, methodology, scorecards, and policy. While we highlight the major climate change effects impact-
ing 11 key Asian cities, this summary is by no means an exhaustive review. The cities chosen for this report
represent large, mostly coastal cities which are all threatened by climate change. These particular cities were
chosen because they represent a good cross section of coastal Asia and the impacts of climate change were
assessed as significant. We encourage governments and all other relevant stakeholders to use this report as a
catalyst for further discussions on the issue of climate change in the region, deciding where additional research
is needed, and what the appropriate polices should be.
For each scorecard, we provide a short profile of the selected city, highlight the observed climatic change, sum-
marize the major climate impacts the city is facing, and suggest some adaptation strategies that may decrease
the city’s vulnerability. For this analysis, the vulnerability of the cities is a function of their exposure, sensitivity,
and adaptive capacity. These three categories were averaged to get the overall vulnerability score. It should be
noted that WWF has approached the issue of vulnerability in this report with the most simplistic analysis pos-
sible, and we appreciate that there are many additional factors to consider and alternative methods for assess-
ing vulnerability.

                                                             3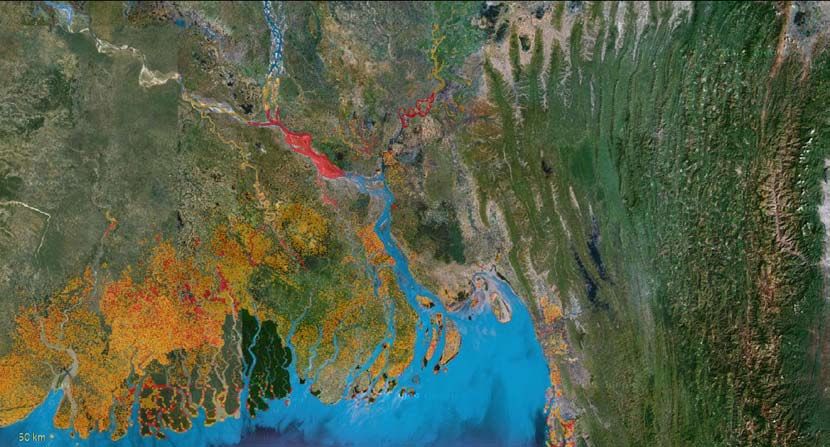
Section I

Below we highlight the overall vulnerability scores and rank them. However, apart from the overall ranking tak-
ing into account all the assessed criteria, this report also summarizes a number of other comparisons including
which city is most at risk of environmental threats, which city is most socio-economically sensitive to climate
change impacts and which city has the lowest adaptive capacity.

Overall Vulnerability

    9          8          8          7           7           6           6         5          4        4        4
   Dhaka     Jakarta    Manila    Calcutta   Phnom Penh Ho Chi Minh   Shanghai   Bangkok   Hong Kong   KL    Singapore

Overall Climate Vulnerability Ranking
Of the 11 cities examined, Dhaka in Bangladesh is most vulnerable to climate change impacts. This large, rela-
tively poor city sits just meters above current sea levels, is regularly impacted by tropical cyclones and flooding,
and has very limited adaptive capacity. Jakarta in Indonesia and Manila in the Philippines are also highly vulner-
able cities and tied for the second rank, largely because of the size of the cities, degree of exposure (both ex-
perience frequent flooding), and relatively low adaptive capacity. Calcutta in India and Phnom Penh in Cambodia
are tied for third most vulnerable city, largely because Calcutta is prone to salt-water intrusion and sea-level rise
effects, while Phnom Penh has very low adaptive capacity. Ho Chi Minh City in Vietnam and Shanghai in China
are tied for fourth most vulnerable city, because both are very susceptible to sea-level rise, even though Viet-
nam and China may have slightly higher adaptive capacity when compared to some of the other cities. Bangkok
in Thailand is the fifth most vulnerable city, mostly because it has a relatively high socio-economic sensitivity
to impacts (i.e., it has a large population and contributes a large proportion towards Thailand’s gross domestic
product). Kuala Lumpur in Malaysia, Hong Kong in China, and Singapore in the Republic of Singapore are all tied
for the sixth most vulnerable city, mostly because all three have slightly more adaptive capacity than the other
cities, even though the climate impacts are still significant.

1. Exposure

    8          6          9          6           4           8           8         5          7        3        4
   Dhaka     Jakarta    Manila    Calcutta   Phnom Penh Ho Chi Minh   Shanghai   Bangkok   Hong Kong   KL    Singapore

At Risk: Comparing Exposure To Climate Impacts
All examined cities will be significantly impacted by climate change, but when examining the selected impacts
(tropical storms, sea-level rise and flooding and drought), the report found that some of the cities may experi-
ence more frequent or more intense events than others. For this report, exposure is the average of the three
highlighted environmental categories including the susceptibility of the city impacted by 1 m sea-level rise and
2 m storm surge (as illustrated in the satellite photos at the end of each city chapter), historical frequency of ex-
treme weather events including flooding and drought, and frequency of tropical storms and surges. When exam-
ining just the exposure to these impacts, we see a slightly different picture from the overall vulnerability ranking.
Manila, largely due to its exposure to tropical cyclones and flooding, tops the list as most exposed. The recent
tropical storm Ketsana illustrates this exposure of Manila and the surrounding area to environmental threats.
With flood waters reaching nearly 7 m and hundreds of deaths during this one storm, Manila is truly vulnerable.
Dhaka, Ho Chi Minh City, and Shanghai tie for having the second highest exposure to climate change impacts,
largely because of their susceptibility to flooding and tropical storms. Hong Kong ranks the third highest in terms

                                                             4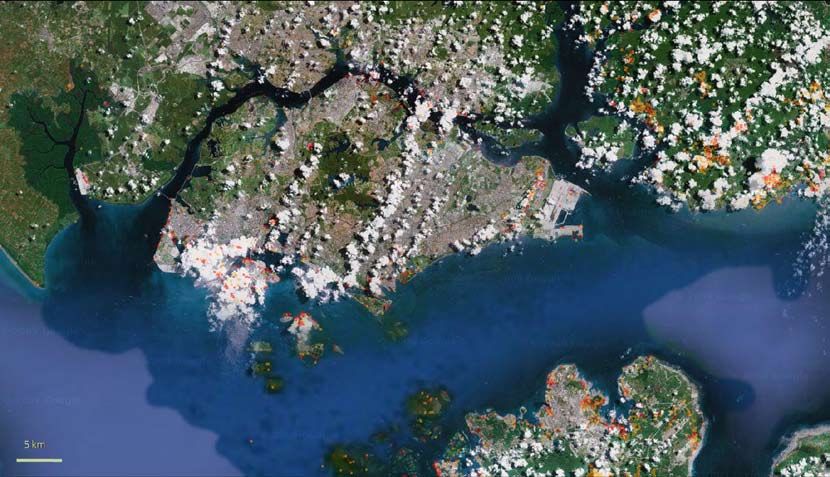
Section I

of exposure to climate change impacts. However, Hong Kong has relatively high adaptive capacity and therefore
is overall less vulnerable. Calcutta and Jakarta are ranked as having the fourth most exposure, with Bangkok
coming in close in the fifth spot. Not surprisingly, Phnom Penh, Singapore and Kuala Lumpur are ranked at the
low end of the exposure scale, but this is not implying that they are not at risk to climate change impacts. All
cities examined already see substantial threats with loss of life and significant damage costs, and the situation is
projected to worsen in the future.

2. Sensitivity

    8         10         7          7           6           6           9         7          6        5       6
   Dhaka     Jakarta   Manila    Calcutta   Phnom Penh Ho Chi Minh   Shanghai   Bangkok   Hong Kong   KL   Singapore

Sensitivity Ranking: People, Assets And GDP Under Threat
The relative sensitivity of the 11 selected cities to climate change impacts is based on population, gross domes-
tic product (GDP), and the relative importance of that city to the national economy. Using these criteria, Jakarta
stands out as the most sensitive to climate change impacts. This is largely due to Jakarta’s large population and
huge contribution towards national GDP. The second most sensitive city to climate impacts is Shanghai for simi-
lar reasons. Dhaka is third most sensitive, while Calcutta, Manila, and Bangkok are all tied for the fourth most
sensitive. Phnom Penh, Hong Kong, and Ho Chi Minh are fifth most sensitive, while Kuala Lumpur is sixth most
sensitive to climate change impacts.

3. Inverse Adaptive Capacity

    10         7         7          7          10           3           2         4          1        3       1
   Dhaka     Jakarta   Manila    Calcutta   Phnom Penh Ho Chi Minh   Shanghai   Bangkok   Hong Kong   KL   Singapore

Preparing To Face The Storm: Adaptive Capacity Comparison
We estimated the adaptive capacity of these 11 cities by examining the overall willingness of the city to imple-
ment adaptation strategies (calculated by the number of available adaptation examples and/or responses to pre-
vious impacts) and the per capita GDP. It should be noted that a significant caveat of this study is that there are
likely quite a number of adaptation examples that cannot be located with desk top reviews. For example, people
may come up with their own adaptation strategies in the face of climate change. However, mass media, the in-
ternet, and peer-reviewed journals will likely not pick up this information. In essence, the estimates for these 11
cities are just that, estimates based on existing information. For uniformity, we inversed the adaptation capacity
numbers so that low adaptive capacity is represented by a larger number (e.g., 10 equates to a very low adap-
tive capacity). Dhaka and Phnom Penh top the ranking as having the lowest adaptive capacity to climate change.
This is not a surprise as both countries, Bangladesh and Cambodia, are classified as Least Developed Countries
by the United Nations. Calcutta, Jakarta, and Manila have the second lowest adaptive capacity. Bangkok is next,
with Kuala Lumpur and Ho Chi Minh following. Shanghai has the second highest adaptive capacity, and Hong
Kong and Singapore tie for having the highest capacity.

                                                            5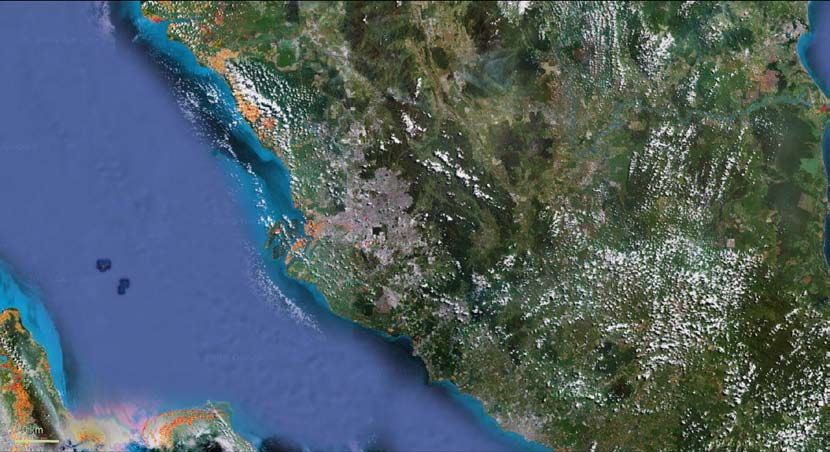
Section I

Policy Recommendations: How To Adapt Mega-Cities To Mega-Stress
Whether one examines one or all three components of vulnerability, it is evident that climate change will affect
Asian cities in many different ways. The latest science as reported by the Intergovernmental Panel on Climate
Change (IPCC) and others has highlighted the impacts in much more detail than previously available. This report
shows that these cities will be at the front line of climate change impacts. They therefore have a strong impera-
tive to act decisively to avoid the dangerous levels of warming and limit global temperature rise to well below
2°C compared to preindustrial levels. Allowing climate change to continue to go unchecked will cost more lives
and more money in the future, but if we act now, we can avert the worst impacts. The costs of avoiding the
worst impacts of climate change can be limited to around 1% of global GDP/year, whereas the costs of inaction
range from 5 to 20% of global GDP/year. To limit warming to 2°C with more than a 50% chance requires that
global emissions peak before 2015 and decline 80 to 95% below 1990 levels by 2050. Therefore, WWF calls on
developed countries to cut their emissions by at least 40% by 2020 and by at least 95% by 2050 compared to
1990 levels. To keep the global average temperature increase well below 2°C, the energy system needs to be al-
tered substantially and adaptation needs to start immediately. This is a political challenge that requires decision-
making structures to be put in place in order to drive such change. Governments, businesses, and the scientific
community should focus their efforts on delivering results, and this report provides some examples of local and
regional adaptation action, and local, regional and global policy efforts to support both adaptation and mitigation.
WWF hopes this report can be a starting point for further action.

                                                         6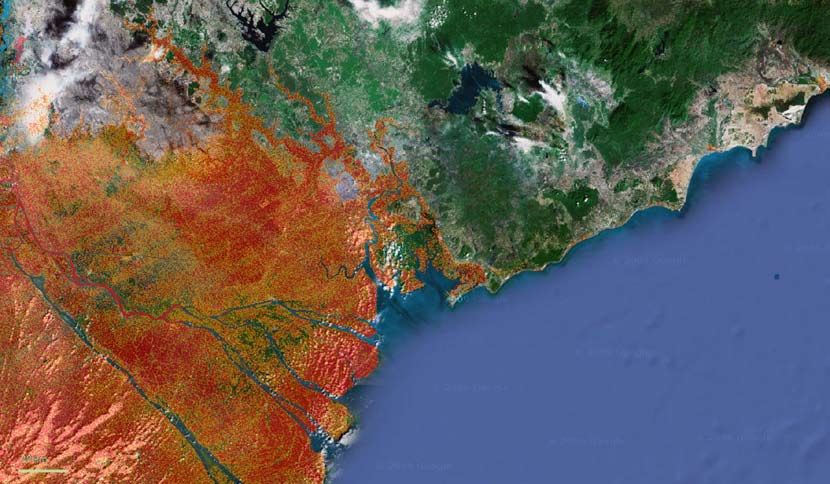
Section II

Context
Climate change is arguably the greatest global threat to sustainable development and natural resource manage-
ment that we face today. The concentration of atmospheric carbon dioxide (CO2) is now the highest in at least
800,000 years, primarily due to anthropogenic activities such as fossil fuel burning and land-use change. Since
the beginning of the 20th century, the average global temperature has risen by about 0.7°C. Unfortunately,
even if we were to stop all CO2 emissions right now, we can expect at least an additional 0.6°C global average
warming because of the emissions we’ve already released into the atmosphere and the inertia of feedbacks in
the climate system. Consequently, we are locked into about 1.3°C global warming, and while there is not much
we can do about that, it is crucial for the survival of entire nations and cultures to keep temperature rise as far
below the danger-threshold of 2°C as possible.
Two years after the release of the IPCC synthesis report, studies are now showing that the worst projections are
being realized and that the impacts are being felt around the world more and more. Recent synthesis has even
suggested that some regions of the world may already be faced with irreversible biophysical changes due to
climate change.

Asia’s Extreme Vulnerability
Asia is the most populous and arguably the most vulnerable continent in the world because of the high risk of
climate impacts and the relatively low adaptive capacity. Climate change and climatic variability in Asia have and
will continue to impact all sectors, from national and economic security to human health, food production, infra-
structure, water availability and ecosystems.
The evidence of climate change in Asia is widespread: temperatures in Asia have risen about 1°C to 3°C over the
last 100 years, with most of this warming in the North. Precipitation patterns have also changed and there has
been an increase in extreme weather events and sea levels have risen.

Impacts Here And Now, Tougher Challenges Ahead
Unfortunately, the full extent of climate change has likely not been fully realized. Climate change projections indi-
cate that temperatures will continue to rise, precipitation patterns will become more variable, extreme weather
events, such as intense rain storms, droughts, and tropical storms will increase in frequency and intensity, and
sea levels will continue to rise. Some of these changes will be sudden and could drastically re-shape how and
where people live.
In fact, climate change has the potential to push some of the most vital parts of our Earth over the edge and
lead to irreversible change, and some of these “tipping points” may occur this century (e.g., collapse of the
Indian summer monsoon season). Other changes include the shifting of climate zones, such as the tropics and
semi-arid regions, and the acidification of the oceans, endangering calcifying organisms like corals, which will
affect fisheries and our ability to feed large portions of the human population. Water availability and quality is
also changing, with glacier-fed rivers that spill into Asia and supply millions of people with drinking water at risk
of drying up. Compounding these effects are changes in precipitation patterns, which are impacting agricultural
production and have the potential to push large regions of semi-arid, marginal land out of production.

Coastal Areas And Deltas Especially Threatened
Coastal populations are at high risk of sea-level rise and associated impacts, including increased flooding and
salt water intrusion (see Figure 1). In addition to rising sea levels, much of Asia also suffers from considerable
subsidence (sinking of the land) due to heavy extraction of groundwater supplies, tectonic activity, and natural
ground movement. Coastal erosion, exacerbated by sea-level rise, also threatens vulnerable lands including
deltas. In fact, many of Asia’s largest cities, like the mega-cities analyzed in this report, were built on such deltas
and are consequently some of the most at risk to the impacts of climate change.
The IPCC and others highlight that the mega-deltas of the world are widely recognized as highly vulnerable
to the impacts of climate change, particularly sea-level rise and changes in runoff, as well as being subject to
stresses imposed by human changes in catchment and delta plain land use. Due to these compounding fac-
tors most deltas in Asia are experiencing accelerated rates of relative sea-level rise, which are above the global
average. Additionally, many deltas are receiving less sediment because of upstream dams, which also leads to
subsidence. Huge areas of land and large numbers of people are being affected by these changes, particularly in
Asia.

                                                           7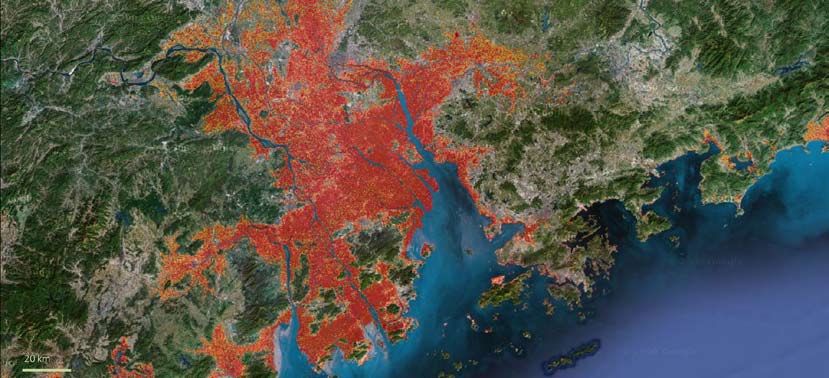
Section II

                                                                                           Figure 1.
                                  CLIMATE CHANGE
                                                                                           Climate change and
    Storms     Waves      Sea Level   Temperature     CO2 concentration    Run-off
                                                                                           the coastal system
                                                                                           showing major climate
                                                                                           change factors, including
                                                                                           external marine and
                               Natural         Societal                                    terrestrial influences.
   External                  Sub-system       Sub-system                     External
                                                                                           Adapted from IPCC 2007.
    Marine                                                                  Terrestrial
  Influences                                                               Influences

                                    Coastal System

Subsequently, there is a strong desire for more synthesis of climate change impacts to Asian cities and a frame-
work of solution-oriented adaptation measures. In response, WWF provides the following report, which draws
heavily on existing climate change research, including the IPCC and others.

Big Cities: Major Part Of The Problem, Key To The Solution
Many of the world’s cities play an important role in tackling climate change because they are as much a part of
the problem as they are a part of the solution. Cities cover less than 1% of the planet’s surface, and are home to
around 50% of the world’s population, and many of them see a rapid growth trend. Their share of responsibility
when it comes to climate change is massive: when compiled, cities and urban areas worldwide use 75% of the
world’s energy and are responsible for 75% of global greenhouse gas emissions.
Without major breakthroughs on energy efficiency and emission reductions in cities, we will fail to avoid danger-
ous climate change in urban as well as rural areas. However, cities are hotspots of innovation and technology
and have therefore traditionally been the places where many of the solutions to the world’s problems have been
developed, making cities potential leaders in the global effort for a low carbon future. This is also true for some
of the Asians cities covered in this report, which work hand in hand with cities in other parts of the world, identi-
fying and implementing solutions through cooperation.

Taking A Stand Against Climate Change: Asia’s Cities In Action
Bangkok, Dhaka, Hong Kong, Jakarta and Shanghai have joined the C40 group, a network of major cities from
around the world that are joining forces to tackle climate change. Highlighting the importance of cities when it
comes to the development and implementation of climate-friendly solutions, the mayors of these cities urge
their national governments to give them a significant role in making a low carbon future happen. They want
Heads of States to engage more closely with mayors, whose roles of responsibility mean that they are often
very well placed to deliver cuts in emissions. The C40 also urge governments to empower and adequately equip
city leaders, so that they have the authority and the resources required to take action within cities.
Many of the cities covered by this report also took a stand against climate action during Earth Hour, the global
WWF event on 28 March 2009 that saw hundreds of millions of people, about 4000 towns and cities in 88 coun-
tries, as well as 20,000 companies and 1000 iconic landmarks switch off their lights for one hour to call for a
fair, ambitious and binding climate treaty. In Bangkok, for example, Thailand’s Prime Minister personally pressed
the button when famous landmarks like the Grand Palace and the Temple of Dawn switched off. In Hong Kong,
most of the skyscrapers in the city’s famous skyline went dark. Jakarta switched off various iconic buildings and
landmarks including the National Monument, while Shanghai plunged the Oriental Pearl Tower into darkness. In
Kuala Lumpur, numerous celebrities witnessed the famous Petronas Twin Towers switch off, with similar actions
taking place in Manila, Singapore, Ho Chi Minh City and many other places around Asia and the world, making
Earth Hour the biggest demonstration for climate action to date.

                                                           8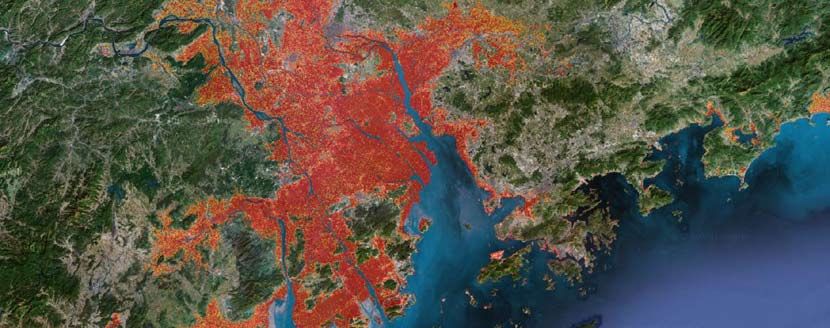
Section III
Criteria compared for each city: Methodology
Environmental Exposure This report highlights the most significant climate change
impacts that will affect some of Asia’s largest metropolitan
UÊ-ÌÀÊÌ Ài>ÌÊ areas including Ho Chi Minh (Vietnam), Bangkok (Thailand),
(tropical cyclones, storm surge) Phnom Penh (Cambodia), Shanghai (China), Hong Kong
ÊUÊ-i>iÛiÊÀÃiÊ>`ÊÃÕLÃ`iVi (China), Dhaka (Bangladesh), Calcutta (India), Jakarta (Indo-
nesia), Manila (Philippines), Kuala Lumpur (Malaysia), and
UÊ7>ÌiÀÊ
Singapore (Republic of Singapore). It also attempts to identify
(Flooding/drought)
some of the most feasible and economical near-term adapta-
tion options for these areas and suggests some constructive
Socio-Economic Sensitivity policy recommendations.
UÊ*i«iÊ«iÀÊVÌÞ The report builds on information from existing research and
UÊ7i>Ì Ê analysis. Information was compiled largely from the IPCC’s
(Gross Domestic Product) latest reports, specifically, “Working Group I: The Physical
Science Basis” and “Working Group II: Impacts, Adaptation
UÊ ÌÀLÕÌÊÌÊ>Ì>Ê *
and Vulnerability”. This report also draws heavily from a very
recent report by Anshory and Francisco (2009), “Climate
Adaptive Capacity
Change Vulnerability Mapping for Southeast Asia”. The An-
UÊ ÝÃÌ}ÊiÝ>«ià shory and Francisco report provided the foundation of the
UÊ*iÀÊV>«Ì>Ê * vulnerability assessment and much of the environmental and
socio-economic data.
This report divides the vulnerability assessment into short
sections for each city, providing a summary of the local situ-
ation for that particular city (i.e., city profile and observed climate change), significant climate change impacts
(including but not limited to sea-level rise, flooding, drought, tropical storms and storm surge), and lastly a sec-
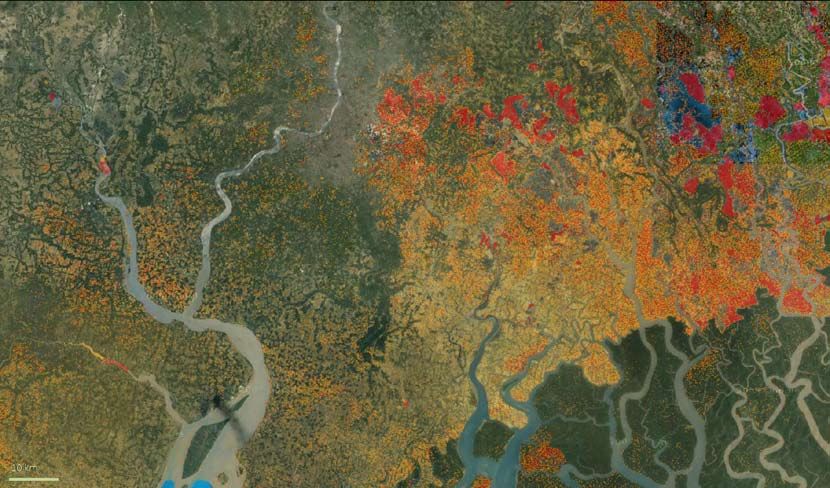
tion on potential adaptation options. Each city section also includes a satellite image superimposed with 1 m
sea-level rise and 2 m storm surge color layers that aim to illustrate what could happen in the future if no protec-
tion occurs.
In all, this report attempts to synthesize the climate change vulnerability of key major metropolitan areas (mega-
cities) in Asia. When assessing the vulnerability ranking and the environmental and socio-economic scores,
each city had a total maximum of 60 points (10 points possible per each of the six categories). Raw data was
standardized into a scale of 0 to 10 to allow for cross comparisons between data sets and cities. The purpose of
using a diverse array of criteria is because climate vulnerability is a function of not only the physical changes in
the climate, but also socio-economic factors, including number of people per city, assets threatened and costs
and adaptive capacity and costs.
Peer-reviewed literature and syntheses was used to assess the various impacts and adaptive capacity whenever
possible. However, due to the relatively recent awareness of climate change and the diverse array of impacted
sectors, many reports and information are likely not published in the peer-reviewed process or available by tra-
ditional means. While utilizing in-country colleagues as much as possible, the collection of information and data
for this report may be limited by the availability and dispersal of this information. The information provided within
this report is by no means an exhaustive assessment, but instead summarizes some of the more significant and
well-known impacts that will likely worsen in the future if greenhouse gas emissions continue to rise.
For this analysis, the vulnerability of the cities is a function
of the exposure, sensitivity, and adaptive capacity. These
Impacts that this report assesses:
three categories were averaged to get the overall vulnerabil-
UÊ/i«erature change ity score. Exposure is the average of the three highlighted
environmental categories (see box) including the susceptibil-
UÊ*ÀiV«Ì>ÌÊV >}i ity of the city to be impacted by 1 m sea-level rise, historical
frequency of extreme weather events, including flooding and
UÊ-i>iÛiÊÀÃi drought, and frequency of tropical storms and surges. Sen-
sitivity is based on population, GDP, and the relative impor-
UÊÊ ÝÌÀiiÊÜi>Ì iÀÊiÛiÌÃÊ
tance of that city to the national economy. Adaptive capacity
(flooding, drought, tropical storms,
is calculated by examining the overall willingness of the city
storm surge)
9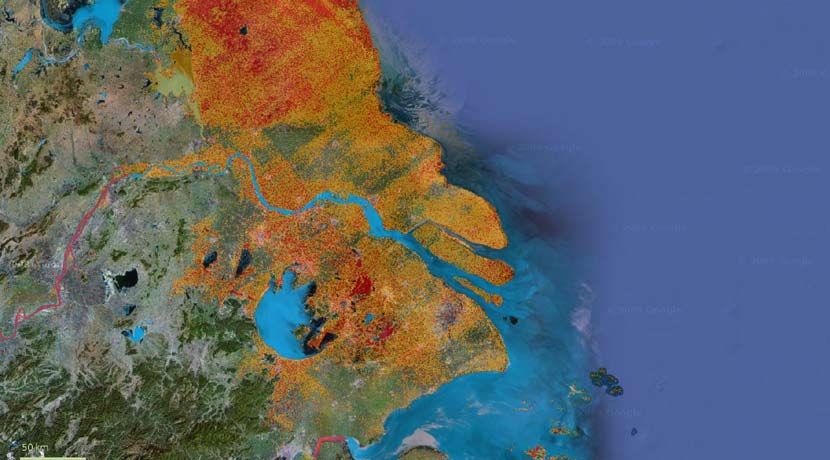
Section III

to implement adaptation strategies (calculated by the available adaptation examples and/or responses to previ-
ous impacts) and the per capita GDP. It should be noted that a significant caveat of this study is that there are
likely quite a number of adaptation examples that cannot be located with desk top reviews. For example, people
may come up with their own adaptation strategies in the face of climate change. However, mass media, the
internet, and peer-reviewed journals will likely not pick up this information. In essence, the estimates for these 11
cities are just that, estimates based on existing information. For uniformity, we inversed the adaptation capacity
numbers so that low adaptive capacity is represented by a larger number (e.g., 10 equates to a very low adaptive
capacity).
Apart from the overall vulnerability ranking that takes into account all the assessed criteria, this report also sum-
marizes a number of other comparisons including which city is most at risk of environmental threats, which city
is most socio-economically sensitive to climate change impacts and which city has the lowest adaptive capacity.
It should be noted that WWF has approached the issue of vulnerability in this report with the most simplistic
analysis possible, and while we appreciate that there are many additional factors to consider and alternative
methods for assessing vulnerability, we also hope that this report can provide a starting point for further discus-
sions on climate change impacts, sensitivity, adaptation, and appropriate policies and measures to respond to
the threat.

For this report, we use key IPCC definitions:
Adaptation
Adjustment in natural or human systems in response to actual or expected climatic stimuli or their effects, which
moderates harm or exploits beneficial opportunities. Various types of adaptation can be distinguished, including
anticipatory, autonomous and planned adaptation:
  Anticipatory adaptation
  Adaptation that takes place before impacts of climate change are observed. Also referred to as proactive adap-
  tation.
  Autonomous adaptation
  Adaptation that does not constitute a conscious response to climatic stimuli but is triggered by ecological
  changes in natural systems and by market or welfare changes in human systems. Also referred to as sponta-
  neous adaptation.
  Planned adaptation
  Adaptation that is the result of a deliberate policy decision, based on an awareness that conditions have
  changed or are about to change and that action is required to return to, maintain, or achieve a desired state.
Adaptive capacity
The ability of a system to adjust to climate change (including climate variability and extremes) to moderate po-
tential damages, to take advantage of opportunities, or to cope with the consequences.
Resilience
The ability of a social or ecological system to absorb disturbances while retaining the same basic structure and
ways of functioning, the capacity for self-organisation, and the capacity to adapt to stress and change.
Vulnerability
Vulnerability is the degree to which a system is susceptible to, and unable to cope with, adverse effects of
climate change, including climate variability and extremes. Vulnerability is a function of the character, magnitude,
and rate of climate change and variation to which a system is exposed, its sensitivity, and its adaptive capacity.

                                                         10
Dhaka, Bangladesh
City Profile
Dhaka is the capital and center of political, cultural and
economic life in Bangladesh. With a population of over 13
million, it’s also one of the largest cities in Southeast Asia.
In fact, Dhaka is reportedly the 9th largest urban center in
the world, by far the most densely populated, and growing
at one of the fastest rates in Asia. Dhaka’s population is es-
timated to be 25 million by the year 2025. Dhaka is situated
on the Buriganga River or “Old Ganges” within the Ganges-
Brahmaputra megadelta. The city proper covers an area of
154 km2, however the Dhaka district has an area of nearly
1500 km2.
Dhaka is truly a cosmopolitan city and the center of Persio-
Arabic and Western cultural influences in the Eastern Indian
subcontinent. With an ever increasing population, Dhaka has
significant problems with congestion, pollution and a relative-
ly low level of public services, lowering its already low adap-
Vulnerability Score = 9 tive capacity. Poverty is massive in Dhaka. The annual per
Environmental Exposure 8 capita income of Dhaka is estimated at US$500, with 48%
of households living below the poverty line. Many people
Storm threat 4 come from rural areas in search of employment and survive
Sea-level rise 9 on less than US$10 a day. As a result the city has massive
issues with solid waste and consequently one of the highest
Flooding/drought 10
rates of deaths from infectious diseases of any city in Asia.
However, the city attracts more and more people, large for-
Socio-Economic Sensitivity 8 eign investments, and increasing volumes of commerce and
Population 6 trade. Dhaka has by far the most developed infrastructure
in Bangladesh and has recently seen the modernization of
Assets threatened 10
transport, communications and public works.
Inverse Adaptive Capacity 10 The gross domestic product (GDP) of Bangladesh in 2008
was about US$82 billion and was growing by about 4 to 6%.
The purchasing power parity (PPP) is about US$224 billion
(2008) and the GDP per capita was about US$1500 in 2008.
The service sector is about 52% of total GDP, thus by far the largest sector. Industry makes up about 29% of GDP, while agriculture
constitutes about 19% (2008). Bangladesh exports a significant amount of labor to other parts of the world, including Saudi Arabia,
Kuwait, UAE, Oman, Qatar, and Malaysia. Workers’ remittances are estimated at US$4.8 billion in 2005-06.
Dhaka is characterized by a hot, wet and humid tropical climate. The city experiences a monsoon climate with average tempera-
tures ranging between 18°C in January and 29°C in August. The vast majority (80%) of precipitation occurs between May and
September and averages about 1,800 mm per year.
Observed Climate Change
The IPCC highlights that Bangladesh is warming with an increasing trend of about 1°C in May and 0.5°C in November during the 14
year period from 1985 to 1998. More rain has fallen too - on average, decadal rain anomalies have been above long term averages
since 1960s.
Impacts
Sea-level rise, storm surge, and flooding are the biggest threats to Dhaka, and the city ranks 8 out of 10 for exposure. It is estimat-
ed that with a 1 m rise in sea level, Bangladesh would lose approximately 1,000 km2 of cultivated land and much of its sea prod-
uct culturing area. Exacerbating the effects of sea-level rise, Bangladesh and Dhaka sit only meters above current sea levels and
unfortunately the city is sinking due to subsidence, estimated at 0.6 to 1.9 m. Due to this subsidence and sea-level rise, the IPCC
projects that salt-water intrusion could reach up to 100 km from the coast, impacting thousands of people. Salt-water intrusion will
impact the availability and quality of freshwater and rice production, a huge source of food for the region. In fact, climate change
projections suggest that production of rice and wheat might drop by 8% and 32%, respectively, by midcentury. Salt-water intrusion
will not only impact freshwater availability but also the natural ecosystems, such as mangroves that currently buffer the coast from
storm surges. There is an estimated 10,000 km2 of mangroves within the Ganges- Brahmaputra megadelta. These critically impor-
tant ecosystems currently limit the effects of sea-level rise and storm surges, but massive storm surges have already occurred. In
fact, tropical cyclone-induced 6-m storm surges have lead to 500,000 deaths in 1970 and 150,000 deaths in 1991, and misplacing
millions of people. Future losses could be even more without current mangrove forests to buffer the effects.
11Dhaka, Bangladesh
Other climate impacts include flooding due to extreme rainfall during the monsoon seasons and drought during prolonged dry peri-
ods. While observed climate data indicates that on average, more rain has fallen, it is not uncommon for the majority of annual pre-
cipitation to fall during just a few extreme events. In fact, devastating floods in 2004 affected 38% of Bangladesh, destroying more
than three-quarters of crops and leaving 10 million people homeless. The socio-economic sensitivity of Dhaka is high (10 out 10).
The projected increased intensity of tropical cyclones will exacerbate Dhaka’s vulnerability. In fact, Dhaka already has a high degree
of vulnerability because it is exposed to so many impacts. 174 natural disasters happened between 1974 and 2003. Additionally,
many of Dhaka’s residents are currently homeless and are forced to live on and cultivate nearby flood-prone land, thus further driv-
ing up their vulnerability. They have limited access to safe housing and even less access to more profitable livelihood opportunities.
Soil degradation, erosion, deforestation, pollution, diseases, and heavy extraction of groundwater all add to Dhaka’s vulnerability.
Adaptation
Bangladesh is very poor and the country as a whole has very little adaptive capacity to deal with climate impacts. Dhaka is in a
somewhat better position because the majority of the wealth is concentrated there and it is the country’s economic, political, and
cultural center. However, implementing wide-scale adaptation options for all of Dhaka’s 13 million residents will be extremely chal-
lenging. Further complicating Dhaka’s ability to adapt to climate impacts is the trend that many water bodies and wetlands around
Dhaka are being filled to construct multi-storied buildings and other real estate developments. Increasing ground water use also
compounds vulnerability and complicates decision-making for viable adaptation options. There are good examples of adaptation at
the community level throughout Bangladesh, such as diversifying crops, water management schemes and growing food on float-
ing beds. While these examples can be found in Bangladesh, they are not widespread and large, multi-regional projects such as
the integrated water management should be monitored closely and potentially replicated to other sectors quickly. Consequently,
without adequate protection Dhaka’s poor will be exposed to a high degree of risk from floods and extreme weather events, such
as tropical cyclones and associated storm surges.
N
1 m sea-level rise
2 m storm surge
50 km
© 2009 Google Map
12Jakarta, Indonesia
City Profile
Jakarta is the economic, cultural, and political center of
Indonesia. It is also capital of Indonesia and has the largest
true city population in Southeast Asia, estimated at 8.5 mil-
lion. Jakarta’s metropolitan area, called Jabodetabek, is the
sixth-largest in the world with over 24 million. Jakarta covers
662 km2 and is located on the northwest coast of Java at
the mouth of the Ciliwung River on Jakarta Bay. Jakarta also
includes the Thousand Islands, located just north of the city
in Jakarta Bay.
The topography of Jakarta varies, with the northern part just
meters above current sea level and lying on a flood plain.
Subsequently, this portion of the city frequently floods. The
southern part of the city is hilly. In addition to the Ciliwung
River, there are about 12 other rivers that drain the hilly
southern part of the city into the sea. The Ciliwung River is
the most significant river and divides the city West to East.
Vulnerability Score = 8
Jakarta has historically been a key trading port in the region
Environmental Exposure 6 and continues to be economically important. Jakarta’s
Storm threat 2 economy depends heavily on financial services, which con-
tribute almost a quarter of the national GDP. Consequently,
Sea-level rise 8 Jakarta scored 10 out of 10 for sensitivity because of this
Flooding/drought 9 huge contribution towards national GDP and the city’s large
population. Trading, manufacturing, and tourism also make
Socio-Economic Sensitivity 10 significant contributions. Jakarta’s manufacturing sector
includes electronics, automotive, chemicals, mechanical en-
Population 10 gineering and biomedical sciences. While there is significant
Assets threatened 9 wealth in Jakarta, the city has massive problems because of
the extreme population growth, high levels of poverty, and
Inverse Adaptive Capacity 7 inequitable distribution of wealth. Jakarta has struggled to
provide basic needs such as water, shelter and waste man-
agement for some of its poorest residents.
Jakarta has an equatorial tropical climate (hot and humid). Temperatures are very consistent, ranging from an annual average low of
23°C to an annual high of 32°C. Jakarta gets significant amounts of precipitation, totaling almost 2,200 mm annually. Jakarta’s wet
season peaks with an average 400 mm of precipitation during January and a dry season average rainfall of 70 mm during August.
The city is humid throughout the year.
Observed Climate Change
Indonesia has become warmer over the last century, with temperatures increasing by about 1°C during the wet season and 1.4°C
during the dry season. Annual precipitation overall has decreased by 2 to 3% across all of Indonesia over the last century. However,
there is significant spatial variability, with a decline in annual rainfall in the southern regions of Indonesia (e.g., Java, Lampung,
South Sumatra, South Sulawesi, and Nusa Tenggara) including Jakarta and an increase in precipitation in the northern regions of
Indonesia (e.g., most of Kalimantan, North Sulawesi). There has also been a shift in the seasonality of precipitation (wet and dry
seasons); in the southern region of Indonesia the wet season rainfall has increased while the dry season rainfall has decreased,
whereas the opposite pattern was observed in the northern region of Indonesia.
Impacts
Climate change has and will continue to impact Indonesia. A recent mapping vulnerability assessment suggests that the western
and eastern areas of Java Island (including Jakarta) are at particular threat to droughts, floods, landslides, and sea-level rise. Jakarta
is at high risk of climate impacts because it is frequently exposed to significant flooding and landslides and it is one of the most
densely populated areas in Southeast Asia. The wet season in Jakarta has become wetter and therefore the city experiences more
flooding, which is compounded by clogged sewage pipes and waterways and the fact that much of the city is at or near sea level.
Previous floods have wrecked havoc on the city. Major flood events in 1996 and 2007 submerged 5,000 hectares of land with
losses from infrastructure damage and state revenue estimated at US$572 million. These two floods also killed at least 85 people
and forced about 350,000 people from their homes. Approximately 70% of Jakarta’s total area was flooded with water up to 4 m
deep in parts of the city. Unfortunately, more severe and frequent flooding is projected for the near future and sea-level rise will
compound the impacts, making it more difficult and expensive to respond. Consequently, for this analysis, Jakarta ranked a 6 out
of 10 for environmental exposure.
13Jakarta, Indonesia
Sea-level rise also threatens Jakarta and the city is at risk of losing more land quickly. Specifically, sea levels in Jakarta Bay are
expected to rise at a rate of 57 mm per year, which could submerge as much as 160 km2 of northern Jakarta by 2050 and per-
manently inundate some areas. Unfortunately, the poor will be the hardest hit. According to a sustainable development report
on climate change much of Jakarta’s population, an estimated 1.2 million people, are currently concentrated in vulnerable coastal
slum communities. Lack of infrastructure in these slum communities leaves residents highly vulnerable to climate change-related
events. Adding to the impacts affecting Jakarta, sea-level rise has also caused salt water intrusion into coastal freshwater and
groundwater resources, leading to more water shortages brought about by declining rainfall and overexploitation of groundwater.
Saltwater intrusion in the shallow and deep aquifers of Jakarta has reportedly reached 10 to 15 km inland. Rising sea levels have
also accelerated inundation and land subsidence in coastal cities and communities, resulting in considerable losses to tourism and
aquaculture industries.
Adaptation
Jakarta is highly vulnerable to climate change and must take mitigation action now in order to contribute to the reduction of global
greenhouse gas emissions. This is crucial to prevent future climate impacts and improve chances for adequate adaptation action to
withstand climate change. Subsequently, Jakarta has a number of good adaptation examples and therefore scored 7 out of 10 for
adaptive capacity. However, by implementing additional adaptation measures, millions of lives can be spared and millions of dollars
saved. Improved urban planning and infrastructure, such as water and waste services, can not only minimize climate impacts but
also increase sustainable development. Adaptation actions include the creation of new green open spaces, improvement of waste
management (including behavioral change of Jakarta citizens in treating their waste) and maintaining and improving infrastructure
including water and sewers. In order to cope with the impacts that are already inevitable, adaptation should be employed as soon
as possible and the IPCC has suggested the following to enhance social capital and reduce the vulnerability to climate change:
increase education and technical skills, increase income levels, improve public food distribution, and improve disaster preparedness
and management and health care systems through sustainable and equitable development. For Jakarta, adaptation measures that
address sea-level rise, increased extreme weather, and threats to ecosystems and biodiversity should be a high priority. Increased
water storage and better early El Niño warning systems could also help residents prepare for climate change. The long-term effects
of sea-level rise demand that Jakarta considers the effects of 1,000-year storm-surges and, in response, provides substantial pro-
tection of current socio-economic activities and highly vulnerable parts of the city.
Sustainable management of coastal zones through Integrated Coastal Zone Management (ICZM) could also provide effective
coastal protection and maximize the benefits provided by coastal zones. Conservation of mangroves can also help protect against
storm surges, coastal erosion and strong wave actions as demonstrated by the Indian Ocean tsunami of 26 December 2004.
While there are multiple issues that may hinder adaptation, such as poverty, insufficient information and knowledge on climate
impacts and limited information on the costs and benefits of adaptation, Jakarta needs to build on existing adaptation examples
before the full extent of climate change is felt by its poorest and most vulnerable citizens.
N
1 m sea-level rise
2 m storm surge
50 km
© 2009 Google Map
14Manila, Philippines
City Profile
Manila is the national capital and the financial, commercial,
and industrial center of the Philippines. Manila’s metropoli-
tan area, which is comprised of 17 local government units,
has a population of about 11.5 million people (2007), covers
about 636 km2, and has a density of just over 18,000 people
per km2, thus translating to a socio-economic sensitivity to
climate change impacts of 7 out of 10. Manila ranks as the
fifth largest urban area by population in the world and second
in Southeast Asia (Jakarta is first). If the surrounding suburbs
in the adjacent provinces of Greater Manila are included,
the population swells to around 20 million. This area creates
32% (US$124 billion (PPP) in 2007) of the national GDP. Due
to Manila’s protected harbor, it is also the main seaport for
the Philippines and a major manufacturing center, produc-
ing chemicals, steel, textiles, clothing, and electronic goods.
Manila is similar to many large cities around the world and
Vulnerability Score = 8 is characterized by economic extremes with a huge dispar-
ity between the few who control much of the wealth and
Environmental Exposure 9 the massive number of people who are below the poverty
Storm threat 10 line. Reportedly, 97% of the total GDP in the Philippines is
controlled by 15% of the population.
Sea-level rise 8
Manila’s primary waterway is the Pasig River, which mean-
Flooding/drought 10
ders through the metropolis, passing through Manila before
draining into Manila Bay. The metropolitan area is built on the
Socio-Economic Sensitivity 7 alluvial deposits of the Pasig River and on some reclaimed
Population 5 land from Manila Bay. The average elevation of metropolitan
Manila is a mere 10 m.
Assets threatened 9
Manila is one of the major tourist destinations in the Philip-
Inverse Adaptive Capacity 7 pines and the city attracts over 1 million visitors per year.
In 2000, net tourism income totaled US$2.1 billion and is
growing fast. It is projected that at the current growth rate,
Manila’s tourism volume will surpass that of Singapore by
the year 2020.
Lying just north of 14 degrees longitude, Manila has a tropical wet and dry climate (also referred to as a tropical savanna climate).
Average temperatures range from lows of 21°C in January to highs of 33°C in April and May. Precipitation varies throughout the
year but typically December through March is generally dry and June to October is generally wet. Average precipitation is about
200 mm a year.
Observed Climate Change
The Philippines has seen an increase in temperature. Between 1961 and 1990, mean annual temperature has increased about
0.61°C, maximum temperature has increased 0.34°C, and minimum temperatures has increased 0.89°C. Subsequently, the fre-
quency of hot days and warm nights has also increased, while the number of cold days and cool nights decreased. There has also
been an increase in the annual mean rainfall since the 1980s and an increase in the number of rainy days since the 1990s. Like so
many other regions in Southeast Asia, Manila has also experienced an increase in the year to year onset of rainfall.
Impacts
The Philippines could see temperatures rise anywhere between 1.2 and 3.9°C by 2080 with increasing climate impacts, such as
tropical cyclones, sea-level rise, floods, and droughts. Manila ranked a high exposure score (9 out of 10) because it is threatened by
a number of climate impacts. Cyclones will likely impact the northern and eastern parts of the country the most, whereas floods,
landslides and droughts may plague the rest of the Philippines. Overall, annual rainfall has increased and when combined with
tropical storms, has led to extreme rain, floods, and landslides in 1990, 2001, 2004, and 2009. Manila is particularly vulnerable to
flooding from both extreme rains and tropical storms, as just seen with the latest tropical cyclone Ketsana (Ondo) in September
2009, which by latest accounts has affected over 4.3 million people, displaced nearly 500,000 and killed over 337. The recent storm
damage is estimated at US$230 million. On a country-wide scale, cyclone-triggered floods are not uncommon. For example, the
2001 Camiguin flood was triggered by tropical typhoon Nanang and affected more than 35,000 people and killed 157. Total dam-
age was estimated at US$96 million. There are other recent examples of deadly landslides including the 2006 Guinsaugon, Leyte
15Manila, Philippines
landslide, which was triggered by super typhoon Reming, killing 1,126 people. During that same storm, the Legazpi, Albay landslide
killed 1,399 people. These two landslides affected more than 800,000 families and are considered the world’s second and third
deadliest disasters of 2006.
Droughts, extreme rain and storms are projected to get more intense and variable in the future in the Philippines and can be
strongly influenced by increasingly frequent inter-annual climate extremes (e.g., El Niño Southern Oscillation [ENSO] events).
Droughts are normally associated with El Niño events in the Philippines, and the 1997 to 1998 event provides some insight into
what more is to come under climate change.
During this event, the Philippines experienced severe water shortages, massive crop failures, huge forest fires, and coral bleaching.
Consequently, Metro Manila’s main reservoir of water, the Angat dam, saw declining input. Storage was reduced by 10%, resulting
in water rationing in some areas. It also affected hydroelectric plants that provide power to surrounding cities. Unfortunately, the
combination of drought years with rising sea levels means that already stressed water areas will get worse.
During the last 20 years, the intensity of tropical cyclones has significantly increased, causing extensive damage to property, as-
sets, and human life. They are projected to further increase in frequency and intensity. Adding to the damage, storms are usually
accompanied by torrential rains that cause landslides and flash floods, killing people and destroying property and agricultural crops.
According to statistics, 80% of disasters occurring in the Philippines over the past 100 years have been weather-related, with
typhoons and floods contributing the most. Sea-levels around Manila are also rising and an increase anywhere from 0.4 to 1.0 m
by the end of century is expected, partially due to local subsidence and continued ground water extraction. This degree of change
could displace over 2.5 million people and inundate over 5,000 ha of the Manila Bay coastal area. These risks will be further intensi-
fied if storm surges associated with intense storm activity increase. Coastal erosion is also increasing and is exacerbated by the
increase in storms, beach sand mining, and destruction of coral reefs, mangroves and sand dunes.
Adaptation
Due to the high risk of tropical storms, floods, droughts, and sea-level rise, adaptation is critical for Manila and the rest of the
Philippines. Relevant adaptation measures may include early warning systems to alert residents of approaching tropical cyclones
so that they may avoid high impact areas and better prepare emergency supplies. Other adaptation measures may include design-
ing and building appropriate infrastructures to better protect citizens and allow for massive evacuation if necessary. Installation and
maintenance of weather prediction (e.g., Doppler radar to predict precipitation) and hazard warning systems, especially during rainy
and tropical storm seasons, is generally a good idea to minimize damage and loss of life. The Philippines can also learn from other
case studies. In Cairns, Australia, for example, cyclone experience and education may have contributed to a change in risk percep-
tions and a reduction in the vulnerability of residents to tropical cyclone and storm surge hazards.
Protecting and restoring natural ecosystems is another progressive adaptation measure, which has proven to be highly cost-
effective. Unfortunately, large-scale conversions of coastal mangrove forests to shrimp aquaculture, fish ponds, and salt beds have
occurred during the past three decades in the Philippines. Nonetheless, with adequate protection and restoration these ecosys-
tems can help minimize wave energy from storms and buffer the coastline from impacts. Coral reefs have also proven to be hugely
beneficial for the protection of coastline and also provide many with food and livelihoods. Many of these natural systems are at a
critical threshold, and if appropriate capacity is put into conservation and sustainable development, they can be protected. Revisit-
ing/re-designing Manila’s urban plan (or lack thereof) is also critical. Relocating communities in high-risk areas as well as critical
waterways (i.e., communities can impede water drainage during storms) is also important. Likewise, reforesting watersheds and
mountains surrounding Metro Manila will significantly reduce surface run-off, which was a main contributor to the recent Septem-
ber flooding.
Poor adaptation measures, sometimes referred to as maladaptation, are a risk. Even activities that are meant to prevent erosion,
such as building of sea walls and ripraps, have been found to have contributed to the problem, so caution is needed. Manila scores
7 out of 10 for inversed adaptive capacity, so the protection of natural systems, such as mangrove forests and coral reefs and other
no-regret adaptation strategies can and should be implemented immediately.
N
1 m sea-level rise
2 m storm surge
20 km
© 2009 Google Map
16Calcutta, India
City Profile
With more than 15 million people, Calcutta is the third larg-
est metropolitan area in India and the 8th largest urban area
in the world. Calcutta includes the city proper, Kolkata, which
is the capital of the Indian state of West Bengal. Situated
on the banks of the River Hooghly, Calcutta is within the
Ganges Delta and thus only meters above current sea level.
Having to expand the city to accommodate for the swelling
population, Calcutta has reclaimed significant amounts of the
surrounding wetland. Consequently, the city sits on alluvial
deposits and within a considerable seismic zone, and thus is
prone to earthquakes.
Calcutta used to be the capital of India and was once the
center of industry, culture, and politics. While it had expe-
rienced a significant economic downturn since the 1950s,
it has recently made an upturn and is now growing. Similar
to other metropolitan areas in India, however, Calcutta has
Vulnerability Score = 7 problems with widespread poverty, infrastructure, and pol-
Environmental Exposure 6 lution, particularly air and water pollution. Calcutta is eastern
India’s main center for business, commerce and finances
Storm threat 3 and a major commercial port. It is also the only city in the
Sea-level rise 8 region to have an international airport, which - if shut down
due to extreme weather events - could significantly disrupt
Flooding/drought 7
regional travel. Calcutta ranked 7 out of 10 for socio-econom-
ic sensitivity to climate impacts. Following independence,
Socio-Economic Sensitivity 7 Calcutta has experienced a steady economic decline until
Population 7 just recently and Calcutta’s economic upturn has been led
largely by IT services, which have grown at a staggering 70%
Assets threatened 6
yearly, twice the national average. Needless to say, there has
been a surge in the demand for housing, with new develop-
Inverse Adaptive Capacity 7 ments hastily popping up throughout the area.
Calcutta’s climate is typical of the region. It has a tropical wet-and-dry climate also referred to as tropical savanna climate. As a
result, temperatures are rather constant with an annual mean temperature of 27°C. Further, mean monthly temperatures only
range from 19°C to 30°C. Wet seasons are characterized by hot and humid weather, while dry seasons typically experience 40°C
temperatures during May and June. Calcutta also experiences seasonally heavy rains, which can lead to flooding. Average precipi-
tation is 1,582 mm and usually comes off the Bay Bengal during June and September. August sees the highest amount of rainfall
averaging over 300 mm.
Observed Climate Change
Similar to Bangladesh, Calcutta has seen significantly warming temperatures and changes in rain patterns. Specifically,
temperatures have increased about 0.68°C over the last century, with increasing trends in annual mean temperature and more
pronounced warming following the monsoon season and during winter. While the total number of rainy days has dropped along
India’s east coast, more rain seems to fall during the already wet summer monsoon season.
Impacts
Due to Calcutta’s location and size it is particularly at risk of climate change impacts. Calcutta’s environmental exposure is ranked
at 6 out of 10. Sea-level rise and storm surges will inundate large proportions of the city and surrounding areas over the next few
years. In fact, a 1 m rise in sea level could potentially inundate 5,763 km2 in India. In addition to sea-level rise, a ground subsidence
of 0.6 to 1.9 mm per year is adding to the risk in the Ganges Delta. Due to the combined effects of sea-level rise and subsidence,
the Ganges Delta will likely see salt water intrude 100 km from the coast, greatly impacting ground water supplies. Compounding
the effects of salt water intrusion, over-exploitation of groundwater in and around Calcutta has lead to a drop in its level, leading to
further intrusion of sea water and thus making the subsurface ground water saline. Droughts have been more frequent in the last
few decades and are projected to get worse, which will lead to even more salt-water intrusion and thus deteriorate surface and
groundwater quality. In fact, India may reach a state of severe water shortage and stress before 2025 when the water availability
per capita is projected to drop below 1,000 m3 per year, compared to the level in 2001 of 1,820 m3 per year.
The IPCC projects a decrease in winter precipitation over the Indian subcontinent, which would reduce the total seasonal precipita-
17You can also read