Housing Market Analysis Update - Belfast City Council Area September 2017 - DPS0
←
→
Page content transcription
If your browser does not render page correctly, please read the page content below
DPS0

     Housing Market
     Analysis Update

Belfast City Council Area

        September 2017
Contents

CONTENTS                                                 2
               SECTION 1: INTRODUCTION AND CONTEXT
INTRODUCTION                                              5
HOUSING MARKET AREAS                                      7
POLICY CONTEXT                                           10
UK Government Spending                                   10
Northern Ireland Budget                                  11
The UK’s Relationship with the European Union            13
Welfare Reform                                           13
The Northern Ireland draft Programme for Government      16
Housing White Paper ‘Fixing Our Broken Housing Market’   17
The Housing Strategy 2012-17                             17
Community Planning                                       19
Planning Policy Context                                  20
NORTHERN IRELAND HOUSING MARKET                          23
Tenure                                                   23
Affordability and House Prices                           24
Transactions                                             31
New Build                                                31
                 SECTION 2: HOUSING MARKET DRIVERS
ECONOMY                                                  35
International and UK Economy                             35
Northern Ireland Economy                                 35
Belfast Economy                                          36
Future Prospects                                         41
DEMOGRAPHIC TRENDS                                       43
Population Trends                                        43
Minority Ethnic Communities                              44
Household Trends                                         47
Household Projections                                    47
Future Prospects                                         48
REGENERATION                                             49
PURPOSE BUILT STUDENT HOUSING (PBSA)                     55
EMPTY HOMES                                              58
ACCESSIBLE HOUSING                                       60
                        SECTION 3: TENURES
OWNER OCCUPATION                                         63
House Prices and Affordability                           64
Transactions                                             68
Housing Stock                                            69
Intermediate Housing                                     71
                                                              2
DPS024

Future Prospects                         72
PRIVATE RENTED SECTOR                    74
Expansion of the Private Rented Sector   74
Tenant Profile                           76
Dwelling Stock                           77
Affordability                            79
Houses in Multiple Occupation (HMOs)     81
Future Prospects                         82
SOCIAL HOUSING IN BELFAST                84
Social Housing Need in Belfast           85
Homelessness                             88
Supported Housing                        90
Social Wheelchair Housing                90
Traveller Accommodation                  90
Asset Management Strategy                91
CONCLUSION
Conclusion                               93

                                              3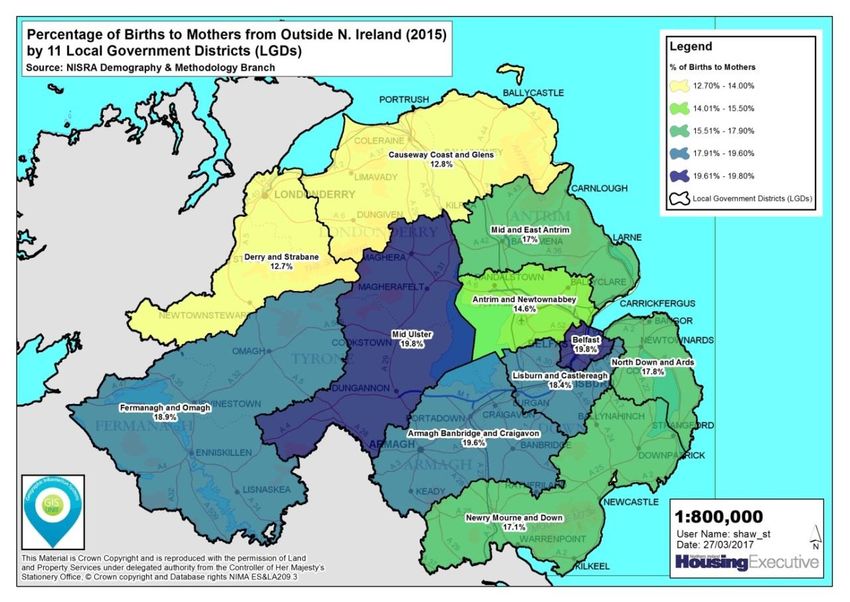
Section 1:
Introduction and Context

                           4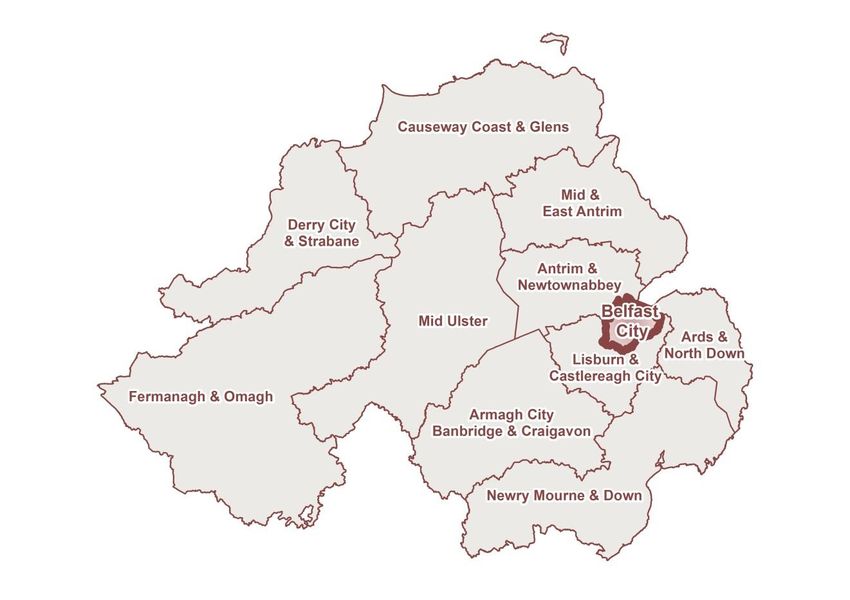
DPS024

Introduction
Adequate housing is a human right, essential to human dignity, security, health and
wellbeing. The right to adequate housing, is a key component of the right to an
adequate standard of living, as access to housing can be a precondition for the
enjoyment of several human rights, including the rights to work, health, social
security, vote, privacy, education and the rights of the child. The spatial
organisation of housing can also promote or hinder social cohesion, equity and
inclusion.

As recognised by the Regional Development Strategy (RDS) and the Spatial Planning
Policy Statement (SPPS), planning plays a crucial role to ensure all people have
access to a decent, connected, safe, affordable and well-located home. Planning can
supply a variety of housing options and can enhance the supply of land for housing,
to encourage mixed income development to reduce segregation and exclusion.

The purpose of a Housing Market Analysis (HMA) is to provide evidence in order to
develop integrated housing policies and approaches. Therefore, this HMA Update
can be important to inform Local Development Plans (LDP) housing policies
contained in both the Plan Strategy and Local Plan Policy Stages, in order to
facilitate each household’s access to appropriate housing.

The Housing Executive published 11 Housing Market Analysis (HMA) from 2011 to
2013. This included the Belfast Metropolitan Housing Market, the largest housing
market in Northern Ireland. These HMAs were not based on council boundaries but
on housing market areas, defined using Travel to Work Areas. The purpose of this
document is to provide an update on the HMA, by examining the current housing
market and housing issues. Unlike the original Belfast Metropolitan HMA, this
document will focus on the Belfast City Council area, in order to provide councillors,
planners, the public and stakeholders with an accessible evidence base which can be
referred to when taking decisions on housing and planning strategies, at the Council
level.

The Department of the Environment issued the SPPS in September 2015. It states
that the Housing Executive will carry out a Housing Needs Assessment/Housing
Market Analysis and that this:

‘provides an evidence base that must be taken into consideration in the allocation,
through the development plan, of land required to facilitate the right mix of housing
tenures including open market and special housing needs such as affordable housing,
social housing, supported housing and travellers’ accommodation. The Housing Needs
Assessment (HNA) will influence how LDPs faciltiate a reasonable mix and balance of
housing tenures and types.’

                                                                                    5
This HMA update provides a regional and local housing market context, identifying
key housing market drivers, and provides an overview of the three main tenures,
social housing, (including general needs, supported and traveller accommodation),
the Private Rented Sector and Owner Occupied sector. In recent years the main
housing market drivers have included:
The economy;
Demographics;
Empty homes;
Purpose Built Student Housing (PBSA); and
Regeneration
While the HMA considers each tenure separately, it should be acknowledged that
housing tenures are fluid and interact, with the dynamics of one tenure often
affecting supply and demand in another. For example, a lack of affordable owner
occupied housing offers first time buyers an alternative to rent privately. In addition
prospective social housing applicants will also look to the private rented sector, with
the support of housing benefit, where turnover in social housing is limited in their
areas of choice.
It should be noted that there is a lack of current and/or local data for some of the
drivers and categories of housing need; in this instance, we have used the latest data
that is available. While it would be benefical to have some of this information fully
updated, we still believe that these records are useful to identify regional and local
trends.
In addition, an annual Housing Need Assessment (HNA) update of social housing
need will be presented to the Council each year within the Housing Investment Plan
(HIP), in order to assist the Council in the monitoring and review of the LDP. Annual
monitoring will enable the Council to evaluate how the objectives of the LDP are
being achieved, and it will inform Plan Reviews. The annual HNA will also be a
material consideration in the determination of planning applications.
6DPS024
Housing Market Areas
In 2010, the Housing Executive commissioned research on housing market areas
(HMAs) in Northern Ireland. The purpose of identifying housing market areas is to
gain a spatial understanding of how the housing market functions in a number of
defined geographical areas. This can help determine housing priorities and policy
decisions and help guide plans for housing.
Housing markets function over a spatial area that reflects the housing and location
choices of consumers. Housing demand is largely self-contained at the housing
market area level. It is the area within which most adults live and work. It is also the
area within which most households will search for housing and where a change of
residence unconnected with a change in employment or education will occur.
Housing market area boundaries are identified using Travel to Work Areas (TTWA)
and the level of self-containment an area has. As such, analysis of migration and
commuting flows is often used to determine the geographical area over which a
housing market functions and to map the boundaries across which relatively few
households change residence or commute.
However, housing market area boundaries change over time due to various factors,
including the affordability of commuting, reduced or increased travel times, and the
spatial direction influenced by land use planning. Therefore, the Housing Executive
has commissioned new research to examine the validity of the existing housing
market areas. The new housing market areas geographies are due to be published
in 2018.
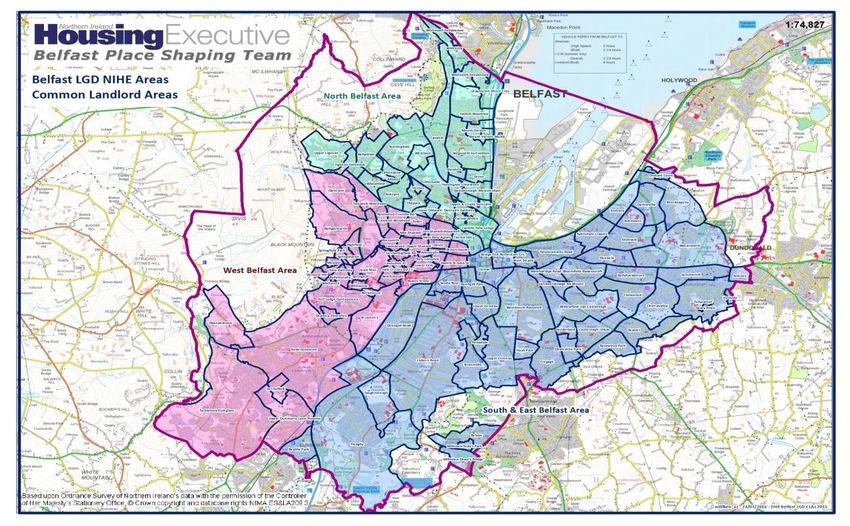
This report is based solely on the boundary of Belfast City Council, created in April
2015 following the implementation of the Review of Public Administration (RPA).
All statistics in this document refer to Belfast City Council unless otherwise stated.
7Map 1: Northern Ireland Council Areas April 2015
8DPS024
Map 2 Belfast City Council Boundary
9Policy Context
This chapter describes the strategic housing and planning policy context within
which the Belfast housing system functions. This chapter also takes account of the
budget, policy developments and the planning environment.
UK Government spending
The Autumn Statement in November 2016 confirmed that the government would
continue to deliver spending plans set at the Spending Review 2015.
The 2015 Spending Review included measures to reduce central government grant
to local authorities and change public services; including criminal justice system,
prisons, tax collection, and the delivery of welfare, to allow a reduction in the public
sector workforce. The Spending Review also planned to change state support by
moving from grant to loan funding some groups such as health students and
innovation and by asking larger employers to contribute more to the cost of
apprenticeship training.
However, since the 2016 Budget, the outlook for the public finances has
deteriorated. A weaker economy has meant less income from taxes and higher
spending by local authorities and an increased cost on welfare benefits. Given the
depreciated growth, and the period of uncertainty likely while the UK negotiates a
new relationship with the European Union (EU), the government will no longer seek
to reach an annual fiscal surplus announced by 2019.
Budget for Housing
The 2016 Autumn Statement announced the following investment in housing:
Housing Infrastructure Fund – this is a fund of £2.3 billion between 2017/18 to
2021-22, provided by the National Productivity Investment Fund (NPIF).
Investment is to be allocated to local government on a competitive basis and will
provide infrastructure targeted at unlocking private house building in the areas
where housing demand is greatest. It is intended to deliver up to 100,000 new
homes.
Affordable homes – restrictions on grant funding will be relaxed to allow
providers to deliver a mix of homes for affordable rent and low cost ownership.
The NPIF will provide an additional £1.4 billion to deliver 40,000 housing starts
by 2020-21.
Accelerated Construction – this is a pilot of housing construction on public sector
land and is backed by £2 billion of funding. In England, the government will
invest £1.7 billion by 2020-21 through the NPIF to speed up house building on
public sector land, through partnerships with private sector developers. The
10DPS024
devolved administrations will receive the remaining funding, allocated using the
Barnett formula.
Right to Buy – The government will fund a large-scale regional pilot of the Right
to Buy for housing association tenants. Over 3,000 tenants will be able to buy
their own home with increased discounts under the pilot.
The 2017 Spring Budget does not provide further detail of how the NPIF for housing
will be invested.
Following the election of a new government in June 2017, some of these plans could
be subject to change, in a new Autumn Statement and Budget. However, the
Chancellor has stated that the plans to reduce the public borrowing deficit by 2020
remain unchanged. Until the Autumn Statement in 2017, is published, the Spring
2017 Budget remains relevant. References to housing proposals contained in
Queen’s Speech include the banning of letting fees for tenants and assisting house
building by implementing a range of measures set out in the Housing White Paper
‘Fixing our broken housing market’ (DCLG, February 2017).
Northern Ireland Budget
The Northern Ireland Executive produced a one-year budget for 2016/17. As
Northern Ireland is without an Executive, a new budget has not been set for
2017/18. However, the UK’s spring budget in 2017 increased public spending for
Northern Ireland by £120m to 2020/21.
In 2016/17, the NI Executive agreed a comprehensive programme of public sector
reform, including up to £700 million of capital borrowing to fund Voluntary Exit
Schemes (VES) across the public sector. This money is to be available over 4 years
with £200 million in 2015-16, £200 million in 2016-17, £200 million in 2017-18 and
£100 million in 2018-19. This Public Sector Transformation Fund allocated £14.5m
to DfC, of which £9.1m was allocated to the Housing Executive to fund redundancies.
The 2016/17 budget for housing is mainly set out within the Department for
Communities (DfC) budget allocation. The top priority for DfC in 2016-17 has been
to deliver reform of the welfare system, incorporating an expanded range of services
while maintaining service delivery standards. Key priorities associated with
housing include:
supporting and developing vibrant communities through providing access to
decent affordable homes, and creating urban centres which are sustainable,
welcoming and accessible;
supporting Older People, those Aging, Disabled or in Poverty including Child
Poverty; and
continue to support vulnerable members of society through joined up service
delivery.
11Resource allocation for DfC in 2016/17 increased by 6.2% from the previous year,
and totaled £871.2m; of this, housing was allocated £156.4m, and communities,
cohesion and regeneration received £102.2m. Capital allocation for DfC amounted
to £159.7m, with housing receiving £107.5m and community, cohesion and
regeneration received £20.0m. DfCs key areas for capital investment in 2016/17,
which are related to housing, include:
Meeting the needs of new and existing housing tenants;
Continue to invest in seeking to address fuel poverty; and
Sustain urban regeneration investment as far as possible.
Projected expenditure on the Housing Executive and Housing Associations is to
reduce by 21% from £211.8m in 2020/21 to £165.5m in 2024/25 and, over the
same period, capital investment for this sector is to decrease by 30% from £130.1m
to £90m. It is envisaged that the Housing Executive’s programme of modernisation
and rationalisation will result in staff and running cost reductions. A review of
maintenance spending, improved asset management and increased rental income
are also to provide savings and additional revenue.
After the 2017 general election, the ‘supply and confidence’ arrangement between
the DUP and the Conservative minority government resulted in an extra £1 billion
public spending for Northern Ireland. This is to be allocated as follows:
Health: A minimum of £250m, with £200m directed to health service
transformation and £50m towards mental health provision. It will also receive
£50m to ‘address immediate pressures’;
Education: £50m to ‘address immediate pressures’;
Infrastructure: £400m for projects including delivery the York Street
Interchange, plus £150m to provide ultra-fast broadband across Northern
Ireland;
Deprivation: £100m over five years targeted toward deprived communities;
VAT and Air Passenger Duty tax: Agreed, subject to further consultation;
Corporation tax: Agreed to work towards devolving corporation tax; and
City deals and Enterprise Zones: Agreed to a set of city deals and a limited
number of Enterprise Zones.
It is clear that expenditure on public services will remain constrained across the
sector for some time, despite potential monies that may be brought forward through
arrangements between the Conservative and DUP parties. This fiscally austere
approach will continue to impact on available funding for resourcing new and
improved housing and housing services.
12DPS024
UKs relationship with the European Union
The United Kingdom (UK) government triggered the two-year process for leaving
the European Union (EU) in March 2017, meaning the UK is scheduled to leave the
EU on 29th March 2019. EU law will remain until the UK ceases to be a member,
when the EU (Withdrawal) Bill will be enacted. This Bill will copy EU laws into UK
law allowing the UK to amend or repeal these laws over time.
There is uncertainty regarding the outcome of negotiations between the UK and EU.
Decisions on remaining in the single market, and, or the customs union, the status of
EU citizens and the border between Northern Ireland and the Republic of Ireland
are key areas of debate. Without any agreements being known at the stage of
writing, it is difficult to forecast the effect leaving the EU may have.
With regard to Northern Ireland, decisions on the form of the land border between
Northern Ireland and the Republic of Ireland will affect trade and households living
and commuting across the border each day for work. The Centre for Cross Border
Studies (2016) estimates that between 23,000 and 30,000 people are cross border
workers, including workers who are neither UK nor Irish citizens. If checks are
reintroduced at the border, this could damage trade and the economy, as well as
being detrimental to workers travelling times. As the status of citizens also becomes
unclear, it may lead to people who have moved to different states, relocating back to
their home state, in order that benefits and welfare rights remain available to them.
In addition, the Centre for Cross Border Studies (2017) report Northern Ireland has
received EU funding of 7.25bn euro between 1988 and 2013, which has been
important for both the economy and the peace process. Between 2014 and 2020,
€3.5bn funding from the EU was expected; there is now uncertainty on whether and
what proportion of these funds can be drawn down.
The UK’s relationship with the EU is of significant importance throughout Northern
Ireland. EU funding has been important in supporting economic development
strategies aiming to enhance the productivity, innovation and exports of local
industry. The withdrawal of EU funding for Northern Ireland is expected to
significantly reduce services from the public and voluntary sectors.
Welfare Reform
The Welfare Reform Act 2012, introduced measures to address the rising costs of
benefits. In Northern Ireland, changes to the benefits system for working age
claimants came into effect with the introduction of The Welfare Reform Order (NI)
2015, on 10 December 2015.
The changes include a ‘phased in’ benefit cap, which sets an upper limit on the
amount of income from benefits a household can receive from November 2016. The
13benefit cap limits families to £20,000 per year and single households can receive up
to £13,400. Households whose income is in excess of these amounts will have their
housing benefit reduced to meet these limits. It is calculated the benefit cap will
affect 2,600 claimants, 600 of whom are Housing Executive tenants.
Universal Credit (UC) is a new payment that aims to support households on a low
income or out of work, and was introduced in Northern Ireland in September 2017.
This will affect working-age claimants aged 18 to 64 years old. Claims are made
online and paid twice a month to each household. If a person is renting a property,
the housing element of the Universal Credit payment will be paid to the landlord. A
certain amount can be earned before a Universal Credit payment is reduced. This is
known as Work Allowance. For any money earned over the Work Allowance,
Universal Credit will be gradually reduced.
Benefits to be replaced by UC are:
Jobseeker's Allowance (income-based)
Employment and Support Allowance (income-related)
Income Support
Child Tax Credits
Working Tax Credits
Housing Benefit (Rental)
Starting in September 2017 and ending in September 2018, UC will be introduced
on a phased geographical basis by Jobs and Benefits office / Social Security office for
all new claims, as set out below:
Table 1:1: Universal Credit Roll Out
Week commencing Office
25 September 2017 Limavady
13 November 2017 Ballymoney
11 December 2017 Magherafelt and Coleraine
15 January 2018 Strabane and Lisnagelvin
5 February 2018 Foyle and Armagh
19 February 2018 Omagh and Enniskillen
5 March 2018 Dungannon and Portadown
16 April 2018 Banbridge and Lurgan
30 April 2018 Kilkeel, Downpatrick and Newry
14 May 2018 Bangor, Newtownards and Holywood Road
28 May 2018 Knockbreda, Newtownabbey and Shankill
11 June 2018 Corporation Street, Falls and Andersonstown
25 June 2018 Shaftesbury Square, Lisburn and Larne
2 July 2018 Carrickfergus, Antrim and Ballymena
July-September 2018 Cookstown, Ballynahinch and Newcastle
14DPS024
If a claimant is in receipt any of the six benefits being replaced by Universal Credit
they will be transferred to Universal Credit between July 2019 and March 2022.
Social Sector Size Criteria (SSSC), introduced in February 2017 has changed the way
Housing Benefit is now calculated for those living in social housing. It means the
amount of Housing Benefit paid is now based on the number of people in a
household and the number of bedrooms the household needs. If found to be under-
occupying, the rent used to calculate housing benefit would reduce by:
14% if under-occupied by 1 bedroom, or
25% if under-occupied by 2 or more bedrooms
There are exemptions based on household's need for an additional bedroom, the
qualifying age for State Pension credit being reached and for some types of
accommodation. In addition, existing social housing tenants are exempt from the
impact of SSSC until 2020 under the ‘Fresh Start’ agreement 2015.
Changes to housing benefits include:
In April 2011, in Great Britain and Northern Ireland, Local Housing Allowance
(LHA) rates were changed and are now calculated on the 30th percentile of local
rents rather than the mid-point.
In April 2011, LHA rates for a five-bedroom property were removed; the
maximum LHA rate is now for a four-bedroom house.
LHA caps are now being extended to the social housing sector. This will come
into force in September 2019, for all tenancies that started in and after
September 2017.
Throughout the UK from January 2012, single people under the age of 35,
receiving Local Housing Allowance (LHA), in the private sector, have been
restricted to a rate for a single room in a shared property. This is being
introduced to the social housing sector, with changes taking effect in 2019, for
tenancies that started after 31 August 2017.
Local housing allowance rates are to be set in line with the Consumer Price Index
(CPI), instead of the Retail Price Index (RPI). CPI and RPI are both measures of
inflation; however, RPI includes housing costs and mortgage interest payments,
which CPI excludes. CPI is expected to restrict growth in benefit expenditure.
On 1 April 2016, Local Housing Allowance (LHA) rates were frozen for four
years.
There are two mitigation schemes to help those with shortfalls in benefits. A
Discretionary Housing Payment, administered by the Housing Executive, helps those
whose housing benefit does not meet rent costs. The Welfare Supplementary
Payment (WSP) scheme, administered by DfC, aims to provide assistance to those
affected by a loss of benefits, including for those who have a shortfall resulting from
the SSSC or the benefit cap. The WSP will be available until 31 March 2020.
15The Northern Ireland draft Programme for Government
The Northern Ireland Executive’s (NI Executive) published a draft Programme for
Government in November 2016. Its over-arching aim is to ‘improve wellbeing for all
by tackling disadvantage and driving economic growth.’ The draft Programme for
Government is outcomes based and proposes 14 outcomes and supporting
indicators and measures. The 14 outcomes are set out in Figure 1 below. While
housing is a cross cutting issue and can help achieve aspects in all 14 outcomes,
there are two indicators specifically relating to housing; ‘the number of households
in housing stress’ and the ‘gap between the number of houses we need, and the
number of houses we have.’
Figure 1:1: Programme for Government Outcomes
16DPS024
Key measures in relation to housing include:
a commitment to build 9,600 social homes by March 2021;
supporting 3,750 first time buyers to purchase a new home through Co -
ownership or a similar scheme and developing new affordable housing products
to help first time buyers;
helping to address the under supply of appropriate housing, such as accessible
housing for particular groups, including older people, in the private sector;
review the effectiveness of the Fuel Poverty Strategy and develop a new strategy
by March 2019;
support more shared housing and incentivise the development of more mixed
tenure, mixed use sites;
review the Housing Selection Scheme; and
develop a homelessness strategy.
Fixing Our Broken Housing Market
The UK Government published the housing White Paper ‘Fixing Our Broken Housing
Market’ in February 2017. This paper applies to England but it includes proposals
that other jurisdictions are now also considering. The Paper contains four themes:
1. Planning for the right homes in the right places;
2. Building homes faster;
3. Diversifying the market; and
4. Helping people now.
The primary objectives of the White Paper are to enable the development of more
homes and to reduce housing costs, so that more people can enter home ownership.
Key measures include:
Ensuring up to date development plans are in place;
Improve the coordination of public investment and infrastructure and to support
connections to utilities to allow developers to build more quickly;
To diversify the market by encouraging smaller builders and attract new
investors; and
Improve safeguards in the private rented sector.
The first outcome of the White Paper was the announcement in the Queen’s Speech
in June 2017, that letting agents fees would be abolished.
The Housing Strategy 2012-17
The ‘Facing the Future’ Housing Strategy was published by DSD in October 2012. An
accompanying Action Plan was published in 2013 setting out actions to deliver the
Housing Strategy, with an Action Plan update published in 2015 setting out the
17progress to date. The Strategy states that the Government has five main roles in
relation to housing:
1. Helping to create the right conditions for a stable and sustainable housing
market that supports economic growth and prosperity;
2. Providing support for individuals and families to access housing, particularly the
most vulnerable in society;
3. Setting minimum standards for the quality of new and existing homes and for
how rented housing is managed;
4. Driving regeneration within communities, particularly those suffering from
blight and population decline; and
5. Promote equality of opportunity in housing in NI and promote good relations.
To achieve the five roles above, the Housing Strategy contains actions and proposals,
including:
1. Establish a Housing Supply Forum to identify ways of increasing housing supply
with membership from Government bodies, the construction industry, financial
organisations, academics, and housing professionals.
2. Increase a range of affordable housing products to support households to move
into home ownership, including enhancing the House Sale Scheme to social
housing tenants, so they can buy their house outright or buy an equity share.
3. Introduce a developer contribution scheme when market conditions improve, to
increase the supply of social and intermediate housing.
4. Implement the Homelessness Strategy for Northern Ireland.
5. Provide smaller properties for under occupying tenants.
6. Develop an Empty Homes Strategy.
7. Develop social clauses in contracts for new social house building, to generate
employment and training opportunities.
A key aspect of the Housing Strategy is to take a housing led regeneration approach
to regenerating communities experiencing deprivation and blight by providing new
social and affordable homes. The Housing Executive actively supports regeneration
and supports the Housing Strategy’s aim of a collaborative approach across
Government to promote sustainable regeneration.
The Housing Strategy closes this year and DfC are currently in the process of
completing a final evaluation of the Housing Strategy which should be available at
the end of 2017. The next version of the Strategy is the Programme for Government
(PFG) delivery plan which is in draft until it receives Executive approval. The
proposals contained within the Housing PFG delivery plan and subsequent actions
are an attempt to learn from the experiences of delivering the Housing Strategy.
18DPS024
Supporting Strategies
The Programme for Government and the Housing Strategy identify a number of
strategies and plans, which will promote the aims, priorities and commitments of
both documents. These include a Review of Housing Fitness standards and the
Review of Houses in Multiple Occupation. DfC also published a consultation
document ‘Private Rented Sector in Northern Ireland – Proposals for Change’ in
January 2017. The key objectives of this review are to:
Assess the contribution the Private Rented Sector (PRS) currently makes and
could potentially make to increase housing supply;
Identify the key enablers to support the current and potential future role of the
PRS;
Evaluate the effectiveness of existing regulation;
Ascertain if there are any unintended consequences in the current system and
make recommendations on how these could be addressed; and
Assess the contribution the PRS makes and could make to support the NI
Executive’s Together Building a United Community Strategy, which focuses on
encouraging more shared housing.
Community Planning
The new councils received powers of wellbeing and community planning, within the
Local Government Act 2014. This stated that local government districts have
statutory duty to lead and facilitate community planning and will be required to
consult and co-operate with the community and bodies responsible for providing
public services. The legislation also established a statutory link between community
plans and development plans.
Belfast Community Plan; the Belfast Agenda
Belfast City Council and its statutory partners have been preparing a Community
Plan, the Belfast Agenda, which has a bold and ambitious vision:
“Belfast will be a city re-imagined. A great place to live for everyone. It will re-energise
and drive a successful economy where everyone can reach their potential. Beautiful
and well connected it will be a shared city and loved by all its people and admired
around the world. It will be a producer and magnet for talent, investment, innovation
and creativity, a compassionate place where people create value and are valued”.
To achieve this vision the Council and its partners will work towards these five
outcomes.
1. Everyone in Belfast benefits from a thriving and prosperous economy.
2. Belfast is a welcoming, safe, fair and inclusive city for all.
193. Everyone in Belfast fulfils their potential.
4. Everyone in Belfast experiences good health and wellbeing.
5. Belfast is a vibrant, attractive, connected and environmentally friendly city.
Housing has a key role in this process and can contribute to achieving many of these
actions. Housing can have a positive effect on health and wellbeing, regeneration
and the environment, community cohesion and neighbourhoods, combating fuel
poverty and promoting the use of renewable energy and assisting economic growth.
Planning Policy Context
The Regional Development Strategy (RDS)
The first RDS “Shaping our Future”, was issued by the Department for Regional
Development (DRD) at the end of 2001 and was reviewed in 2006 and 2010. In
March 2012, a new RDS to guide development until 2035 was published.
The RDS 2035 provides an overarching strategic framework, to help achieve a
strong spatially balanced economy, a healthy environment and an inclusive society.
The RDS also contains a commitment to sustainable development.
The Strategy contains a Spatial Framework to support balanced spatial economic
development and growth between the wider Belfast area and the rest of Northern
Ireland.
RDS Housing Requirements
The RDS’s regional objectives for housing are to:
Manage housing growth to achieve sustainable patterns of residential
development;
Support urban and rural renaissance; and
Strengthen community cohesion.
The RDS Spatial Framework aims to influence the geography of development across
Northern Ireland. The RDS, therefore, sets ‘Housing Growth Indicators’ (HGIs) to
guide distribution of housing in the region. The RDS projects housing growth
required to respond to changing housing need within all tenures.
The RDS identifies an indication of the net additional housing requirement of 94,000
dwellings between 2012 and 2025 throughout Northern Ireland. The HGIs allocate
a proportion of the regional net additional housing requirement to each LGD. These
allocations were intended to provide a starting point for assessing future net
housing additions required at the local level through the Development Plan process.
The distribution of housing growth within each council area will be decided as part
of the development plan.
20DPS024
The HGI figure for 2025 at 94,000 is significantly lower than the projected housing
growth figure calculated in 2008 at 190,000 to 2025.
RDS Housing Requirements for Belfast City Council
The RDS’s regional allocation of 94,000 dwellings is shared according to the Spatial
Framework, Belfast City Council area has an allocation of 13,700 new dwellings.
Table 1:2: Housing Growth Indicators 2012 to 2025
LGD RDS 2035
2012-2025
Number %
Belfast City Council 13,700 14.5%
Northern Ireland 94,000 100
Source: DFI (2016)
Strategic Planning Policy Statement (SPPS) and Development Plans
The implementation of the RDS is supported by SPPS, issued in 2015, and new Local
Development Plans.
The key aim of the SPPS is to further sustainable development through balancing
and integrating the three pillars of sustainable development: social, economic and
environmental considerations. The SPPS also introduces spatial planning, requiring:
‘a positive and proactive approach to planning, and a coherent long-term
policy framework to guide and influence future development across the
region. Strategic, community and land use planning matters, policies and
decisions should be considered together. This new approach to planning
extends beyond land use to integrate policies for the development and use of
land with other key policies and programmes which influence the nature of
places and how they function. It should also be visionary in setting out a
clear expression for how areas should look and function into the future.’
In relation to housing, the SPPS states Planning Authorities must deliver:
Increased housing density without town cramming;
Sustainable forms of development;
Good design; and
Balanced communities.
The SPPS is a framework for establishing the spatial distribution of housing
allocations as part of the development plan process. It also allows for supply of land
and other measures to deliver affordable housing development predicated on the
findings from Housing Needs Assessments/Housing Market Analyses prepared by
the Housing Executive.
21The Belfast City Council Local Development Plan (LDP) will replace the Belfast
Metropolitan Area Plan (BMAP 2015) in 2020. The LDP will influence housing
development in Belfast for 15 years from 2020. The plan will address land
availability for housing across Belfast. It will examine the take up of zoned land with
the correct development plans. The LDP will be the main vehicle for assessing future
housing land requirements across the council area. This is crucial given the
aspiration within the Belfast Agenda and LDGs Preferred Options Paper to increase
the population of Belfast by almost 70,000 people and develop an additional 37,000
new homes in the period to 2035.
Conclusion
Currently the policy context for the UK, Northern Ireland and Belfast is fluid, making
long-term predictions difficult. There is ongoing uncertainty regarding UK and
Northern Ireland budgets, prior to the 2017 Autumn Statement and in the absence
of a functioning Northern Ireland Assembly. In addition, the consequences for
households and housing due to changes in welfare reform, may only be partially
known, while mitigation payments are being provided. This means that we may not
know the full extent of housing need until 2020, when supplementary payments are
due to cease. The full effect of the UK leaving the EU, may only emerge over several
years, with decisions on the economy, the NI/ROI border and the status of EU
nationals still to be negotiated and agreed. Undoubtedly, this will have a significant
effect on the future development of Belfast.
As the future policy context is changeable, any predictions and forecasts should be
viewed with caution. In this unstable policy environment, monitoring effects over
time will be of crucial importance.
22DPS024
Northern Ireland Housing Market
This chapter considers long term tenure changes and the performance of the
Northern Ireland Housing Market as a whole, with some emphasis on important
variations with Belfast. This mainly focuses on the owner occupied housing market.
The Belfast housing market performance across all tenures is discussed in more
detail in Section 3.
Tenure
There have been substantial changes to the tenure profile of the housing market in
Northern Ireland in the period since 1991. There is a higher level of owner
occupation in Northern Ireland compared to Belfast and a correponding lower level
of social housing, reflecting the large scale slum clearance and redevelopment
programmes in Belfast during the 1970s and 1980s. In the 20 years between 1991
and 2011, the census recorded a significant increase in the proportion of Private
Rented Sector (PRS) properties in both Northern Ireland and Belfast, resulting in a
falling percentage share for social housing. This reflects in part the effect of the
Right to Buy policy in the social housing sector.
Table 1:3 Tenure Breakdown Belfast and Northern Ireland 1991-2011
Tenure Owner Social Rental Private Rental Other *
Occupation
N. Belfast N. Belfast N. Belfast N. Belfast
Ireland Ireland Ireland Ireland
CENSUS
1991 63% 53% 31% 38% 6% 8% n/a 1%
2001 70% 57% 21% 32% 7% 10% 2% 2%
2011 68% 52% 15% 25% 15% 20% 2% 2%
Source: NISRA*Mostly other rental, including rent free and University halls of residence.
Preliminary findings from the Northern Ireland House Condition Survey 2016
indicate that expansion of the PRS has continued since 2011, but at a lower rate than
the five years to 2011. By 2016, there were an estimated 128,100 dwellings in the
sector, 17.3% of the total housing stock. This survey also stated that 43% of
households aged between 25-34 are housed within the PRS compared to 14% in
2004/5. Over the same period, the percentage of this group buying with a mortgage,
decreased from 66% to 40%. The PRS has grown mainly due to affordablility
problems in accessing the owner occupied market.
23Chart 1:1: Tenure Breakdown NI 2015/16
Tenure Breakdown 2015-16
4% 13%
Owner Occupied
Private Rented Sector
17%
Housing Associations
67% Housing Executive
Source: DfC
However, as affordability problems have eased, there has been a recent increase in
first time buyers entering the owner occupied market. This, and the increasing cost
for landlords due to stamp duty and other tax changes, may see the rate of PRS
growth decrease, or at least stabilise in future years.
Affordability and House Prices
In 2016, the Council of Mortgage Lenders (CML) described the Northern Ireland
property market as the ‘definitive example of boom-and-bust’ in the UK. However,
continued low interest rate environment, more readily available mortgage finance
and stronger affordability levels compared to the rest of the UK, mean that
consumer confidence in the mortgage environment appears to be rising.
Statistics from Land and Property Services (LPS) show steep house price falls, year
on year, from 2007 to 2013. A standardised price of £224,670 at the height of the
market, in Quarter 3 (Q3) of 2007 decreased by 57% to £97,428 at the lowest point,
Q1 of 2013. Since this low point in 2013, house prices have been rising steadily,
albeit at a fairly low rate, with average house prices now 27% higher. See Chart 1:2
24DPS024
Chart 1:2: NI Average House Prices 2008-2017
NI Average House Prices for Quarter 1 2008-
2017
250,000
198,362
200,000
150,000 124,007
(£)
Price (£)
100,000
97,428
50,000
0
2008 2009 2010 2011 2012 2013 2014 2015 2016 2017
Source: LPS https://www.finance-ni.gov.uk/articles/northern-ireland-house-price-index
The average house price for Northern Ireland is £124,007 for Quarter 1 (Q1) of 2017.
This is an increase of 4.3% over a 12 month period. Prices for apartments are the
only prices to have declined over the last year, with terraces showing the highest rate
of increases. This could be due to increased first time buyer activity, as terraces have
the lowest average prices of all house types. This is illustrated in Table 1:4
Table 1:4: Northern Ireland House Price by Property Type
Property Type Percentage Change Percentage Change Standardised Price
on Previous over 12 months (Quarter 4 2016)
Quarter
Detached 0.6% 3.6% £186,905
Semi-Detached 0.% 5.9% £121,098
Terrace -0.7% 4.8% £85,713
Apartment -4.5% -0.4% £97,242
All 0.8% 4.3% £124,007
Source: LPS https://www.finance-ni.gov.uk/articles/northern-ireland-house-price-index
25House prices in Belfast have been relatively stable since 2014. The CML described in
its April 2017 market commentary that “the market is on a fairly even keel and in a
neutral gear”. South Belfast is the highest priced sub market in the city, followed by
East, West and North Belfast.
NISRA report that median house prices, against median gross earnings show a ratio
of 4.7% in 2016. This has risen each year since 2012, after falling steeply from a
ratio of 9.1% in 2007, when there were a high levels of affordability problems across
Northern Ireland. This indicates improved affordablilty since the height of the
market. Currently, as the average house price in Northern Ireland is significantly
lower than the UK average, the loan to income ratio is the lowest of the UK regions.
This means monthly repayments are generally more affordable for borrowers in
Northern Ireland, than counterparts in GB.
On average, first time buyers loan to value ratio was 86%, meaning an average
deposit of approximately 14% was needed for those entering the owner occupied
market for the first time. Loan to value ratios averaged at 89% for first time buyers
in 2005, meaning that raising a deposit was slightly easier or more affordable at this
time.
During the recession, as the housing market and economy weakened, affordabilty
issues and difficulties in making repayments led to a rise mortage default cases, as
demonstrated in the chart below.
Chart 1:3: NI Mortgage Default Cases 2007-2016
NI Mortgage Default Cases Received 2007-16
4,500
4,000 3,906
3,732
3,500
3,000 3,390
2,500
2,000 2,212 Cases received
1,500
1,232
1,000
1,105
500
0
2007 2008 2009 2010 2011 2012 2013 2014 2015 2016
Source: The Department of Justice, 2017
These cases relate to properties or land owned at least in part with a mortgage,
where the owner has defaulted on their mortgage payments and the lender has
26DPS024
initiated legal proceedings for an order of possession of the property. Not all of
cases lead to eviction or re/possession, as the parties can still negotiate a
compromise.
The Department of Justice states the main reasons for housing debt are:
Change in circumstances, i.e. job loss, reduction in working hours, sickness or
relationship breakdown;
Accessing high cost credit/mortgages from non-traditional lenders and securing
it on their homes; and
Over borrowing during the property boom.
The housing market has improved since 2013, the number of mortage default cases
has fallen significantly. The Department of Justice records that 322 such cases were
received Royal Courts of Justice in Belfast, during Quarter 1 of 2017 (January to
March). This represents a 13% decrease of cases received from the same period in
2016 (371), and is the lowest volume of cases received during the January to March
quarter since the records began in 2007.
While afforability has improved, issues remain. CML reports that negative equity has
been the biggest problem in the Northern Ireland housing market since the
recession. The property debt company, Negative Equity NI, reported that more than
60,000 homes were in negative equity in 2015. The mean average debt held by
homeowners in Northern Ireland, in 2014 was £35,162, twice the UK average. It has
also been confirmed by the Financial Services Authority that at the height of the
recession, many of those who had taken out mortgages since 2005 were ‘mortgage
prisoners’, unable to restructure their debt or to move to lower interest rate deals.
Increasing house prices may have eased the pressures of negative equity for a
limited number of households, however given the high cost of housing and the level
of lending at the height of the market negative equity continues to be a significant
drag on the housing system and the ‘second steppers’ seeking to move to a bigger
property. Of great concern to these home owners is rising inflation and the warning
of interest rate rises by the Governor of the Bank of England. This will need to be
managed with extreme care to ensure the housing system is not further and
seriously impaired.
The future short term prospects for house prices are also unclear. While Ulster
University’s Economic Policy Centre expects house prices to rise by 3% in 2017 and
2% in 2018, this contrasts with the view from PWC. In July 2017, PWC has stated
that due to a slow recovery of wages and disposable income in Northern Ireland,
house prices are expected to slow, with rises of 1% in 2017 and will not rise in 2018.
Both these predictions are lower than the 4.3% rise from Q1 2016 to Q1 2017,
inidcating a potential slow down in the housing market. In UK terms, two of the
largest mortgage lenders, Halifax and Nationwide have recently reported that
27annual price growth had slowed to between 2 and 3% and is expected to remain
low.
It is also important to note, that affordability is not simply reflected in house prices,
as there is a range of housing costs, including the cost of borrowing, council rate
levels, adaptability and energy costs.
Ulster University House Price Index
Ulster University produces a Quarterly House Price Index for Northern Ireland. This
index uses sub regional geographies, which are not necessarily coterminous with
the new Council boundaries or the Housing Executive’s Housing Market Areas.
However, the Ulster University’s Belfast region does align fairly closely with the
Belfast City Council area and also analyses price movements in the four individual
sectors (North, South, East and West) of the city.
Repayment affordability highlights the level of unaffordable stock, based on
dwellings sold. The latest available Ulster University Affordability Index (2016), see
Table 1:5, shows repayment affordability and includes an ‘affordability gap’. The
affordability gap is the difference between lower quartile house prices, and the
maximum a median income household can borrow. A positive affordability gap
indicates a surplus between the borrowing capacities of households, against lower
quartile house prices. Therefore, houses are more affordable in areas with a high
affordability gap.
The Ulster University’s Affordability Index calculated that affordability improved
across all regions of Northern Ireland in 2016, with the exception of Mid Ulster
council area. Belfast is the least affordable region in Northern Ireland, with only
25% of properties sold considered being affordable for those on median incomes,
and the council area had a negative affordability gap of £601 in 2016. The
percentage of properties considered unaffordable over the last five years has
remained fairly stable at around 70- 75%. Both house prices and the percentage of
unaffordable properties have decreased slightly in the past 12 months in Belfast.
28DPS024
Table 1:5: Repayment Affordability
2012 2013 2014 2015 2016
Aff % Aff % Aff % Aff % Aff %
Gap(£) Unaff Gap(£) Unaff Gap(£) Unaff Gap(£) Unaff Gap(£) Unaff
North Down &
29,821 58% 42,860 46% 37,717 52% 34,411 51% 38,620 49%
Ards
Armagh &
19,739 58% 17,358 55% 18,657 57% 3,812 73% 4,909 71%
Craigavon
Antrim &
18,277 66% 14,633 63% 15,706 59% 14,425 63% 21,329 58%
Newtownabbey
Belfast 3,820 73% 7,817 68% 7,400 67% -4,012 77% -601 75%
Carrickfergus &
63,691 25% 71,181 27% 67,140 25% 63,848 33% 82,935 23%
Larne
Derry, Strabane
5,832 68% 20,281 60% 15,524 68% 24,661 52% 23,385 50%
& Limavady
Fermanagh &
50,949 27% 39,538 38% 36,342 38% 37,309 52% 41,927 43%
Omagh
Newry, Down &
16,408 63% 19,356 59% 18,370 62% 10,437 71% 16,860 66%
Banbridge
Lisburn &
8,920 69% 13,351 66% 18,321 63% 8,937 69% 28,470 58%
Castlereagh
Magherafelt,
Cookstown & 19,461 58% 30,038 45% 30,867 45% 23,059 55% 16,552 58%
Dungannon
Moyle,
Ballymena,
21,199 57% 23,538 51% 24,467 53% 18,084 60% 21,427 54%
Ballymoney &
Coleraine
Source: University of Ulster, 2017
The deposit gap, see Table 1:6 below, looks at the ability to access the housing
market in terms of the required deposit, or the Loan to Value ratio. This index
assumes a household’s ability to save 30% of its annual disposable income, and
estimates a ‘savings ratio’; the number of years it would take households to save for
a deposit. As house prices have increased, the percentage of an income needed and
the number of months needed to save for a deposit have increased. Increasing
inflation rates, also mean household’s disposable incomes have decreased. Similar
to affordable properties, Belfast is the least affordable region in Northern Ireland in
terms of the deposit gap. This measure illustrates continuing challenges for
prospective homebuyers wishing to access owner occupation in Belfast.
29Table 1:6: Loan to Value Affordability
2012 2013 2014 2015 2016
Income Savings Income Savings Income Saving Income Saving Income Saving
% Ratio % Ratio % s Ratio % s Ratio % s Ratio
North Down &
37.86 1.26 33.1 1.1 35.63 1.19 36.01 1.20 38.76 1.29
Ards
Armagh &
37.23 1.24 38.92 1.3 38.57 1.29 46.37 1.55 49.42 1.65
Craigavon
Antrim &
39.73 1.32 41.83 1.39 41.59 1.39 41.54 1.38 42.03 1.40
Newtownabbey
Belfast 46.95 1.57 44.41 1.48 44.87 1.5 50.91 1.70 52.48 1.75
Carrickfergus &
24.55 0.82 22.16 0.74 24.71 0.82 25.87 0.86 23.30 0.78
Larne
Derry, Strabane
45.81 1.53 36.98 1.23 40.28 1.34 34.47 1.15 39.08 1.30
& Limavady
Fermanagh &
25.34 0.84 31.12 1.04 33.26 1.11 32.50 1.08 34.49 1.15
Omagh
Newry, Down &
41.14 1.37 39.84 1.33 40.69 1.36 43.71 1.46 44.52 1.49
Banbridge
Lisburn &
45.83 1.53 44.12 1.47 42.41 1.41 45.20 1.51 41.78 1.39
Castlereagh
Magherafelt,
Cookstown & 40.26 1.34 35.53 1.18 35.7 1.19 38.61 1.29 45.17 1.51
Dungannon
Moyle,
Ballymena,
39.44 1.31 38.55 1.28 38.56 1.29 40.75 1.36 43.11 1.44
Ballymoney &
Coleraine
Source: University of Ulster, 2017
The University of Ulster combines these two aspects of affordability into a single
relative measure called a Multiplier Weighting Ratio. The higher the ratio, the
greater the affordability problem is in the area. Based on the Multiplier Weighting
Ratio, Belfast again comes out as the least affordable region in Northern Ireland (See
Table 1:7).
30DPS024
Table 1:7: Multiplier Weighting Ratio
Multiplier Multiplier Multiplier Multiplier Variation
weighting weighting weighting weighting 2015 -
ratio ratio ratio ratio 2016
2013 2014 2015 2016
North Down & Ards 0.508 0.438 0.612 0.633 -0.021
Armagh & Craigavon 0.714 0.443 1.128 1.170 -0.042
Antrim & Newtownabbey 0.878 0.426 0.872 0.813 0.059
Belfast 1.007 0.448 1.307 1.312 -0.005
Carrickfergus & Larne 0.199 0.303 0.285 0.179 0.106
Derry, Strabane & Limavady 0.74 0.506 0.597 0.651 -0.054
Fermanagh & Omagh 0.394 0.343 0.563 0.494 0.069
Newry, Down & Banbridge 0.784 0.457 1.034 0.980 0.054
Lisburn & Castlereagh 0.971 0.446 1.040 0.808 0.232
Magherafelt, Cookstown &
0.533 0.378 0.708 0.873 -0.165
Dungannon
Moyle,
Ballymena, Ballymoney & 0.655 0.412 0.815 0.776 0.039
Coleraine
Source: University of Ulster, 2017
Transactions
Transactions also demonstrate an improving housing market. Between 2008 and
2011, the annual number of sales was approximately 11,000 each year, however,
since 2012-16, the number of transactions has increased each year, with 22,713
sales occuring during 2016, a change of 106%. Borrowing by first time buyers and
home owners trading up has increased significantly since 2012.
In 2016, CML reported that the recovery in transactions was driven by an increase
in the first time buyer activity. CML reported a high of 9,700 first time buyers in
2005, with numbers dropping significantly to 2,900 in 2008. However, since the
recovery in the housing market there has been an increase in first time buyers to
8,000 in 2016, an increase of 7% since 2015.
New Build
Private sector house building has been increasing since 2013, demonstrating
improved confidence in the housing market from private developers. However,
while starts are increasing, they are still well below 2005 figures and are not
reaching the requirement for new units, as set out in Housing Growth Indicators
(HGI). Building work started on more than 1,800 new homes in Northern Ireland in
the first quarter of 2017. That is up 16% on the same period last year. New build
starts in Belfast have also increased in the past 3 years. New Purpose Built Student
31Housing (PBSA) referred to in pp 56-58 of this report do not form part of the
statistics in Table 1:8 below.
Table 1:8: New Build Starts all sectors
Year All N. Ireland Belfast
2014/15 5,990 410
2015/16 6,713 565
2016/17 7,724 726
Source:DfC
Across Northern Ireland, completions have been at a lower level than the HGIs. New
build completions are at 64% of HGIs, with 23,102 units built over a five year period
(2012/13-2016/17). This means, to reach HGIs by 2025, an additional 8,863 homes
need to be constructed each year.
Chart 1:4: New Private Sector Starts 2005-2016
New Private Sector Residential Development Starts 2005-2016
16000
14391
14000
12000
10000
8000 7101
6435 Starts
6000 6497
4140
4000
2000
0
2005 2006 2007 2008 2009 2010 2011 2012 2013 2014 2015 2016
Source: https://www.finance-ni.gov.uk/publications/new-dwelling-statistics-report
Residential planning applications, while falling significantly from a high of 24,749, in
2005/6 have dropped to 7,795 in 2016/17. However, this is an 8% increase from
7,192 applications received in 2015/16. Excluding applications for domestic
alterations and extensions, there were 4,941 planning applications in the last
financial year, an increase of 16% from 2015/16. This indicates increased
opportunity for new housing units, within the next five years.
32DPS024
Conclusion
While the housing market has slowly improved over the last four years, structural
issues remain that could adversely affect the economy and household finances in the
near future. These include the rate of new build continuing to fall well short of
meeting DFI’s housing growth indicators; which could lead to house price inflation.
There are also continuing high levels of negative equity. While rising house prices
mean that more homeowners are slowly coming out of negative equity, higher levels
of inflation and a consequent rise of interest rates could lead to higher housing costs
and rising rates of repossessions.
Commentators are forecasting a slowdown in house price growth or stagnation
within the Northern Ireland housing market over the next two years, and longer
term forecasts for the UK housing market have also been cautious due to economic
uncertainty following the EU referendum. It will be important to monitor trends
and developments across the housing sector in the next few years.
33Section 2:
Housing Market Drivers
34DPS024
Economy
The housing sector both influences and is influenced by economic performance.
Whilst we have witnessed the dangers of an economy that is over dependent on the
housing market during the noughties, the United Nations New Urban Agenda notes
the importance of the contribution of housing in economic development and in
stimulating productivity. Housing enhances capital formation, income, employment
generation and savings. In turn, economic conditions are a key driver within the
housing market, affecting the rate of household formation, people’s incomes,
employment and access to finance, therefore determining their housing choices.
The economy can also influence the availability of land for development and the cost
of loans to invest in new building.
International and UK Economy
In June 2017, the World Bank estimated that global economic growth will
strengthen to 2.7% in 2017 and 2.9% in 2018/19. The Emerging Market and
Developing Countries (EMDC) will account for more than 75% of global growth.
Growth in the Euro Zone is predicted to grow by 1.7% in 2017, followed by 1.5% in
2018 and 2019; this is similar to the rate of growth in the UK.
In the March 2017 Budget, the Office of Budget Responsibility (OBR) forecast the UK
economy to grow by 2% in 2017. The growth rate in the medium term is now
predicted to be at a lower rate than originally estimated. Growth in 2018 is
predicted to be at 1.6%, with 2019, at 1.7%, 1.9% growth in 2020, returning to 2%
growth in 2021.
Sterling depreciation following the EU referendum, has led to an increased inflation
rate of 2.6% in July 2017, higher than the 2.4% predicted for the year, and the Bank
of England target of 2%. This is the highest level of inflation since June 2013.
Inflation puts pressure on household finances and leads to slower consumer
spending and subdued private investment. Danske Bank reports that in Northern
Ireland, inflation has led to a fall in household confidence over the last 12 months.
Critically the Bank of England gave its strongest hint in September 2017 that an
interest rate rise is imminent. The impact of any interest rise on the Northern
Ireland housing market will need to be closely monitored given the proportionately
high level of negative equity and the potentially detrimental effect on an already
imbalanced housing system.
Northern Ireland Economy
In Q1 of 2017, Danske Bank’s Quarterly Sectoral Forecasts report predicts that the
Northern Ireland economy will grow by 0.8% in 2017 and 1.0% in 2018. The rate of
growth expected in the short - medium term is below the 2016 level of 1.6%, which was
the strongest rate of growth since 2007.
35You can also read