Chile's Third National Communication on Climate Change to the United Nations Framework Convention on Climate Change - mary 2 e S
←
→
Page content transcription
If your browser does not render page correctly, please read the page content below
2016
                     mary
                  Sum
           cutive
        Exe

              Chile’s Third National Communication
on Climate Change to the United Nations Framework
                     Convention on Climate Change

                                     www.theGEF.org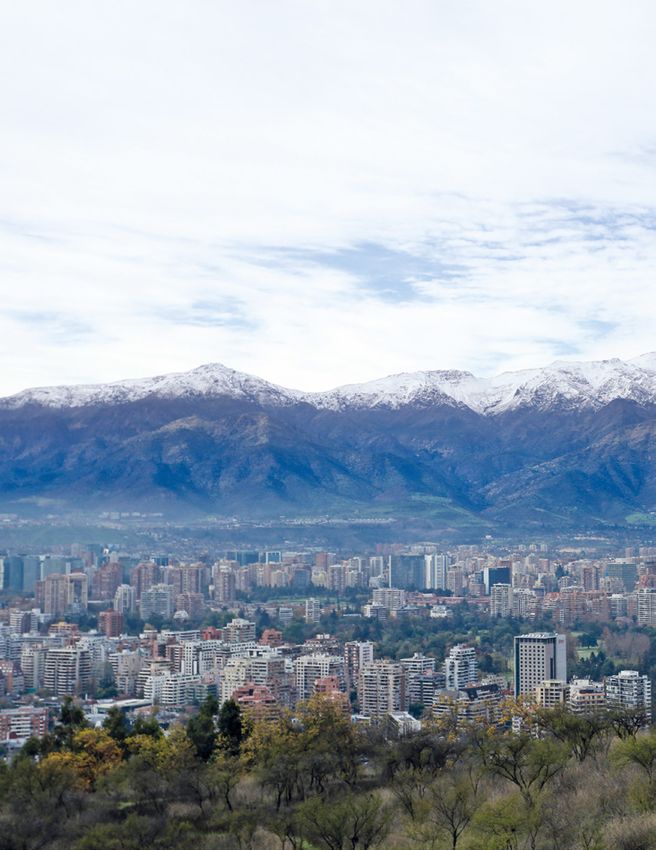
Chile’s Third National Communication
on Climate Change to the United Nations Framework
          Convention on Climate Change
               Executive Summary 2016

                              www.theGEF.org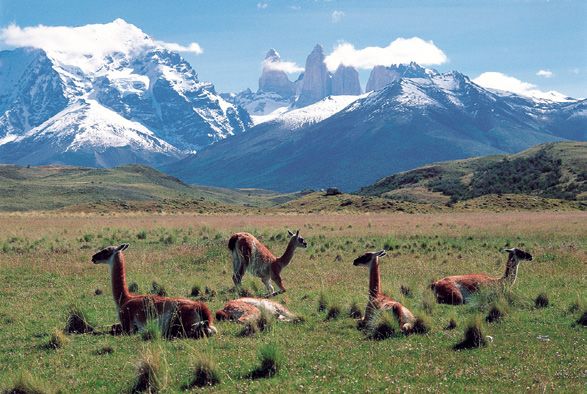
www.theGEF.org

                                                       Chile’s Third National Communication on Climate Change
                                                                                                                                                         6
                                                                                                                                                 ry   201
                                                                                                                                               ma
                                                                                                                                            Sum
                                                                                                                                         ve
                         sobre Cambio Climático
                                                                                                                                     cuti
                                                                                                                                  Exe
ante la Convención Marco de las Naciones Unidas
          Tercera Comunicación Nacional de Chile

                                                       Tercera Comunicación Nacional de Chile sobre Cambio Climático

                                                                                                                                       Chile’s Third National Communication
                                                                                                                         on Climate Change to the United Nations Framework
                              Res
                                 um
                                                                                                                                              Convention on Climate Change
                                   en
                                      Ejec
                                          utiv
                       201                    o
                          6

                                                                                                                                                              www.theGEF.org

                                                                                                                        Executive Summary
    Chile’s Third National Communication On Climate Change
           To the United Nations Framework Convention on Climate Change
                                                                                           Project Implementation:
                                            Ministry of Environment (2011-2016)
                                                  General Coordinators of the Projects:
                                                    Fernando Farías (2013-2016)
                                                    Andrea Rudnick (2011-2013)
                                                                                                                       Technical Coordinator:
                                                                                                                        Maritza Jadrijevic
                                                                                                                       Executive Coordinators:
                                                  Johanna Arriagada (2015-2016)
                                                    Angela Reinoso (2013-2015)
                                                                                                                       Chapter Coordinators:
      Peter Muck, Sergio González, Paulo Cornejo, Jenny Mager,
              Maritza Jadrijevic, Johanna Arriagada,
                    Gladys Santis y Felipe Osses
                                                                                                                              Proofreading:
                                                   Pilar de Aguirre, Andrea Palet
                                                                                                                        Design and layaout:
                                                                                                                            Duplika Ltda.
                                                                Printed in Maval Ltda.
                                                                                                                                          ISBN:
                                                                                                                        978-956-7204-56-4
                          “Regarding maps they should be taken only referentially”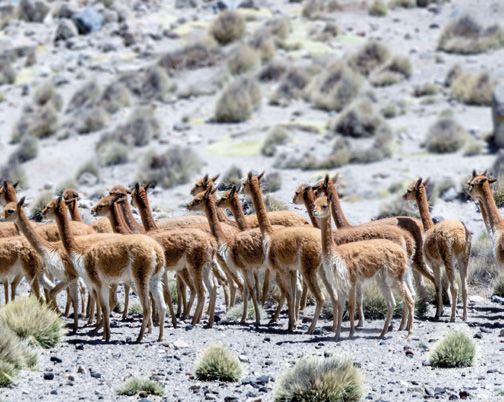
Executive Summary

Index

PROLOGUE                                                                                                            5
EXECUTIVE SUMMARY                                                                                                   7

1   NATIONAL CIRCUMSTANCES
    1.1. Geographic Profile and Social Development
    1.2. Economic Profile
                                                                                                                    8
                                                                                                                    8
                                                                                                                    8
    1.3. National Institutional Framework related to climate change                                                12

2   CHILE’S NATIONAL INVENTORY OF GREENHOUSE GASES, SERIES 1990-2013
    2.1. Introduction
    2.2. Institutional arrangements and preparation of Chile’s NGHGI
                                                                                                                   16
                                                                                                                   16
                                                                                                                   16
    2.3. Trends in Chile’s greenhouse gas emissions                                                                17

3   VULNERABILITY AND ADAPTATION TO CLIMATE CHANGE OF THE COUNTRY
    3.1. General background and national policies
    3.2. Climate change trends observed and national projections
                                                                                                                   20
                                                                                                                   20
                                                                                                                   20
    3.3. Sectors vulnerable to climate change                                                                      23
    3.4. Climate Change Adaptation                                                                                 32

4   MITIGATION OF GREENHOUSE GASES EMISSION
    4.1. Mitigation in Chile
    4.2. Sectorial mitigation actions
                                                                                                                   35
                                                                                                                   35
                                                                                                                   37
    4.3. Other mitigation actions                                                                                  42
    4.4. Chile’s Nationally Appropriate Mitigation Actions (NAMA)                                                  42
    4.5. Measurement, report and verification of mitigation actions                                                44
    4.6. Cross supporting actions for a low carbon economy                                                         44

5   OTHER SIGNIFICANT INFORMATION TO ACHIEVE THE CONVENTION’S OBJECTIVE
    5.1. Technological transfer on climate change
    5.2. Systematic Observation of climate variability and climate change
                                                                                                                   45
                                                                                                                   45
                                                                                                                   47
    5.3. Climate change research programs                                                                          48
    5.4. Education, formation and public sensitization on climate change                                           51
    5.5. Encouragement of national and local capacities on climate change                                          53
    5.6. Inclusion of climate change in other management instruments                                               53

6   NEEDS AND SUPPORT RECEIVED REGARDING CLIMATE CHANGE
    6.1. Financing needs, gaps and barriers, capacity building and technical assistance
    6.2. International support to climate action
                                                                                                                   54
                                                                                                                   54
                                                                                                                   55
    6.3. National support for climate action                                                                       57
BIBLIOGRAPHY                                                                                                       58

                               Chile’s Third National Communication on Climate Change - Ministerio del Medio Ambiente   3
Santiago, Archivo MMA.
Executive Summary

Preface

The term between 2011 and 2016 covered by this
Third National Communication on Climate Change,
by which the Chilean Government presents to the
United Nations and to the world its performance
regarding this matter has been particularly fruitful
in terms of progress in our country.

We already have climate change adaptation
plans in different areas of our economy which
are being implemented, as well as a national
adaptation plan to climate change which reflects
the country’s general guidelines to be followed in
terms of adaptation. The fact of Chile having this
set of plans has allowed the different ministries
organizing to work systematically and jointly to improve the country’s climate adaptation. Currently Chile has
also a Forestry Policy 2015-2035 and a new Energy Policy (Energy 2050), both published this year in which
climate change is a part of their design: through both policies we shall have powerful elements to move
on in these sectors, with a greater incidence on our current inventory of greenhouse gases emissions and
removals, in an attempt to design and implement effective mitigation options and encouraging a gradual
transition towards an economy significantly lower in carbon by 2050. The detail of all these elements and
their consequences is contained in this document and proves the importance given by our country to jointly
face the challenges imposed by climate change. Our goal is that Chile has “climatechanged” sectorial public
policies, permanently integrating the climate agenda within the ministries’ actions.

Also, during this term and under the recent Paris Agreement, our country was able to coordinate the
preparation and approval at the highest ministry level of its Intended Nationally Determined Contribution
which explains the country’s purposes and tasks in terms of mitigation, adaptation, climate capacity building,
technology and climate financing. Agreeing to the preparation of this document meant being able to discuss
a new relation framework for climate change actions inside our country, as well as Chile’s participation in a
joint work with the rest of the countries adhering to this worldwide agreement.

Although we have made progresses in the climate action area for our country, climate variations have also
been noted even strongly during this term, making it evident for Chile, its Government and its people that
climate change arrived to stay within our borders, and that it is urgent to take care of its effects on our
geography and economy. Consequently, we believe that an effective climate action shall be permanent, as
well as the messages we convey to citizens. Climate change is a common issue, but it may also be a common
opportunity for our countries.

                               Chile’s Third National Communication on Climate Change - Ministerio del Medio Ambiente   5
Executive Summary

With financial support granted by the Global Environment Facility (GEF) and the permanent collaboration
by the United Nations Development Program (UNDP), the Climate Change Department of the Ministry of the
Environment was able to coordinate the preparation of this compilation document. Its contents explain
and value the significant work performed by professionals of different ministries, scientific, technical and
social entities of the country towards a common purpose of revealing our climate information. We convey
to all of them our sincere gratefulness for their valuable contributions.

There is a long way to go in our country’s road to sustainability. The year 2016 finds us on that road. We
have it clear that even if the challenge is huge, the opportunity is even greater to leave a better Chile
for the future generations.

                                                Pablo Badenier Martínez
                                            Minister of the Environment of Chile
                                             Santiago, Chile, November, 2016.

6   Chile’s Third National Communication on Climate Change - Ministerio del Medio Ambiente
Executive Summary

Executive Summary

Chile’s Third Communication was prepared according to the requirements of the United Nations Framework
Convention on Climate Change (UNFCCC). It contains Chile’s progress in the implementation of the Convention
goals and principles, mainly during the term 2010 to 2016, taking into account that the country presented its
First Communication in 2000 and the Second in 2011. In accordance to the guidelines recommended by the
Convention for the preparation of this type of documents, we present the national circumstances (chapter 1);
results of the national inventory of greenhouse gases emissions and removals (chapter 2); main progress in the
country’s vulnerability and adaptation to climate change (chapter 3); mitigation of greenhouse gases (chapter
4), any other information relevant to the achievement of the Convention’s Objective (chapter 5) and finally, we
describe some obstacles, gaps as well as financial, technical and capability needs identified for the country
during the process of preparation of this communication (chapter 6).

To prepare this communication we relied on the main financial support by the Global Environment Facility, which
was implemented through the office of the United Nations Development Program and the Chilean Government.

                                                                                                                        PN Torres del Paine, CONAF.

                               Chile’s Third National Communication on Climate Change - Ministerio del Medio Ambiente   7
Executive Summary
1 National Circumstances
1.1. Geographic Profile and Social Development
Chile is a tri-continental country which territory extends along the southwest portion of South America,
including Easter Island in Oceania as well as part of Antarctica to the south. The national territory also
includes the Archipelago of Juan Fernandez, the islands of San Felix, San Ambrosio, Salas y Gomez, as well
as the 200-mile Exclusive Economic Zone (EEZ) with its corresponding continental shelf. Chile limits to the
north with Peru, to the east with Bolivia and Argentina, to the south with the South Pole and to the west
with the Pacific Ocean that laps its coast in an extent greater than 8,000 km.
Chile has a total area of 2,006,096 km2, without considering the maritime territory ( territorial sea, EEZ
and continental shelf), which is distributed in 755,915 km2 corresponding to South America, 1,250,000 km2
to Antarctica and 181 km2 to Oceania.
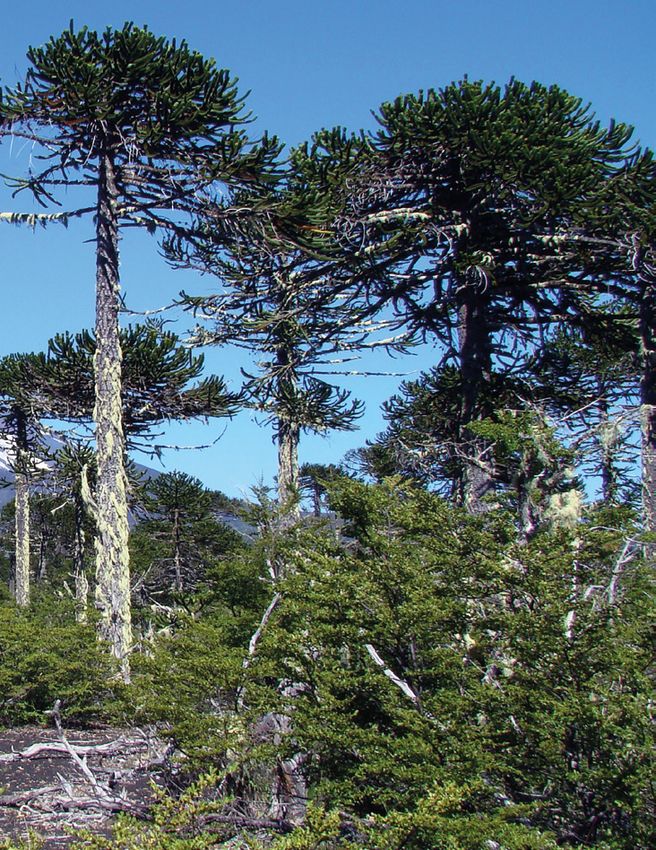
Chile has a multiplicity of climates mainly caused by its latitude and height, which originate four macro
bioclimates: tropical, Mediterranean, temperate and antiboreal (Figure 1), with 127 terrestrial ecosystems
distributed among them and 96 marine ecosystems along the Chilean coast.
Chile is a unitary republic which political-administrative framework is structured in three territorial levels
of governance: administrative regions (15), provinces (54) and municipalities (346), with a total population
(2002 census) of 15,668,271 individuals and an estimated population for 2020 of 18,896,684 individuals. The
population is not evenly distributed in the national territory, but it is strongly concentrated in the central
zone, in the Metropolitan Region of Santiago.
Nine indigenous ethnic groups are acknowledged in Chile, mostly mapuche (84%), representing
approximately 8.7% of total population
1.2. Economic Profile
Chile support an open-market economy to a large extent, the country’s economic growth is ruled by the mining
activity, with exports in 2014 corresponding to 54.2% of the total exported by the country (DIRECON, 2015).
During the last twenty years Chile has experienced a fast economic growth, led by commodities exports. The
GDP has tripled between 1990 and 2015, and its annual inflation rate is lower than 5% (Figure 2). Although the
Chilean economy is based on the extraction of natural resources and primary goods, the addition of financial
and personal services represents the GDP highest percentage (37.7%), followed by the manufacturing and
mining industries (in total, 33.1%).
8 Chile’s Third National Communication on Climate Change - Ministerio del Medio Ambiente
Executive Summary

Table 1 summarizes the main geographic and social economic indicators in Chile.

Figure 1: Macro bioclimates of Chile

                                                          800o'0''W                               700o'0''W

                                                                                                              N
                                       Chile's bioclimate

                                                                                                                   200o'0''S
                       200o'0''S

                                           Tropical
                                           Desert Tropical
                                           Xeric Tropical
                                           Pluviseason Tropical
                                           Hyper-desert Mediterranean
                                           Desert-oceanic Mediterranean
                                           Xeric-oceanic Mediterranean
                                           Pluviseason-oceanic Mediterranean
                                           Mild xeric
                     300o'0''S

                                                                                                                   300o'0''S
                                           Mild oceanic
                                           Mild Hyper-oceanic
                                           Antiboreal Hyper-oceanic

                                                                                                                   400o'0''S
                     400o'0''S
                     500o'0''S

                                                                                                                   500o'0''S

                                                                                 Km
                                   0                 500                     1.000
                                        *�1998 agreement�
                                                                 800o'0''W                        700o'0''W

Source: Luebert and Pliscoff (2006), ( maritime boundaries, according to DIFROL)

                                                  Chile’s Third National Communication on Climate Change - Ministerio del Medio Ambiente   9
Executive Summary
Table 1: Summary of Chile’s main geographic and social economic indicators
Information Source
Geography and population
Area:
Total area 2,006,096 km2
Military Geographical Institute
South America area 755,915 km2
(IGM)
Oceania area (Easter Island) 181 km2
Use of land:
Agricultural use areas 4.4%
Native Forests 18.9%
National Forestry Corporation
Forestry Plantations and mixed forests 4.2%
(CONAF) 1
Grassland and Scrub 27.1%
Urban and industrial areas 0.5%
Areas without vegetation 32.5%
Protected marine areas 45,111.4 thousand ha Ministry of the Environment
National System of Protected Wild Areas (SNASPE) 14,630.5 thousand ha (MMA)
Population:
Population year 2010 17,066,172 individuals
Male year 2010 8,447,879 individuals
Female year 2010 8,618,263 individuals
Population year 2016 (estimate) 18,191,884 individuals National Statistics Institute
Male year 2016 (estimate) 9,003,254 individuals (INE)
Female year 2016 (estimate) 9,188,630 individuals
Population year 2020 (estimate) 18,896,684 individuals
Population year 2050 (estimate) 20,204,779 individuals
Rural population year 2015 12,7%
Indigenous Population year 2013 1,565,915 individuals
Ministry of Social Development
Mapuche Population year 2013 1,321,717 individuals
(MIDESO)
Aimara Population year 2013 120,621 individuals
Migrant Population year 2013 354,581 individuals
Social Development:
Life Expectations year 2015 79.1 años National Statistics Institute
Infant Mortality year 2013 (per each thousand born infants) 7.0 (INE)
Literacy Rate year 2012 98.9% UNICEF
Urban Population connected to sewerage system year 2014 96.7%
Superintendency of Sanitation
Urban Population connected to potable water supply year 2014 99.9%
Services (SISS)
Sewage treated at treatment plants year 2014 99.9%
United Nations Development
Human Development Index year 2014 0.832
Program (PNUD)
Population in extreme poverty year 2015 3.5%
Population in poverty year 2015 11.7% Ministry of Social Development
Difference between richest 10% and poorest 10% year 2015 27.2 (MIDESO)
Gini coefficient year 2015 0.482 / 0.495
Economic Activity:
GDP 2015 USD 240,215.7 million
GDP per capita year 2015 USD 22,316
Estimated GDP growth as of 2016 1.9% annual
World Bank
Estimated GDP growth as of 2018 2.3% annual
Commodities Exports year 2015 43.7% total exports
Goods and services Exports year 2015 30.1% PIB
1 Regarding South America and Oceania area
10 Chile’s Third National Communication on Climate Change - Ministerio del Medio AmbienteExecutive Summary
Information Source
Geography and population
Economic Activity:
Trade Balance year 2014 USD 3.515 million
Mining Exports year 2014 54.2% total exports DIRECON
Forestry and agriculture Exports year 2014 7.6% total exports
Industrial Exports year 2014 38.2% total exports
Energy:
Non-renewable sources in electric matrix year 2015 55.9% National Energy Commission (CNE)
Electricity production capacity year 2015 20,375 MW
Hydroelectricity in the electric matrix year 2015 34%
NCRE year 2015 11.48% Ministry of Energy
Projected NCRE year 2050 60% (MINENERGIA)
National electric coverage year 2015 99.0%
Rural electric coverage 96.1%
Agriculture and Forestry:
Forestry and agriculture Exports year 2013 USD 15,505 million
Office of Agricultural Studies
Forestry and agriculture Exports year 2014 USD 16,042 million
and Policies (ODEPA)
Forestry and agriculture Exports year 2015 USD 14,691 million
Arable area year 2015 3.3 million ha
Area under irrigation year 2015 1.1 million ha
Forestry area year 2016 17.5 million ha
National Forestry Corporation
Native forest area year 2016 14.3 million ha
(CONAF)
Forest plantations area year 2016 3 million ha
Planted area year 2014 4,500 ha
Replanted area 94,000 ha
Number or workers year 2010 685.5 thousand individuals National Statistics Institute
Number of workers year 2014 703.6 thousand individuals (INE)
Aquaculture and Fishing:
Aquaculture centers crop year 2014 1,214.44 thousand
non-industrial fishing year 2014 1,507.21 thousand t
Industrial fishing year 2014 1,029.69 thousand Fishing and Aquaculture
Fish production year 2014 74.5% National Service (SERNAPESCA)
Mollusk production year 2014 12.3%
Algae production year 2014 11.5%
Number of workers year 2010 61.6 thousand individuals National Statistics Institute
Number of workers year 2014 43.9 thousand individuals (INE)
Mining:
Iron Extraction year 2015 9,427.6 thousand fine metric t
Copper Extraction year 2015 5,478.0 thousand fine metric t
National Statistics Institute
Sodium chloride production year 2015 10,553.4 t
(INE)
Calcium carbonate production 6,849.5 t
Sulfur compounds production 4,629.7 t
Transportation:
Private transportation fleet year 2015 4,063,153 units
National Statistics Institute
Public transportation fleet year 2015 188,552 units
(INE)
Cargo transportation fleet year 2015 216,745 units
Residues:
Solid waste arranged in final disposal sites year 2010 5,935.7 thousand t Ministry of the Environment (MMA)
Solid waste arranged in final disposal sites year 2014 6,866.2 thousand t Ministry of the Environment (MMA)
Sewage treated with activated muds year 2014 59.0%
Sanitary Services
Sewage treated with treatment ponds year 2014 19.8%
Superintendence (SISS)
Sewage conducted through underground emissaries year 2014 11.7%
Chile’s Third National Communication on Climate Change - Ministerio del Medio Ambiente 11Executive Summary
Figure 2. National GDP at constant prices and inflation, as a Consumer Price Index (IPC)
140.000 40
120.000 35
30
100.000
CLP, thousand million
25
Inflation (%)
80.000
20
60.000
15
40.000
10
20.000 5
0 0
1980 1982 1984 1988 1990 1992 1994 1996 1998 2000 2002 2004 2006 2008 2010 2012 2014
Inflation GDP (constant price) Source: Prepared with Direcon data, 2015.
1.3. National Institutional Framework related to climate change
Since the climate change issue entered the international public agenda, Chile has maintained a proactive
attitude towards climate change which has prevailed through time and through the different Governmental
administrations.
The national institutional framework in charge of climate change in Chile brings together almost the entire
Governmental system. Consequently the issue is not dealt with at a single ministry or public entity, although
it is apparent that some institutions have a greater relative weight in the policies, strategies and actions
definition, as well as in their execution. The country has a dual public institutional framework, in the sense
that entities with specific responsibilities participate in the issue together with crossed instances for decision
making and action coordination among different ministries.
PN Torres del Paine, Charif Tala.
12 Chile’s Third National Communication on Climate Change - Ministerio del Medio AmbienteExecutive Summary
The main Governmental bodies that are a part of the national institutional framework related to climate change are:
The Council of Ministers for Sustainability (CMS), which is the top climate governing body,
The Ministry of Environment (MMA), with the technical focal point regarding the climate change issue,
as established by the legal regulations in force, through the Climate Change Department (DCC) based
at the Air Quality and Climate Change Division,
The Ministry of Foreign Affairs, which role is the focal point before the UNFCCC and any other multi or
bi-lateral international instance related to the climate change issue; its action in this area is carried
out through the Environment and Oceanic Affairs Directorate (DIMA),
Coordination among ministries corresponding to the Inter-ministries technical team on Climate Change
(ETICC), and
Climate Units belonging to the different ministries which have assumed direct actions.
Currently the main instruments are:
National Action Plan on Climate Change (PANCC)
2017-2022. Its purpose is to establish a public
policy instrument integrating and orienting
all actions referred to climate change (public
consultation, 2016).
Law 20,698. This law enacted in 2013, establishes
that by 2025 20% of the energy produced in Chile
will be originated by renewable sources.
Early Mitigation Actions. Chile adopted a series
of mitigation actions beyond the commitments
established at the Convention for the Non-Annex
The Adaptation Plan of the Forestry and Agriculture
I countries, among the main early mitigation
actions is the Energy Program and Law 20,257 of Sectors, approved in 2013 by the CMS, currently
NCREs encouragement. under implementation,
The Climate Change Adaptation Plan in Biodiversity,
Climate Change Adaptation. At present Chile
has the “National Climate Change Adaptation approved in 2014 by the CMS, currently under
Plan”, which includes all sectorial plans and implementation, and
was approved on December 1, 2014 by the The Climate Change Adaptation Plan for Fishing
Sustainability Ministers Council (CMS), and the and Agriculture, approved in 2015 by the CMS, also
following sectorial plans: currently under implementation.
2 Law 20,417 establishes that “the Ministry will be in charge of looking after the compliance with the environmental international
conventions in which Chile participates, and acting as administrative, scientific or technical counterpart of such conventions, wi-
thout prejudice of the Ministry of Foreign Affairs powers”.
Chile’s Third National Communication on Climate Change - Ministerio del Medio Ambiente 13Executive Summary
The National Climate Change Adaptation Plan and the PANCC 2017-2022 have a governance operational
structure for the public sector. The cross-cutting handling of Climate Change issues is conducted by the Climate
Change Inter-ministries Technical Team (ETICC), created in 2015 and coordinated by the DCC. ETICCmembers
are the ministry focal points on climate change appointed by their corresponding institutions. At sub-national
level, the issue was implemented through the Climate Change Regional Committees (CORECC), headed by the
Regional Government, with the participation of the Ministry Regional Secretaries (Seremis), municipalities
and the representatives of the Regional Consultative Councils (Figure 3).
Figure 3. Operating structure for the implementation of the climate change national policy
*
Law 20,417 (Environmental Law) Source: National Climate Change Adaptation Plan, 2014.
Preparation of plans and assistance to implementation and follow-up Plans implementation and follow-up
14 Chile’s Third National Communication on Climate Change - Ministerio del Medio AmbienteExecutive Summary
Archivo MMA.
1.3.1. Environmental Performance Review of Chile by the OECD 2016
In July, 2016 Chile received the results of its Second Environmental Performance Review by the OECD. After the
first assessment carried out in 2005, on this occasion 54 recommendations were received.
Regarding climate change, the OECD acknowledges the existence and effectiveness of the inter-ministries
coordination instances. However, since the implementation of measures and actions greatly relies on the
voluntary participation by the ministries and in their
capabilities, it recommends Chile “to strengthen
and formalize the institutional basis of the policy on
climate change with the purpose of establishing well
defined implementation responsibilities, according
to Chile’ situation and international commitments”.
The OECD also identified the need to adopt and
implement national policies on climate change, in
order to overcome the shortcomings detected as
regards the existence of initiatives with a positive
impact on climate change. The increase of energy
efficiency or the expansion of energy generation
based on renewable energiesare not under a common
articulatory framework and do not always explain
their relation with climate change. Consequently,
the OECD recommends “adopting and implementing
a set of national policies on climate change in order
to materialize the contribution foreseen, determined
at a national level for 2030; applying the mitigation
actions appropriate for each country, or alternative
measures to ensure compliance with the target as
established for 2020”.
Chile’s Third National Communication on Climate Change - Ministerio del Medio Ambiente 15Executive Summary
2 Chile's National Greenhouse Gas
Inventory, 1990-2013
Key points
In 2013, Chile’s total GHG emissions (excluding FOLU) amounted to 109,908.8 Gg CO2 eq, an increase
of 113.4% since 1990 and of 19.3% since 2010. The main GHG emitted by Chile was CO2 (78.4%),
followed by CH4 (10.7%), N2O (10.0%), and fluorinated gases (0.9%).
The Energy sector is the largest GHG emitter in Chile (77.4%), mainly due to the consumption of
coal and diesel for electricity generation and consumption of diesel in road transport.
The Agriculture, Forestry, and other land uses (AFOLU) sector is the only sector that consistently
removes CO2 in the country, and remains as a sink for the entire time series. Net removals from
the sector amounted to -26,119.2 Gg CO2 eq mainly due to the increase in biomass in forest
plantations and second-growth natural forest.
In 2013, Chile’s balance of GHG emissions and removals (including FOLU) amounted to 70,054.4 Gg CO2 eq.
2.1. Introduction
This is the Fourth National Greenhouse Gas Inventory (NGHGI) submitted by Chile to UNFCCC in fulfillment
of Article 4, paragraph 1(a) and Article 12, paragraph 1(a) of the UNFCCC and decision 1/CP.16 of the 16th
Conference of the Parties (Cancun, 2010).
Chile’s NGHGI is compiled according to 2006 IPCC Guidelines for national greenhouse gas inventories, covering
the entire national territory and including emissions and removals of carbon dioxide (CO2) and emission
of methane (CH4), nitrous oxide (N2O), hydrofluorocarbons (HFCs), perfluorocarbons (PFCs), and sulfur
hexafluoride (SF6) in a series of time from 1990 to 2013.
2.2. Institutional arrangements and preparation of Chile’s NGHGI
Since 2012, the area of GHG Inventories of the Ministry of the Environment’s Department of Climate Change
(DCC) designed, implemented, and has maintained the National Greenhouse Gas Inventory System of Chile
(SNICHILE), which contains the institutional, legal, and procedural steps for the biennial update of Chile’s NGHGI,
thus ensuring the sustainability of the preparation of GHG inventories in the country, the consistency of GHG
flows reported, and the quality of the results. SNICHILE’s ongoing work is divided into five lines of action:
Operation of SNICHILE Capacity building
Updating of Chile’s NGHGI Archiving and dissemination.
Quality assurance and quality control system
16 Chile’s Third National Communication on Climate Change - Ministerio del Medio AmbienteExecutive Summary
SNICHILE’s work plan is organized in a two-year cycle of activities. During the first year the Sectorial
Technical Teams update the Sectorial Greenhouse Gas Inventories (SGHGI), while in the second year the
Coordinating Technical Team compiles the SGHGIs and develops the cross-cutting issues of Chile’s NGHGI.
The preparation of the Fourth Chile’s NGHGI began
during the first half of 2015 and concluded in
mid-2016. The Energy’s SGHGI was updated by the
Ministry of Energy’s Foresight and Energy Policy
Division; the IPPU’s SGHGI was updated by the
MMA’s DCC; the AFOLU’s SGHGI was updated by
the Ministry of Agriculture through the Office
of Agrarian Studies and Policies (ODEPA), the
National Forestry Corporation (CONAF), the Forest
Institute (INFOR), and the Agricultural Research
Institute (INIA); the Waste’s SGHGI was jointly
updated by the Ministry of Environment’s Waste
and Environmental Risk Office and its DCC.
Once the updating process was completed, the
SGHGIs were compiled by the MMA’s DCC for the
preparation of Chile’s NGHGI and the respective
National Greenhouse Gas Inventory Report (NIR),
which goes through a review process at the
national and international levels.
In conclusion, Chile’s NGHGI is the result of the collective and continuous efforts of the Ministries of
Agriculture, Energy, and Environment, which have worked in coordination under the framework of SNICHILE.
This work has strengthened the preparation of Chile’s NGHGI by adding expert knowledge from the various
sectorial ministries involved.
2.3. Trends in Chile’s greenhouse gas emissions
In 2013, the balance of GHG3 emissions and removals in Chile amounted to 70,054.4 Gg CO2 eq, while total GHG
emissions4 in the country amounted to 109,908.8 Gg CO2 eq, an increase of 113.4% since 1990 and of 19.3% since
2010 (Table 2). The key drivers of this trend in the GHG balance were the Energy and the AFOLU sectors. The
values observed that fall outside of the trend (Figure 4) are primarily the consequence of forest fires accounted
for in the AFOLU sector.
In 2013, the total GHG emissions were dominated by CO2, accounting for 78.4%, followed by CH4 (10.7%) and N2O
(10.0%). Fluorinated gases collectively accounted for 0.9% of total GHG emissions in the country.
3
In this report, the terms “balance of GHG emissions and removals” or “GHG balance” refer to the sum of emissions and removals of
greenhouse gases, expressed in carbon equivalent (CO2 eq). This term includes the entire AFOLU sector.
4
In this report, the term “total GHG emissions” refers to the sum of national GHG emissions only, expressed in carbon dioxide equivalent
(CO2 eq). This term excludes sources of emissions and sinks from forestry and other land uses (FOLU) of the AFOLU sector, but includes
greenhouse gas emissions from Agriculture.
Chile’s Third National Communication on Climate Change - Ministerio del Medio Ambiente 17Executive Summary
Table 2. Chile’s NGHGI: GHG emissions and removals (Gg CO2 eq) by sector, 1990-2013
Sector 1990 2000 2010 2011 2012 2013
1. Energy 33,219.5 52,122.9 69,423.7 78,527.0 82,076.6 85,075.4
2. IPPU 3,127.5 6,449.6 6,008.1 6,868.3 7,214.9 6,619.4
3. AFOLU -30,866.3 -32,819.2 -30,514.4 -24,339.9 -18,410.7 -26,119.2
Agriculture 12,633.5 13,580.7 12,879.8 12,741.7 13,285.0 13,735.2
FOLU -43,499.8 -46,399.9 -43,394.2 -37,081.6 -31,695.8 -39,854.4
4. Waste 2,526.1 3,348.3 3,802.6 3,939.8 4,019.2 4,478.8
Balance (with FOLU) 8,006.8 29,101.5 48,719.9 64,995.1 74,899.9 70,054.4
Total (without FOLU) 51,506.6 75,501.4 92,114.2 102,076.7 106,595.6 109,908.8
Source: MMA’s Coordinating Technical Team
IPPU= Industrial processes and product use; AFOLU= Agriculture, forestry and other land use; FOLU= Forestry and other land use
Figure 4. Chile’s NGHGI: GHG emissions and removals (Gg CO2 eq) by sector, 1990-2013
100,000
80,000
60,000
40,000
Gg CO2 eq
20,000
0
-20,000
-40,000
Sector
1. Energy 2. IPPU 3. AFOLU 4. Waste Balance
Source: MMA’s Coordinating Technical Team
IPPU= Industrial processes and product use; AFOLU= Agriculture, forestry and other land use; FOLU= Forestry and other land use
The Energy sector is the leading GHG emitter in Chile, accounting for 77.4% of total GHG emissions in 2013.
That year, GHG emissions from the sector amounted to 85,075.4 Gg CO2 eq, an increase of 156.1% since
1990 and of 22.5% since 2010. In general, this is mainly due to the increase in energy consumption in the
country, including the consumption of coal and natural gas for electricity generation and consumption of
liquid fuels, mostly diesel and gasoline, for road transportation. With regard to subcategories, the Energy
Industries (mainly Main activity electricity and heat production) is the leading source of GHG emissions
within the sector, with 45.3% share in 2013, followed by 28.9% from Transport (mainly road transportation),
16.8% from Manufacturing industries and construction, and 8.0% derives from Other sectors (mainly
Residential). The Oil and natural gas subcategory accounted for 0.9%, while Solid fuel accounted for 0.1%.
18 Chile’s Third National Communication on Climate Change - Ministerio del Medio AmbienteExecutive Summary
Central termoeléctrica, Archivo MMA.
The IPPU sector accounted for 6.0% of total GHG emissions in 2013. In the same year, GHG emissions from
the sector amounted to 6,619.4 Gg CO2 eq, an increase of 111.7% since 1990 and of 10.2% since 2010.
Overall, this is mainly due to the sharp increase in production of iron and steel, lime, nitric acid, and
cement. With regard to categories, 37.7% of GHG emissions from the sector correspond to the Mineral
industry, followed by 23.9% from the Metal industry, 21.2% from the Chemical industry, 10.4% from
Product use as substitutes for ozone depleting substances, 4.7% from Other product manufacture and
use, and, finally, 2.1% from Non-energy products from fuels and solvent use.
The AFOLU sector is the only sector that consistently removes CO2 in the country, making it the most
relevant due to its mitigation potential. In 2013, the GHG balance from the sector amounted to -26,119.2
Gg CO2 eq, reducing its sink condition by 15.4% since 1990 and by 14.4% since 2010. Overall, this is
because the Land category decreased their removals, while GHG emissions from categories associated
with agricultural activities (Livestock and Aggregate sources and non-CO2 emissions sources on land) have
remained stable during the 1990-2013 series. Regarding emissions and removals of greenhouse gases in
absolute terms by category, 73.8% correspond to Land, followed by 15.5% from Aggregate sources and non-
CO2 emissions sources on land and, finally, 10.6% correspond to Livestock.
The Waste sector accounted for 4.1% of total GHG emissions in 2013. In the same year, GHG emissions
from the sector amounted to 4,478.8 Gg CO2 eq, an increase of 77.3% since 1990 and of 17.8% since 2010.
In general, the key driver is the sustained increase in solid waste generation and its final disposal in
landfills. With regard to categories, 72.0% of GHG emissions from the sector correspond to Solid waste
disposal, followed by 26.7% from Wastewater treatment and discharge, 1.3% from Biological treatment of
solid waste and, finally, 0.01% from Incineration and open burning of waste.
In accordance with the requirements of the UNFCCC and the 2006 IPCC Guidelines, GHG emissions generated
by the consumption of fossil fuel in international air and maritime transport and CO2 emissions from
biomass burned for energy purposes were quantified and reported as memo items, but were excluded
from the balance of GHG emissions and removals in the country.
Chile’s Third National Communication on Climate Change - Ministerio del Medio Ambiente 19Executive Summary
3 Vulnerability and adaptation to climate
change of the country
3.1. General background and national policies
Chile is a country vulnerable to climate change, since it complies with seven of the nine vulnerability
characteristics as defined in the UNFCCC.
Chapter 3 presents the country’s vulnerability
conditions to the adverse effects of climate
change and the adaptation actions being adopted
with the purpose of taking into account Chile’s
needs and concerns on this matter. The adaptation
strategy is carried out through nine sectorial
plans and it is coordinated following to the
operational structure described in the National
Climate Change Adaptation Plan of 2014 and the
Climate Change National Action Plan 2017-2022.
3.2. Climate change trends observed and national projections
3.2.1. Atmospheric conditions observed
The trends observed in the average temperatures in Chile until 2010 show a cooling pattern at the coast and inland
warming (central valley) and at the Andes as a main trend. The coastal cooling coincides with the cooling pattern of
the superficial temperatures of the Pacific ocean given the decedal oscillation of the Pacific (PDO) (Vuille et al. 2015).
In the XX and XXI centuries the rainfall trends vary depending on the region and term considered. During the XX
century rainfall in the Northern zone (18°-30° South) shows a significant inter-decadal variability associated to
PDO. In the case of the Central zone (30-35° South), rainfall shows inter-decades variations associated to PDO,
while in the Southern zone (37°-43° South) there has been a decreasing trend during the term analyzed (1979-
2014). During the term 2010-2015 the Central-South zone of the country (from Coquimbo to Araucanía) recorded
a rainfall deficit close to 30% (Boisier et al. 2016).
3.2.2. Temperature and rainfall projections
For the preparation of the IPCC Fifth Report, AR5, new GHG emission and concentration scenarios were
developed called “Representative Concentration Pathways” (RCP). Using them, the fifth phase simulations
of the inter-comparison project of climate change projections simulations were generated (Coupled Modeling
Inter-Comparison Project 5, CMIP5).
20 Chile’s Third National Communication on Climate Change - Ministerio del Medio AmbienteExecutive Summary
Figure 5 shows the temperature projections for the term 2031-2050, for the two extreme scenarios RCP2.6,
RCP8.5, CMIP3-SRES A1B and the regional simulation PRECIS-ECHAM5 for the A1B emissions scenario.
The warming pattern is similar in all cases: greater warming at the high plateau level and lower at the
southern region. The regional model, given its greater space resolution projects a greater warming in the
Andean zone.
Figure 5. Maps of temperature change for RCP and SRES A1B (GCM and RCM)
scenarios for the term 2031-2050 as compared to the term 1961-1990.
RCP 2.6 RCP 8.5 SRES A1 B PRECIS-ECHAM5
(2031-2050)-(1961-1990) (2031-2050)-(1961-1990) (2031-2050)-(1961-1990) (2031-2050)-(1961-1990)
-20 -20 -20 -20
-25 -25 -25 -25
-30 -30 -30 -30
-35 -35 -35 -35
Latitud
Latitud
Latitud
Latitud
-40 -40 -40 -40
-45 -45 -45 -45
-50 -50 -50 -50
-55 -55 -55 -55
285 290 295 285 290 295 285 290 295 285 290 295
Source: Rojas, 2012.
Chile’s Third National Communication on Climate Change - Ministerio del Medio Ambiente 21Executive Summary In the case of rainfall, the trends of Figure 6 show that the term 2031-2050 would be dryer as compared to the historical mean, and a decrease between 5% and 15% is foreseen for the zone comprised between the basins of rivers Copiapó and Aysén. Such projections would increase towards the Southern zone of the country, specifically between the basin of Biobío river and the Southern limit of Los Lagos region. 3.2.3. Climate variability and extreme events Chile climate is strongly influenced by three climate forcings: El Niño Southern Oscillation (ENSO), PDO and the Antarctic oscillation (AAO). ENSO has been described as one of the factors explaining the climate variability observed in central Chile. In that area, ENSO’s occurrence is associated to location and high pressure centers intensity alterations by which the frontal systems enter the territory, establishing in general terms that during the warm or Niño phase the possibility of rainfall is higher than normal (Caviedes and Waylen, 1998). On the contrary, a decreasing trend has been noted in the rainfall amounts every time a significant decrease of the sea superficial temperature is recorded (La Niña phase) (Larkin and Harrison, 2002). Climate forcing has a significant impact on the frequency and intensity of hydro meteorological phenomena, such as a “megadrought” (Garreaud et al. 2015) that lasted from 2010 to 2015. 3.2.4. Cryosphere and sea conditions Cryosphere Recent studies indicate that climate variability factors (ENSO, PDO) considerably affect snow accumulation and mountain flow regimes. Historical changes in temperatures have altered the flow of lower elevation rivers, which suggests a possible development of a future threshold effect which could burst if the temperature increase noted during the last decades continues (Cortés et al. 2011; Masiokas et al. 2008; McPhee et al. 2014). Other large components of cryosphere are glaciers. Recent evidence shows a backwards trend in most of glaciers in Chile. The difficulty to produce a projection of such trends into a predictive model lies in the fact that the relative influence of temperature variations and rainfall over its evolution has not been established (Bown et al. 2008; Casassa et al. 1998; Masiokas et al. 2009, 2016; Mernild et al., 2015; Pellicciotti et al., 2014; Rivera et al., 2002, 2006). Sea In Chile the sea level relative variation (NMM) as compared to the marine soil is conditioned by the seismic activity in the subduction zone between the Nazca plate and the South American plate. An analysis from 22 Chile’s Third National Communication on Climate Change - Ministerio del Medio Ambiente
Executive Summary

the records of up to sixty years of mareographs
from the SHOA national network (Contreras-López
et al., 2012) indicates that the NMM change rates
differ significantly along the country. The place
with the greatest increase in NMM is Easter
Island, with 3.2 mm/year. Forecasts of one of the
climate change conservative scenarios for 2100
show NMM increases between 0.2 and 0.3 m for
different latitudes in Chile, values which coincide
with the increase rates estimated by Cepal (2011)
and the IPCC report (Magrin et al., 2014). Using
numerical models, Albrecht and Shaffer (2016)
project NMM increases at the Chile coast of 34
to 52 cm for the RCP4.5 scenario, and of 46 to 74
cm for the RCP8.5 scenario at the end of the XXI
century.

The increase of atmospheric CO2 emissions is
inducing changes to the chemistry of sea water,
decreasing its pH, lowering the availability
of carbonate ions and reducing the calcium
carbonate status. This phenomenon, known as ocean acidification occurs at a faster pace at the polar
and sub-polar regions, such as Antarctica. The average pH of the surface water has been reduced by
approximately 0.1 units since the industrial revolution and future reductions are expected of up to 0.3
units for year 2100 (IPCC, 2013).

3.3. Sectors vulnerable to climate change

From a vulnerability perspective, it is expected that the country is significantly impacted by climate
change associated phenomena. The most relevant sectors in Chile that are vulnerable to climate change
are water resources, biodiversity, farming, fishing and aquaculture, energy, cities, health, infrastructure,
tourism and coastal areas.

3.3.1. Water Resources

The water resources sector is fundamental because it has a direct and indirect influence on the
characteristics or productivity other sectors. The changes expected for the water sector may affect the
different water safety features, either because they decrease the amount of water available for different
productive uses, to sustain valuable means of life or ecosystems, or because they increase negative
effects in terms of water quality or occurrence of extreme events such as disasters of hydro meteorological
origin. Given their effects on water safety, hydric resources are directly connected to a series of sectors
and systems. Significant progress has been made in Chile since the Second National Communication
(2CN) in the study of such connections and in the analysis of indirect impacts mediated by changes in
hydrological conditions. Currently there are 37 basins or sub-basins under analysis from a hydrological
perspective, applying simulation models of SRES or RCP type climatic scenarios.

                               Chile’s Third National Communication on Climate Change - Ministerio del Medio Ambiente   23
Executive Summary
One of the most important basins in Chile is that of river Maipo, Figure 7. Ecosystems with a greater
located at central Chile with a population of about seven million space variability as a consequence
individuals concentrated in Santiago city. According to the of climate change.
different scenarios assessed by MAPA project, these effects could
dramatically reduce the water volumes stored at El Yeso dam, the
main source of water for the supply of potable water of Santiago
city. A worsening of the irrigation water supply conditions is also
expected due to an increase in water demand and a decrease of
its offer during the irritation season.
In spite of all the progress related to information of the effects
on climate by the observed and projected changes, the need to
generate more precise models allowing for future modeling should
be noted, for example to identify the effects of the temperature
increase on snow sublimation in the northern zone of the country,
or to understand the influence of rocky glaciers on the rivers
runoff regime.
3.3.2. Biodiversity
Since the 2CN Biodiversity vulnerability studies have been
updated both for species and ecosystems. The main results show
a longitudinal variation of desert formations towards Andean
vegetation and a latitudinal advance towards the south of the
desert scrub formations and Mediterranean sclerophyll forests.
The update of ecosystems analysis presented by Marquet et al.,
(2010) maintains the latitudinal change pattern of ecosystems,
concentrating the highest space variability at the Mediterranean
zone of central Chile and the interior North zone of the high-
temperature area (Araucanía Regions, de Los Ríos y Los Lagos),
which corresponds to areas dominated by scrub and sclerophyll
forests, thorn forests and deciduous forests (Figure 7).
A vulnerability index was calculated applying the “bioclimate
stress” concept to the 127 terrestrial ecosystems and including
different types of anthropogenic pressures (Santibáñez et al.,
2013). The index showed a trend to an increased vulnerability
towards the central zone both for a greater anthropic presence as
well as for the expected results of bioclimate stress. The floors with
greater values for this index are within the deciduous, thorn and
sclerophyll forest formations (Figure 8). The study also concludes
that faced to the new climate scenarios, vegetation floors tend
Greater variation ecosystems
to reduce and fragment around their present area instead of
displacing. Source: Pliscoff, unpublished data.
24 Chile’s Third National Communication on Climate Change - Ministerio del Medio AmbienteExecutive Summary
Figure 8. Ecosystems vulnerability To analyze impact on species, the most used approximation
index (vegetation floors) for 2050 corresponds to the species distribution models or niche models
scenario. (Guisan and Zimmermann, 2000). This methodology is used in
the Marquet et al., study (2010), which allows characterizing
the current distribution of one species and project it in future
scenarios by means of climate variables and known presences. As
a result of the ecologic niche modeling, the response to climate
change of the analyzed species shows for the term 2070-2100 that,
in general and even though decreases dominate in the species
distribution area of limited dispersion, the number of extinguished
species is reduced. It has been noted that the response is highly
dependent on the species dispersion capacity.
In the modeled term (end of the century), over half the studied
species could expand their distribution range, while considering
that most of species not able to disperse show decreases in their
projected distribution area. Such results are consistent with the
changes expected for native arboreal species of the Mediterranean
region of Chile reported in Bambach et al., (2013).
3.3.3. forestry, Agriculture and livestock
It is estimated that this is one of the most vulnerable sectors to
climate change phenomena. The livestock and forestry industries
are a significant source of employment, with a relevant share
in the country’s gross domestic product (GDP) of the country.
The 2CN showed a detailed analysis of the potential impacts of
climate change on the Agriculture sector. Most of the country’s
agricultural regions (Atacama to Los Lagos) would experience
aridization as a consequence of rainfall decline which will
continue during the XXI century (Agrimed, 2008). One of the
main conclusions of such study indicates a displacement of the
current agroclimate zones to the south, particularly referring to
fruit cultives and forestry (Agrimed, 2008).
Impact on agricultural productivity projections have been
updated for some crops, taking into account the new RCP climate
scenarios. For example, according to estimates based on RCP 8.5
scenario for corn, around 2050 the production potential would
considerably expand towards southerner latitudes as compared
to the current extension, a displacement mainly explained by
1,31-2,10 temperature increase in such latitudes. Notwithstanding, in
2,11-2,89 3,72-4,72 the northern part of the current production zone decreases in
2,90-3,71 4,73-5,66
the productive potential are foreseen of about 10% and 20%.
Source: Santibáñez et al., 2013. Irrigation requirements would decrease between 10% and 30%
Chile’s Third National Communication on Climate Change - Ministerio del Medio Ambiente 25Executive Summary
as a consequence of earlier crops which would allow a greater use of winter rainfall. Regarding crops
seasonality, in the central-north zone of the country the optimal sowing time would be advanced to
winter months given temperature increases. At the valley zone of the Metropolitan region advances
would be to August, while at the colder zones of Andean foothills crops would continue during the spring
(Figure 9).
In general, conclusions derived from the studies presented at the Second National Communication continue
being valid. Such results are consistent with evidences which did not find considerable differences in the
main climate variables among modeling derived from SRES and RCP scenarios for Chile zone.
Figure 9. Changes in the optimal sowing time between baseline (1980-2010) and 2050 scenario (RCP 8.5);
1980-2010 2050 Scenario
-720 -710 -700 -720 -710 -700
-290 -290 -290 -290
-300 -300 -300 -300
-310 -310 -310 -310
Sowing Month
-320 -320 -320 -320 Without
March
April
May
June
-330 -330 -330 -330
July
August
September
October
-340 -340 -340 -340 November
Dicember
-720 -710 -700 -720 -710 -700
Source: Agrimed, 2014.
3.3.4. Fishing and aquaculture
Fishing activities at the central-south zone of Chile are the most important in the country, since they
concentrate around 45% of domestic production. This zone productivity is determined by the Humboldt
Current system (SCH), one of the most productive in the world both for its primary production (Daneri et
al., 2000; Fossing et al., 1995) as well as fishing production (Bakun and Broad, 2003). The SCH occupies
the central-south of Chile (~ 42° S) until the north of Peru (~ 4°-5° S). The most significant forcing within
the context of climate change for SCH would be:
26 Chile’s Third National Communication on Climate Change - Ministerio del Medio AmbienteExecutive Summary
changes in the concentration of environmental oxygen in the water column and in the sediments
variations in the space-temporary intensity and dynamics of coastal upwellings
changes in the sea temperature
changes in ENSO frequency and intensity
changes in circulation (marine currents)
modification to the space-temporary dynamics of mesoscale physical structures (such as filaments,
meanders, swirls, jets)
increased sea level
change in sweet water contribution to the coastal ecosystem
The potential impact of climate change on Chilean fishing and aquaculture are mainly focused on the
effects of inter-annual variability associated to ENSO and PDO events. The importance of such variability
is related to different space-temporary scales with effect on abundance, survival to the first stages of
life, recruiting and changes in species distribution.
In Chile at least 11 fish and mollusk resources show different levels of vulnerability to climate change:
anchovy (Engraulis ringens), common sardine (Strangomera bentincki), horse mackerel (Trachurus
murphyi), hake (Merluccius gayi),
species of sand eel conger eel, Figure 10. Monthly projection of anchovy catches in the northern
crabs, Juan Fernández lobster zone of Chile, considering four climate change scenarios. Source:
Yáñez et al. 2014.
(Jasus frontalis), clam (Mesodesma
donacium), large oyster (Argopecten
purpuratus), abalone (Concholepas 75.000
concholepas) and sea urchin
(Loxechinus albus). 70.000
Monthly anchovy unloaads (ton)
Studies on the impact of future 65.000
changes in the sea mean surface
60.000
temperature (TSM) project an increase
in the anchovy catches in the north
55.000
of Chile in case TSM decreases by 0.02 °C
a year, and remarkable decreases if
50.000 + 0.035 0C/año
TSM increases by 0.034 °C a year or + 0.025 0C/año
by 0.025 °C a year (Figure 10) (Yáñez - 0.025 0C/año
45.000 No climate change
et al. 2014).
40.000
2010 2020 2030 2040 2050 2060 2070 2080 2090 2100
Source: Yáñez et alter, 2014.
Chile’s Third National Communication on Climate Change - Ministerio del Medio Ambiente 27Executive Summary
3.3.5. Energy
In terms of energy supply, a series of connections with climate conditions may be found, particularly in the
case of renewable generation sources. The most evident is the case of hydroelectric generation, which directly
depends on the availability of hydric resources. In Chile, a little less than 50% the electricity supply of the SIC
(from Taltal to the South) comes from hydroelectric generation and, in general, the growth plans of such offer
consider this source as a significant strategic axis. The latter coincides with recent studies (TECO Group and
CCGUC, 2015) which show there is still a significant generation potential for the basins in the south of Chile
(basins at the south of river Maipo). Figure 10 shows the possible impacts of climate change on the electric
energy generation at three of the most important basins in the country.
Figure 11. Estimate of climate change impact on the electricity generation capacity associated to future
projects at Maule, Biobío and Toltén basins.
111%
8.000 Maule
101%
Energy generation
7.000 91%
6.000 81%
(GWh)
71%
5.000
61%
4.000
51%
3.000 41%
Current 2010 - 2040 2040 - 2070 2070 - 2100
111%
16.500 Biobío
101%
14.500
Energy generation
91%
12.500 81%
(GWh)
71%
10.500
61%
8.500
51%
6.500 41%
Current 2010 - 2040 2040 - 2070 2070 - 2100
7.000 112%
6.500 Toltén
102%
6.000
Energy generation
5.500 92%
5.000 82%
(GWh)
4.500 72%
4.000
62%
3.500
3.000 52%
2.500 42%
Current 2010 - 2040 2040 - 2070 2070 - 2100 Source: Teco Group and CCGUC, 2015.
28 Chile’s Third National Communication on Climate Change - Ministerio del Medio AmbienteExecutive Summary
3.3.6. Infrastructure
Infrastructure services and works are the support to a wide range of social and productive sectors.
Consequently they enable economic development and social wellbeing, the population’s health and
quality of life. In Chile infrastructure vulnerability to climate change has started being characterized
by means of studies describing the potential impacts on hydric resources (as a resource and as a
threat) and implications of such impacts. Furthermore, recently the Ministry of Social Development has
started developing a Methodology for the Identification and Assessment of Disaster Hazards in Public
Investment Projects. This effort requires a better description of the physical processes and vulnerability,
and of exposure conditions that trigger a disaster. The need to also incorporate climate change has been
detected in this process. It is worth mentioning that such progress has also led to define methodologies
to assess climate change impact on infrastructure, in order to have new design and adaptation practices.
A relevant document is the “Methodological Approach to assess climate change adaptation at the MOP
public infrastructure” (CCG-UC, 2012), which defines a methodology to incorporate climate change to
works planning, design and operation.
According to research conducted, impacts associated to climate change would affect drainage, fluvial
works, bridges, ports infrastructure as well as coastal infrastructure.
3.3.7. Cities
The “Urban Adaptation to climate change” Study (MMA, 2014) considered urban vulnerability to variability
and climate change of Chile’s regional capitals and analyzed how such climate threats are considered
by the territorial planning instruments. The five main threats, of a total of fourteen identified in this
study are, in order of occurrence: floods, mudslides and downpours, landslips, droughts and temperature
increase.
One of this study’s conclusions is that national institutions show limitations in deploying climate change
agendas at their national territories. A lack of involvement by local governments is apparent, which
increases vulnerability conditions in some cities along the national territory.
In a MINVU study (2016) carried out within the framework of the UNDP project “Implementation of the
Urban Development National Policy”, the impact hazard of climate events is estimated per regional
capital and it is illustrated by means of a climate origin threats index, and a social vulnerability index
based on poverty, as established by CASEN survey. The threats index is composed by events occurred and
their occurrence probability according to geographic location, including the possibility of sea level rise
for the nine coastal regional capitals.
The study “Preparation of a digital basis of Chile’s climate as per district: baseline (1980-2010) and
projection to 2050” (MMA, 2016b) provides information on climate change as of 2050 according to the
RCP8.5 scenario for 336 Chilean districts.
Table 3 shows a synthesis of two studies (MMA, 2016, 2016b) for the fifteen Chilean regional capitals.
Rainfall absolute changes of less than 5 mm/year have been considered as “0”.
Chile’s Third National Communication on Climate Change - Ministerio del Medio Ambiente 29You can also read