Climate Change Response Strategy - Ekurhuleni
←
→
Page content transcription
If your browser does not render page correctly, please read the page content below
Ekurhuleni Metropolitan Municipality

Climate Change
Response Strategy
2015
Contents
Executive Summary ................................................................................................................................. 3
Description of the city ............................................................................................................................. 7
   Introduction to Ekurhuleni................................................................................................................... 7
   Climate ................................................................................................................................................ 9
   Topography and Landscape ................................................................................................................. 9
   Development goals and priorities of municipality - GDS focus ............................................................ 13
   Climate change and Cities .................................................................................................................. 13
Defining climate change ........................................................................................................................ 14
   Climate Change ................................................................................................................................. 14
   The greenhouse effect: natural and enhanced ................................................................................... 14
   Carbon dioxide and the carbon cycle ................................................................................................. 16
   Increases in greenhouse gases due to human activities ..................................................................... 17
   Climate Modelling ............................................................................................................................. 18
   Summary of Observed Climate Trends for South Africa (1960 - 2012) ................................................ 22
   Projected climate Futures for South Africa (2015 - 2035, 2040 – 2060 and 2070 - 2090) in the
   Ekurhuleni Context ............................................................................................................................ 22
   Climate Change in the context of the EMM........................................................................................ 23
Impacts and vulnerabilities .................................................................................................................... 25
   Impacts ............................................................................................................................................. 25
   Vulnerability ...................................................................................................................................... 25
   Effects of Climate Change related to region within the Ekurhuleni Region ......................................... 26
       Drought and Water Scarcity ........................................................................................................... 26
       Flooding......................................................................................................................................... 26
       Heat Waves ................................................................................................................................... 27
       Bushfires........................................................................................................................................ 28
       Biodiversity.................................................................................................................................... 28
   Sectoral Analysis of the direct and indirect impacts of Climate Change .............................................. 29
       Water ............................................................................................................................................ 29
       Agricultural .................................................................................................................................... 29
       Human health ................................................................................................................................ 29
       Biodiversity and ecosystem............................................................................................................ 29
Human settlements ....................................................................................................................... 29
Building resilience and Climate Proofing the City ................................................................................... 31
   Adaptation ........................................................................................................................................ 31
      Define ............................................................................................................................................ 31
      Actions .......................................................................................................................................... 33
   Mitigation.......................................................................................................................................... 38
      Define ............................................................................................................................................ 38
      Actions .......................................................................................................................................... 38
Climate Change Implications for Ekurhuleni........................................................................................... 41
   Environmental degradation and effects ............................................................................................. 41
   Ekurhuleni’s key commitments .......................................................................................................... 43
   Human Health and Social well being .................................................................................................. 44
   Green and Clean Energy .................................................................................................................... 47
   Water for all ...................................................................................................................................... 48
   Waste –Minimisation Efforts and Recycling ....................................................................................... 50
   Air Quality and GHG Reduction .......................................................................................................... 51
   Conservation of Biodiversity .............................................................................................................. 52
   Mining and its Legacy ........................................................................................................................ 54
   Green Economy ................................................................................................................................. 56
   Development of Green By-Laws and Imposing Green Building Principles ........................................... 57
   Conclusion and Way forward ............................................................................................................. 58
PREFACE
It is imperative that the planning and policy framework process be understood. The Climate Change
Response Strategy is the overarching framework for climate change actions for the Ekurhuleni city
region. The Environmental Resource Management (ERM) Department will in conjunction with this
process engage with key departments and develop individual Climate Change Response Plans, which will
start to highlight the effects and impacts that climate change will have on the particular departments
sphere of work. The relevant department will be led through a process of understanding to highlight
that planning around climate change needs to be done in conjunction with current planning processes
to ensure that all risk are well covered. The Climate Change Departmental Response Plan will start the
negotiation process between ERM and the relevant department and will determine the relevant actions
that the department will commit to, these actions will be taken up in the Environmental Cooperative
Agreements that are developed and signed by the Heads of Department. In some instance departments
may require specific information on a particular action and ERM will then aid in development of
Sustainability Benchmark Guidelines, attached as annexures to the climate change departmental
response plans, to providing best practice methods.
EXECUTIVE SUMMARY

Cities act as the concentration of economic activity within any region. Cities are therefore consumers of
the vast majority of natural resources within the country and act as a major contributor to
environmental degradation. Although urbanization is the driving force for modernization, economic
growth and development, there is increasing concern about the effects of expanding cities, principally
on human health, livelihoods and the environment. The implications of rapid urbanization and
demographic trends for employment, food security, water supply, shelter and sanitation, especially the
disposal of wastes (solid and liquid) that the cities produce are staggering (UNCED, 1992). This intense
utilisation of natural resources has severe effects on the natural environment within the region causing
it the ecosystems within the area to become severely distressed. The City of Ekurhuleni is no different in
this respect. The urban landscape has highly concentrated populations that are serviced by major
infrastructure, which renders them vulnerable to the impacts of climate change and environmental
degradation. These impacts may be warmer temperatures, fiercer storms and increases in rainfall over
shorter periods, contributing to the exposure of the society to flash floods and other natural disasters.
At the same time, better urban planning, policies and service delivery infrastructure choices can reduce
energy use, greenhouse gas emissions, improve the resilience of urban infrastructure to climate change,
and minimize the impact of climate change on the poor, thus shaping future trends.

The Ekurhuleni Climate Change Response Strategy has being developed by the Environmental Resource
Management Department to aid the organisations in dealing with the issues and impacts related to a
changing climate. Ekurhuleni is regarded as the manufacturing & industrial hub of Gauteng which thus
positions the city as a large emitter of GHGs. Further to this Ekurhuleni is home to the largest airport in
South Africa – OR Tambo International Airport and has positioned itself to be the first Aerotropolis City
in Africa. This would mean that the heart of the region would be a transport and logistics nexus lead to
freight movement and thus associated emissions related to transport sector.

Addressing the effects of climate change, environmental degradation and reduction of GHG emissions
not only improves the natural environment, ecosystem services and living habitat, but also helps
municipalities in three dimensions of sustainability: economic, environmental, and social.

    1. Economic: The maintenance of sprawled communities is expensive and contributes to the
       municipal infrastructure deficit. Taking measures towards increasing energy efficiency, water
       usage and protection of soils is not only about combating climate change, but also about
       ensuring that our communities are economically viable, well into the future. In particular
       research shows that the impacts of climate change are borne most heavily by the poor, thus
       combating climate change and its effects within EMM ensures not only economic viability but
       protection of the poor.
2. Environmental: The predicted effects of climate change include extreme weather events,
       increased frequency of disease, and heat stress. These will undoubtedly have serve effects on a
       number of sectors including agricultural, hampering consistent production and leading food
       insecurity. Existing water management infrastructure (i.e. storage and drainage systems) may
       not be well suited to changes in precipitation. Fortunately many actions which will reduce
       emissions can also help municipalities adapt to climate change. Some examples of actions
       include water conservation measures e.g. fixing leaking pipes and rain water harvesting ;
       reducing energy use e.g. energy efficiency and solar water heating, and making municipalities
       more resilient in the face of droughts, and other extreme weather events.

    3. Social: Population is an important source of development, yet it is a major source of
       environmental degradation when it exceeds the threshold limits of the support systems. Unless
       the relationship between the multiplying population and the natural life support system can be
       stabilized, development programmes, howsoever innovative, are not likely to yield desired
       results. Population impacts on the environment primarily through the use of natural resources
       and production of wastes and is associated with environmental stresses like loss of biodiversity,
       air and water pollution and increased pressure on arable land. The burning of fossil fuels not
       only contributes to greenhouse gas concentrations, but also releases chemicals that are
       detrimental to human health. Ambient air quality within the region is linked directly to industry
       and manufacturing, informal settlement (fires, stoves, burning of garbage) and from motor
       vehicles, this has serious consequences for the region and environment. Therefore, taking action
       on climate change often results in improved air quality and human health. Climate change and
       environmental degradation also has numerous socio-economic impacts including increased
       health care costs, social disruption, loss of income and productivity and diminished quality of
       life.

Climate change is not just an environmental issue and more importantly it is not an issue which should
be addressed in isolation. The impacts of climate change and the varying parameters in which planning
for these should occur, cut across all sectors and ultimately culminate in direct impacts on the city’s
ability to deliver sustainable services.

In terms of the EMM issues pertaining to climate change risks and vulnerabilities relate to inter alia:

    •       Increasing temperatures impacting on social welfare and natural assets.
    •       Increased rainfall which could lead to infrastructure damage, particularly with regards to
            road infrastructure.
    •       Water service disruption due to increasing rainfall overburdening existing system capacity.
            Subsequently concerns were raised pertaining to the potential contamination to potable
            water as a result of ineffective and under capacitated service infrastructure.
    •       Increased dry spells will lead to a heightened need for water and again the over-capacitating
            of an already strained resource network.
    •       Changing weather patterns will greatly affect the agricultural sector of the EMM leading to
            inter alia reduced agricultural production.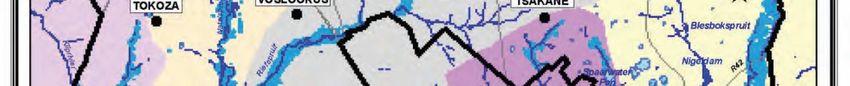
The context of climate change within the Ekurhuleni city region means that significant efforts need to be
made across all spheres within the organisational structure of our local government. The effect on the
region is not solely isolated to disaster risk and management, but further exacerbated to the functioning
of the region as an economic super force. To date, there has been little emphasis on the impact of
climate change on municipal services in the day to day operation of the city. Climate change is seen as
removed from the operational and implementation side of service delivery. Even within the strategic
planning sphere climate change, although recognized to some extent, is not addressed through the
practical and direct impacts that will result from climate variables, thus impacting on service delivery
and the contribution of service delivery. Climate change is not just an environmental issue and more
importantly it is not an issue which should be addressed in isolation. The impacts of climate change and
the varying parameters in which planning for these should occur, cut across all sectors and ultimately
culminate in direct impacts on the city’s ability to deliver sustainable services. As such Ekurhuleni has
identified climate change and the possible impacts thereof as a paramount aspect of integrated planning
within the region, which will be incorporated and addressed into all strategic plans for the region. This
will ensure that our communities, industries and businesses have the necessary support and assurance,
in order to cater for all the requirements needed in functioning as resilient global citizens.
DESCRIPTION OF THE CITY
INTRODUCTION TO EKURHULENI
The Ekurhuleni Metropolitan Municipality (EMM) was formed in 2000 from the joining of several local
municipalities of the former East Rand Region (See Figure 1). EMM was established as one of eight
metropolitan municipalities subsequent to the restructuring of local governments in South Africa in
2000. EMM is the fourth largest municipality in South Africa with nine local authorities and 101 wards.

EMM is also known as East Rand, the eastern region of Gauteng Province in South Africa. It consists of
192, 355 hectares of land which is occupied by about 3.2 million people (Statistics South Africa, 2011),
occupying approximately 900,000 households (EMM Full Term Report 2006-2011, 2011). EMM united
eleven former councils into one local government authority to meet the needs of the communities in a
holistic approach. The councils are Alberton, Benoni, Boksburg, Brakpan, Edenvale, Germsiton, Kempton
Park/Tembisa, Nigel, Springs, Khayalami Metropolitan Council and Eastern Gauteng Service Council. The
municipal population makes up about one third (28%) of Gauteng’s population, with a population
density of approximately 1 400 people per square kilometer (EMM, 2010). Population densities are high
especially in the former “township” and informal residential areas. Approximately 22% of the population
resides in informal and inadequate housing. Despite having a large percentage of the population of
working age, the rate of unemployment is high, approximately 40%. The municipality, being a
conglomeration of nine previously separate municipalities, has no identifiable core and also has an
interesting equity profile; where ‘low development densities with historically disadvantaged
communities [are] situated on the urban periphery’ (about 24% of the population live in poverty and the
current estimated unemployment rate is 35%) (EMM, 2010, 9). There is currently (at the time of
preparation of the 4th review) a great housing backlog with an estimated 135 000 shacks in informal
settlements and 36 000 backyard shacks.

              Surface Area                           1,924 km2
              Population                             3.2 million (StatsSA,2011)
              Population Density                     1,400 people per km2
              Proportion of Gauteng Population       28%
              Population Growth (2004-07)            1.6%
              Main Income Areas                      Manufacturing, Trade, Social
                                                     Services
              Electricity Use per Annum              15,513,201,926 kWh
              Emissions per Capita                   7.7 tCO2e
              Annual Budget                          R21 Billion (+- 2.19 billion USD)
              Budget for IDP Projects                R2 Billion
FIGURE 1: LOCALITY MAP OF EKURHULENI
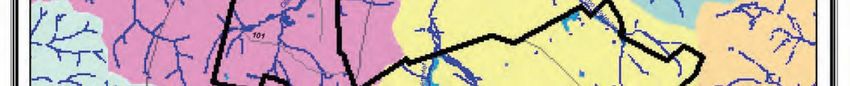
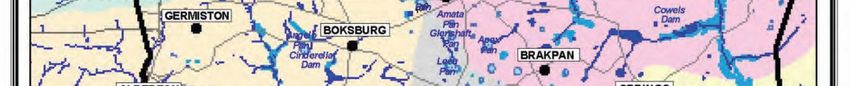
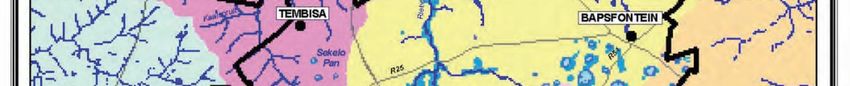
CLIMATE
Summers in Ekurhuleni are considered mild with temperatures seldom above 300C (EMM SOER, 2004
and EMM EMF, 2007). Ekurhuleni falls within the summer rainfall region of South Africa and the
experience of hot wet summers and cool dry winters are normative. More than 80% of the rainfall
occurs from October to April. Average rainfall for the region is between 715 mm to 735 mm annually.
The region is prone to intense rainfall events in terms of thunderstorms, which generally fall in the late
afternoons. These storms account for the major flooding and heavy rainfall events that affect Ekurhuleni
and can cause much damage to livelihoods and infrastructure (Tyson and Preston-Whyte, 2000). A
number of recent studies have examined daily rainfall in and around Gauteng over the past few decades
to gain a better understanding of rainfall variability and change (CoJ, 2009; Dyson, 2009; Fatti and Vogel,
2009).

TOPOGRAPHY AND LANDSCAPE
The convergence of the Limpopo and Vaal river catchments is observed within the EMM region. The
terrain is generally flat with elevations ranging from 1460 m to 1760 m. The following topographical
features are prominent within the landscape of Ekurhuleni i.e. plains with pans; undulating plains with
pans; strong undulating plains; superimposed river valley (i.e. Blesbokspruit) on plains with pans and
ridges (EMM SOER, 2004 and EMM EMF, 2007).

The occurrence of groundwater in EMM is prominent, due to the underlying geology within EMM, which
is dominated by dolomite of the Chuniespoort Group and tillites of the Dwyka group, both of which are
formidable for the water carrying capacity, (EMM EMF, 2007).

The surface hydrological system consists of 6 river or spruit systems (See Figure 2). The Blesbokspruit, is
a system that originates to the north of Benoni and Daveyton and flows southwards through Springs and
Nigel towards the Vaal river. The eastern part of the catchment contains extensive natural wetlands,
while the western part is highly modified by agriculture and human settlements. Key industrial sites
including mine dumps and slimes dams, waste disposal sites, intensive agriculture, and sewage works all
impact negatively on water quality. The second river system is the Klip River and its tributaries. The Riet
spruit originates in the south-west of the Benoni area and joins the Klip River outside the EMM
boundary. The Natalspruit, another tributary of the Klip Riverm, rises in and around the Germiston and
Boksburg areas. The upper reaches of the Klip River can be found to originate within Kathlehong. The
pollution within these spruits can be attributed to human settlements, agricultural practices and
industrial activities. Although these rivers join the Vaal River, they do so downstream of the Vaal dam,
thus the effects of this pollution on the EMM quality of drinking water is not problematic. However, the
pollution affects both the aesthetic and natural aspect of the Vaal River. The third river system includes
both the Kaal and Olifant Spruits. These originate in Kempton Park and Tembisa, and flows north to join
the Hennops River in Centurion. There is serious pollution in this system, which is attributed once again
to human settlements and agricultural activities. The Jukskei Spruit is the fourth system and has a
number of small tributaries within the system, which drain to the western region of EMM around
Edenvale. This system takes control as it leaves Ekurhuleni through parts of Alexandria. The fifth river
system is the Bronkhorst Spruit, which is located in the eastern region. This area is drained by two small
spruits namely Os spruit and Kofffie spruit, which feed the Bronkhorst Spruit. The sixth and final system
is the large Rietvlei Spruit. This system starts in the smallholdings area of Kempton Park and flows
northwards past the OR Tambo International Airport to Rietvlei Dam. This dam is a high contributor of
water supply in Tshwane. The primary supply of this water originates from agricultural and industrial
surface runoff. The Grootvlei River in the Bapsfontein area is a tributary of this system. An impressive
feature of the EMM region is the prevalence of a number of pans, which is directly linked to flat
topography. They cover a total area of 3 559 ha and are mostly seasonal. A few perennial pans are found
within the agricultural areas. A number of lakes aresituated within the municipal region and are
primarily a creation of the Gold Mines in the area. The Germiston, Benoni and Boksburg lakes are prime
examples of this and are utilised as recreational parks. However, the water quality of these systems is
under severe stress due to problems associated with water hyacinth, mine dust pollution and storm
water drainage (EMM EMF, 2007).
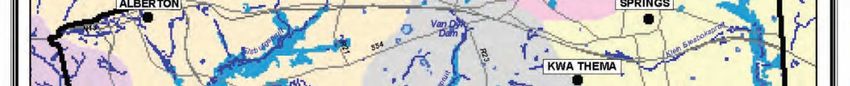
FIGURE 2: SURFACE WATER IN EKURHULENI

The water quality is generally poor in all river/stream systems within Ekurhuleni (details provided
below). The poor management of storm water, sewage treatment plant, industries and agricultural
activities all contributes greatly to the negative impacts on river/stream systems.
The damming of most of river and spruit systems is a common problem associated with the agricultural
activities in the region. Many of the rivers have been canalised, mostly for storm water control in urban
areas or for agricultural purposes. The ever-increasing human pressures in the area have caused many
of the natural systems in the area to a downward cycle of deterioration.

As described above the natural systems in EMM are overshadowed by contributions from sewage works
and mining. The increase in urbanisation has resulted in an increase in the surface water runoff of
almost 300%. The higher river flood peaks and levels pose serious threat to all developments (mainly
informal housing) within designated flood zones. Many parts of Tembisa, Katlehong, Tsakane and Nigel
are at particular risk.
DEVELOPMENT GOALS AND PRIORITIES OF MUNICIPALITY - GDS FOCUS

CLIMATE CHANGE AND CITIES
Cities act as the concentration of economic activity within any region. Cities are therefore consumers of
the vast majority of resources within the country and act as a major contributor to environmental
degradation. This intense utilisation of resources has serve effects on the natural environment within
the region causing it the ecosystems within the area to become severely distressed. The City of
Ekurhuleni is no different in this respect. The urban landscape has highly concentrated populations that
are serviced by major infrastructure, which renders them vulnerable to the impacts of climate change
and environmental degradation. These impacts may be warmer temperatures, fiercer storms and
increases in rainfall over shorter periods, utilisation and development of open spaces, contributing to
the exposure of the society to flash floods and other natural disasters. At the same time, better urban
planning and policies can reduce energy use and greenhouse gas emissions and improve the resilience
of urban infrastructure to climate change, thus shaping future trends.

Addressing the effects of climate change, environmental degradation and reduction of GHG emissions
not only improves the natural environment, ecosystem services and living habitat, but also helps
municipalities in three dimensions of sustainability: economic, environmental, and social.

    4. Economic: The maintenance of sprawled communities is expensive and contributes to the
       municipal infrastructure deficit. Taking measures towards increasing energy efficiency is not
       only about combating climate change, but also about ensuring that our communities are
       economically viable, well into the future.

    5. Environmental: The predicted effects of climate change include extreme weather events,
       increased frequency of disease, and heat stress. Existing water management infrastructure (i.e.
       storage and drainage systems) may not be well suited to changes in precipitation. Fortunately
       many actions which will reduce emissions can also help municipalities adapt to climate change.
       Some examples of actions include water conservation measures e.g. fixing leaking pipes and rain
       water harvesting ; reducing energy use e.g. energy efficiency and solar water heating, and
       making municipalities more resilient in the face of droughts, and other extreme weather events.

    6. Social: Burning fossil fuels not only contributes to greenhouse gas concentrations, but also
       releases chemicals that are detrimental to human health. Therefore, taking action on climate
       change often results in improved air quality and human health. Climate change and
       environmental degradation also has numerous socio-economic impacts including increased
       health care costs, social disruption, loss of income and productivity and diminished quality of
       life.
DEFINING CLIMATE CHANGE CLIMATE CHANGE First, it is important to distinguish the meaning of weather from climate. Weather describes the conditions of the atmosphere at a certain place and time with reference to temperature, pressure, humidity, wind, and other key parameters (meteorological elements); the presence of clouds, precipitation; and the occurrence of special phenomena, such as thunderstorms, dust storms, tornados and others. Climate in a narrow sense is usually defined as the average weather, or more rigorously, as the statistical description in terms of the mean and variability of relevant quantities over a period of time ranging from months to thousands or millions of years. The relevant quantities are most often surface variables such as temperature, precipitation and wind. Classically the period for averaging these variables is 30 years, as defined by the World Meteorological Organization. Climate in a wider sense also includes not just the mean conditions, but also the associated statistics (frequency, magnitude, persistence, trends, etc.), often combining parameters to describe phenomena such as droughts. Climate change refers to a change in the state of the climate that can be identified (e.g., by using statistical tests) by changes in the mean and/or the variability of its properties, and that persists for an extended period, typically decades or longer. Climate change, as defined by the United Nations Framework Convention on Climate Change (UNFCCC), is a change of climate which is attributed directly or indirectly to human activity that alters the composition of the global atmosphere and which is in addition to natural climate variability observed over comparable time periods. It has been identified as a significant threat to human livelihoods and sustainable development in many parts of the world (IPCC, 2001). Global climate change is possibly the greatest environmental challenge facing the world this century. THE GREENHOUSE EFFECT: NATURAL AND ENHANCED The Earth’s climate system is powered by solar radiation (Figure 3). Approximately half of the energy from the Sun is supplied in the visible part of the electromagnetic spectrum. As the Earth’s temperature has been relatively constant over many centuries, the incoming solar energy must be nearly in balance with outgoing radiation. Of the incoming solar shortwave radiation (SWR), about half is absorbed by the Earth’s surface. The fraction of SWR reflected back to space by gases and aerosols, clouds and by the Earth’s surface (albedo) is approximately 30%, and about 20% is absorbed in the atmosphere. Based on the temperature of the Earth’s surface the majority of the outgoing energy flux from the Earth is in the infrared part of the spectrum. The longwave radiation (LWR, also referred to as infrared radiation)
emitted from the Earth’s surface is largely absorbed by certain atmospheric constituents—water vapour,
carbon dioxide (CO2), methane (CH4), nitrous oxide (N2O) and other greenhouse gases (GHGs); and
clouds, which themselves emit LWR into all directions. The downward directed component of this LWR
adds heat to the lower layers of the atmosphere and to the Earth’s surface (greenhouse effect). The
dominant energy loss of the infrared radiation from the Earth is from higher layers of the troposphere.
The Sun provides its energy to the Earth primarily in the tropics and the subtropics; this energy is then
partially redistributed to middle and high latitudes by atmospheric and oceanic transport processes.

FIGURE 3: MAIN DRIVERS OF CLIMATE CHANGE. THE RADIATIVE BALANCE BETWEEN INCOMING SOLAR SHORTWAVE
RADIATION (SWR) AND OUTGOING LONGWAVE RADIATION (OLR) IS INFLUENCED BYGLOBAL CLIMATE ‘DRIVERS’.
NATURAL FLUCTUATIONS IN SOLAR OUTPUT (SOLAR CYCLES) CAN CAUSE CHANGES IN THE ENERGY BALANCE (THROUGH
FLUCTUATIONS IN THE AMOUNT OF INCOMING SWR)
CARBON DIOXIDE AND THE CARBON CYCLE

All living organisms contain carbon, as do gases (such as carbon dioxide) and minerals (such as diamond,
peat and coal). The movement of carbon between large natural reservoirs in rocks, the ocean, the
atmosphere, plants, soil and fossil fuels is known as the carbon cycle.

The carbon cycle includes the movement of carbon dioxide:

            •   into and out of our atmosphere
            •   between the atmosphere, plants and other living organisms through photosynthesis,
                respiration and decay
            •   between the atmosphere and the top of the oceans.

FIGURE 4 THE CARBON CYCLE - THE CARBON CYCLE, SHOWING THE MOVEMENT OF CARBON BETWEEN LAND, THE
ATMOSPHERE AND THE OCEANS. YELLOW NUMBERS ARE NATURAL FLUXES AND RED NUMBERS ARE HUMAN
CONTRIBUTIONS IN GIGATONNES OF CARBON PER YEAR. WHITE NUMBERS INDICATE STORED CARBON (THE CARBON
CYCLE , NASA).
On longer time scales, chemical weathering and limestone and fossil fuel formation decrease
atmospheric carbon dioxide levels, whereas volcanoes return carbon to the atmosphere. This is the
dominant mechanism of control of carbon dioxide on timescales of millions of years.
Because the carbon cycle is essentially a closed system, any decrease in one reservoir of carbon leads to
an increase in others. For at least the last several hundred thousand years, up until the Industrial
Revolution, natural sources of carbon dioxide were in approximate balance with natural ‘sinks’,
producing relatively stable levels of atmospheric carbon dioxide. ‘Sinks’ are oceans, plants and soils,
which absorb more carbon dioxide than they emit (in contrast, carbon sources emit more than they
absorb).
INCREASES IN GREENHOUSE GASES DUE TO HUMAN ACTIVITIES
Carbon dioxide is being added to the atmosphere faster than it can be removed by other parts of the
carbon cycle.
Since the Industrial Revolution there has been a large increase in human activities such as fossil fuel
burning, land clearing and agriculture, which affect the release and uptake of carbon dioxide.
According to the most recent Emissions Overview, carbon dioxide and other greenhouse gases are
produced by the following activities or sources:
• stationary energy sources, such as coal-fired power stations (47 per cent)
• transport (18 per cent)
• coal mines (12 per cent)
• agriculture (11 per cent)
• land use (7 per cent)
• land change (3 per cent)
• waste (2 per cent).
Carbon dioxide released into the atmosphere from burning fossil fuels carries a different chemical
fingerprint from that released by natural sources such as respiration and volcanoes. This makes it
possible to identify the contribution of human activity to greenhouse gas production.Data collected show that the concentration of carbon dioxide in our atmosphere in 2013 was approximately 395 parts per million. The level of carbon dioxide in the Earth’s atmosphere is now higher than at any time over the past 800,000—and possibly 20 million—years. Global atmospheric concentrations of the other greenhouse gases (methane and nitrous oxide) also now exceed pre- industrial values. There is ever-increasing evidence that climate change is a physical reality. Scientific data shows that, despite the uncertainties, observable human induced climate change effects are emerging as a trend and arguments have shifted from disputing whether climate change is occurring to what the impacts might be and the extent of these impacts. Human-attributed changes to the composition of the atmosphere have begun to increase atmospheric and ocean temperatures, accelerate glacier and polar ice melt, alter the amount of precipitation, cause a rise in the sea levels, increase the likelihood of extreme weather events, induce shifts in timing of growing season and cause shifts in geographic distribution of natural species (Christensen et al., 2007 (IPCC-AR4), Cubasch et al., 2013 (IPCC-AR5); Seneviratne et al., 2012; Parmesan, 2006; Linderholm, 2006; Church and White, 2011). Increases in temperature and rainfall can also lead to direct (such as heat stroke, dehydration) and indirect (such as the spread or increase of infectious vector-borne diseases, water borne diseases or pathogens) health impacts. Africa is one of the most vulnerable continents to climate variability because of multiple stresses and low adaptive capacity (Meadows, 2006). Davis et al. (2010) indicates that by 2020 a large portion of Africa’s population will be exposed to increased water stress and yields from rain-fed agriculture could be substantially reduced in certain areas. These impacts will directly affect people’s livelihoods as well as their ability to adapt to climate change as the extent of the impact is linked to the local environmental conditions, the general health status of the community and the socio-economic status of the area. People living in informal settlements (which are densely populated, with high concentrations of poverty and limited access to employment and socio-economic services) are the most vulnerable, particularly to extreme events (flooding, drought, severe storms) and health (direct and indirect) impacts (Davis et al., 2010). The SA National Climate Change Response Strategy highlights South Africa’s vulnerabilities as being human health, maize production, plant biodiversity, water resources, rangelands and animal taxa. CLIMATE MODELLING Scientific evidence to date overwhelmingly indicates that anthropogenic induced climate change is a real phenomenon that is currently occurring, and is likely to gather momentum towards the middle of this century. Although the climate is known to vary gradually over time scales of thousands of years in response to solar radiative forcing, a reconstruction of the Earth’s climate for the past 2000 years has revealed an unprecedented change in the global mean surface temperatures over the last century (Brekke et al., 2009) and of atmospheric temperatures also that shows the Earth system is steadily heating, especially over the past few decades (Figure 5) (Trenberth et al., 2007).
FIGURE 5: GLOBAL COMBINED LAND SURFACE AIR TEMPERATURE ANOMALIES FOR 1850 TO 2006 RELATIVE TO THE
MEAN FROM 1961 TO 1990. THE 5 TO 95% ERROR BAR RANGES ARE DISPLAYED AS WELL AS THE DECADAL VARIATIONS
(BLUE LINE) (AFTER TRENBERTH ET AL., 2007).

Given some of the uncertainty in the projections, it is crucial that potential climate change impacts on
rainfall, be modelled for different emission and economic scenarios, at the appropriate spatial scales
(e.g. at the regional or local government scale) to inform decision making processes (Bates et al., 2008).

A variable-resolution atmospheric global circulation model (AGCM), the conformal-cubic atmospheric
model (CCAM), was thus utilised to simulate future climates over southern Africa for the 21st century.
The projections of six different coupled global circulation models (CGCMs) that contributed to
Assessment Four (AR4) of the IPCC were downscaled to high resolution over southern Africa (see
Engelbrecht et al. (2011) for a detailed description of the experimental design). The simulations spanned
the period 1961-2100 and were obtained for the A2 emission scenario of the Special Report on Emission
Scenarios (SRES). The model results yielded a few important findings that are crucial for any
consideration of future water resource management. The first is that maximum surface temperatures
over southern Africa are plausible to increase significantly towards the end of this century (Figure 6) –
this signal is robust across the ensemble of different downscalings. Daily maximum temperatures during
the summer half-year are projected to increase by more than 4oC over the northern parts of South
Africa including Gauteng, for the period 2071-2100 relative to the baseline period 1961-1990. These
increases are higher than the projected global increases and highlight the need for careful planning.
FIGURE 6: PROJECTED CHANGE IN MAXIMUM TEMPERATURE (°C) DURING THE SUMMER HALF-YEAR OVER SOUTH
AFRICA, FOR THE PERIOD 2071-2100 VS 1961-1990. THE DATA ARE AN ENSEMBLE AVERAGE OBTAINED FROM SIX
CGCM PROJECTIONS OF AR4 OF THE IPCC, ALL FOR THE A2 SRES SCENARIO.

Higher surface temperatures are likely to result in higher evaporation and evapotranspiration. Although
there are a complex set of mechanisms and regional feedback mechanisms that drive the
aforementioned, some studies have indicated that a 2O- 4OC change in surface temperature could
results in a reduction in runoff of between 4 - 12 % and 9 - 21 % respectively if precipitation stayed
constant (Nash and Gleick, 1993 and Miller and Yates 2006 ).

In addition to the increases in temperature, specific attention was given in this research to the predicted
changes in rainfall over the country for the same modelling period. Significant changes in rainfall totals
over parts of the southern African region (e.g. Engelbrecht (2011)) and the occurrence of extreme
precipitation events are projected to change under climate change (Fig. 4). Significant areas of change
are expected in the eastern parts of the country (Figure 4).
FIGURE 7: PROJECTED CHANGE IN THE ANNUAL FREQUENCY OF EXTREME RAINFALL EVENTS (DEFINED AS 20 MM OF RAIN
FALLING WITHIN 24 HOURS OVER AN AREA OF 0.5°X0.5°) OVER SOUTH AFRICA, FOR THE PERIOD 2071-2100 VS 1961-
1990 (UNITS ARE NUMBER OF EVENTS PER MODEL GRID BOX PER DAY). THE FIGURE SHOWS THE ENSEMBLE AVERAGE OF
THE SET OF DOWNSCALED PROJECTIONS, OBTAINED FROM SIX CGCM PROJECTIONS OF AR4 OF THE IPCC, ALL FOR THE
A2 SRES SCENARIO.

The ensemble-average projected change in the annual frequency of occurrence of extreme rainfall
events over South Africa shows the spatial patter of possible extreme rainfalls (Figure 7). An extreme
rainfall event is defined as 20 mm of rain falling within 24 hours over an area of 0.5° x 0.5°, that is, an
area of about 50x50 km2. Rainfall events of this magnitude rarely occur over the South African Highveld
(Dyson, 2010) and are likely to be associated with flooding over the region. A general increase in
extreme rainfall events is projected for South Africa – another robust message from the ensemble of
different projections obtained. Rainfall events are projected to increase over the mountainous regions
of eastern South Africa in particular - including Lesotho and the Highveld regions of Mpumalanga,
Gauteng and the Free State.

The increased surface temperature and the likelihood of more intense rainfall episodes possibly leading
to flooding and flash flooding has direct implications on the water resource management of local
governments. Associated management issues include: disaster management for especially floods but
also droughts, water storage and demand changes.
SUMMARY OF OBSERVED CLIMATE TRENDS FOR SOUTH AFRICA (1960 - 2012)
Over the last five decades the following climate trends have been observed in South Africa

            •   Mean annual temperatures have increased by approximately double the observed
                global average of
            •   0.7°C reported by the 4th Assessment Report of the Intergovernmental Panel on
                Climate Change (IPCC)
            •   Mean and maximum temperatures have been increasing less strongly, and some
                decreases in minimum
            •   Temperatures have been observed in the central interior.
            •   There have been significant overall increases in hot extremes and decreases in cold
                extremes particularly in the western and northern interior of the country.
            •   Rainfall seasonality has shifted and rainfall intensity has increased.
            •   In almost all hydrological zones there has been a reduction in rainfall for the autumn
                months
            •   Annual rainfall has not changed significantly, but, an overall reduction in the number of
                rainy days implies an increase in the intensity of rainfall events and increased dry spell
                duration

PROJECTED CLIMATE FUTURES FOR SOUTH AFRICA (2015 - 2035, 2040 – 2060                                 AND
2070 - 2090) IN THE EKURHULENI CONTEXT
Climate Change projections were assessed at a national level under both the unconstrained and
constrained pathways. The following climate scenarios were projected for unconstrained and
constrained emission pathways respectively

South Africa’s climate future up to 2050 and beyond can be described using four fundamental climate
scenarios at a national SCALE:

            1. Warmer (
3. hotter ( > 4°C above 1961 - 2000) and wetter with substantially greater frequency of
extreme rainfall events.
• Increased spring and summer
4. hotter ( > 4 ° C above 1961 - 2000) and drier, with a substantial increase in the
frequency of drought events and greater frequency of extreme rainfall events.
Reduced summer and spring and strongly reduced autumn
CLIMATE CHANGE IN THE CONTEXT OF THE EMM
Environmental factors driving vulnerability and their potential consequence for human settlements due to climate
change include:
• Increased temperatures: heat stress impacts on human health exacerbated by urban heat
islands; loss of productivity; declining air quality in cities; and increased demand for cooling.
• Extreme weather: heat waves and droughts – increased water demand, water quality problems,
heat-related deaths and reduced quality of life, food insecurity.
• Extreme weather: heavy rainfall and violent storms – water quality problems; deaths and
injuries, infections and water-borne disease; damage to infrastructure and economy, loss of
property.
An overview of the climate change scenario for the Ekurhuleni Metropolitan Municipality includes the analysis of
rainfall patterns, precipitation, average temperature changes, and humidity. The reasons for specifically looking at
these climatic variables is due to the fact that temperature is a basic climatological parameter which is used
frequently as an index of the energy status of the environment, whilst rainfall and humidity are general climatic
conditions.
The key documents which have been used for informing the climate change scenarios for the EMM are:
• Long Term adaptation Scenario (LTAS);
• South African Risk and Vulnerability Atlas (SARVA); and
• Climate Change and Adaptation Plan, City of Johannesburg, 2009 (used due to the close
geographical link with the EMM).
Based on the approach discussed above, the following table provides a summary of the estimated climate
change impacts that the EMM could be facing.Table: Estimated EMM Climate Change Factors
CLIMATE VARIABLE CURRENT CONDITIONS 2040 PREDICTIONS INCREASE
TEMPERATURE Annual Average Max 25°C (Summer) >+3°C
Temperature Min 17°C (Winter)
RAINFALL Annual Average 713mm 841mm
Rainfall
Summer 107mm 116mm
Autumn 53mm 64mm
Winter 6mm 7mm
Spring 72mm 94mm
EXTREME RAINFALL Heavy Rainfall Intensity +6.4% increase
HUMIDITY (for every Annual Average 30-50% 14% increase
1°C rise in temperature Humidity
the humidity will
increase by 7%)
ADDITIONAL Annual average 35°C +2.1°C increase in
number of extreme temperature
heat wavesIMPACTS AND VULNERABILITIES
IMPACTS
Climate change is already having a significant impact on ecosystems, economies and
communities.
The impacts of climate change within the Ekurhuleni region could be summarised as follows:
• Higher Temperature
• Reduction in average rainfall
• Increase in intensity and frequency of storm events
• Reduced water availability
• Strain on agricultural production
Rising average temperatures do not simply mean warmer winters. Some regions will experience
more extreme heat while others may cool slightly. Flooding, drought and intense summer heat
could result. Violent storms and other extreme weather events could also result from the
increased energy stored in our warming atmosphere.
One of the most serious impacts of climate change is how it will affect water resources around
the world. Water is intimately tied to other resource and social issues such as food supply,
health, industry, transportation and ecosystem integrity.
Climate change also threatens the health of our children and grandchildren through increased
disease, freshwater shortages, worsened smog and more. These impacts also pose incalculable
economic risks that far outweigh the economic risks of taking action today.
VULNERABILITY
Vulnerability to climate change has been defined as:
The degree to which a system is susceptible to, or unable to cope with, adverse effects of
climate change, including climate variability and extremes. Vulnerability is a function of the
character, magnitude, and rate of climate variation to which a system is exposed, its sensitivity,
and its adaptive capacity.
In the context of the city, the systems we are referring to are primarily municipal infrastructure,
vulnerable communities, biodiversity and service delivery functions of the city.
The importance of biophysical vulnerability is acknowledged as well. Many poor people are
directly dependent on ecosystems for their livelihoods. Indeed, biodiversity is the foundation
and mainstay of agriculture, forests and fisheries. Natural forests, freshwater and marine
ecosystems maintain a wide range of ecosystem goods and services, including the provisioningand regulation of water flows and quality, timber and fisheries. The “poorest of the poor” are,
often, especially dependent on these goods and services. For these groups, biophysical
vulnerability means human and/or livelihood vulnerability.
Exposure to climate variation is primarily a function of geography. For example, coastal
communities will have higher exposure to sea level rise and cyclones, while communities in
semi-arid areas may be most exposed to drought.
EFFECTS OF CLIMATE CHANGE RELATED TO REGION WITHIN THE EKURHULENI REGION
DROUGHT AND WATER SCARCITY
The term drought may refer to meteorological drought (precipitation well below average), hydrological
drought (low river flows and water levels in rivers, lakes and groundwater), agricultural drought (low soil
moisture), and environmental drought (a combination of the above). The socio-economic impacts of
droughts may arise from the interaction between natural conditions and human factors, such as changes
in land use and land cover, water demand and use. Excessive water withdrawals can exacerbate the
impact of drought.
IPCC Working Group II noted that, in Africa, “by 2020, between 75 million and 250 million people are
projected to be exposed to an increase of water stress due to climate change” (Adger, Aggarwal,
Agrawala et al., 2007) (high confidence). In Asia, “Freshwater availability in Central, South, East and
Southeast Asia, particularly in large river ba sins, is projected to decrease due to climate change which,
along with population growth and increasing demands arising from higher standards of living, could
adversely affect more than a billion peopleby the 2050s” . Any reductionin the availability of freshwater
resources caused by climate change will be particularly problematic forthose who live in areas already
suffering water scarcityor water stress – with poorer groups likely to be most affected (Romero Lankao,
2006).
Many cities and their water catchments will get less precipitation (and have more constrained fresh
water sources) – which is particularly problematic for growing cities and large cities already facing
serious problems obtaining sufficient fresh water supplies. At least 14 African nations are already facing
water stress or water scarcity and many more are likely to join this list in the next 10 to 20 years (Muller
2007). There is already a failure to manage water resources well in much of this region, independent of
climate change – where around half the urban population already lacks adequate provision for water
and sanitation, although this is linked far more to inadequate governance than to water shortages.
FLOODING
Urban areas always present some risk of flooding when rainfall occurs. Buildings, roads, infrastructure
and other paved areas prevent rainfall from infiltrating into the soil – and so produce more runoff.
Heavy and/or prolonged rainfall produces very large volumes of surface water in any city, which can
easily overwhelm drainage systems. In well-governed cities, this is rarely a problem because goodprovision for storm and surface drainage is easily built into the urban fabric, with complementary measures to protect against flooding – for instance the use of parks and other areas of open space to accommodate floodwaters safely from unusually serious storms. In most cities, there is also scope for land-use management and incremental adjustments to increase flood-water management capacity. But in poorly-governed cities, this does not happen. Most residential areas have no drainage system installed and rely on natural drainage channels - and it is common for buildings or infrastructure to be constructed that actually obstructs these drainage channels. In many areas in Ekurhuleni, a signify cant proportion of the population is not served by adequate solid-waste collection services. In neighbour hoods with inadequate solid-waste management or drain maintenance, garbage and plant growth can quickly clog drains, leading to localized flooding with even light rainfall. There is also a growing documentation on the inadequacies in drainage and flood protection for urban centres in Africa and Asia and of the trend towards increased numbers of deaths and injuries from flooding in urban areas. Floods are already having very large impacts on cities and smaller urban centres. HEAT WAVES Cities such as Ekurhuleni will experience more heat waves. Even small increases in average temperature can result in large shifts in the frequency of extremes (Kovats and Aktar 2008). For larger, higher density cities, the temperatures in central “heat islands” can be several degrees higher than in surrounding areas; in tropical cities, the temperature difference can reach 10 degrees by the end of the night (ibid). Many cities will face more problems with certain air pollutants as concentrations of air pollutants change in response to climate change because a portion of their formation depends, in part, on temperature and humidity. This has particular importance for Asia and Latin America, which have most of the cities with the highest levels of air pollution. There is less information on the impacts of heat stress in Africa or Latin America but studies undertaken in North America, Asia and Europe found that heat waves are associated with marked short-term increases in mortality (Confalonieri et al., 2007). The European heat wave of 2003 claimed 20,000 lives, mostly among the poor and isolated elderly. In Andhra Pradesh, India, a heat wave killed more than 1,000 people – mostly labourers working outside in high temperatures in smaller urban settlements (Revi, 2008). In regard to urban heat islands, higher temper atures occur in urban areas than in outlying rural areas because of diurnal cycles of absorption and late r re-radiation of solar energy and (to a much lesser extent) heat generation from built/paved physical structures. These increase the frequency and severity of heat-stress events in cities and can affect the health, labour productivity and leisure activities of the urban population. There are also economic effects, such as the additional cost of climate-control within buildings, and environmental effects, such as the formation of smog in cities and the degradation of green spaces – and increased greenhouse gases if additional demand for cooling is met with electricity generated from fossil fuels. There is some evidence that the combined effects of heat stress (e.g. urban heat-island effects) and air pollution may be greater than the simple additive effects of the two stresses (Patz and Balbus, 2003). There are again different vulnerabilities to the health impacts of climate-related extremes and air
pollution within urban areas. Local factors, such as climate, topography, heat-island magnitude, income,
access to health services and the proportion of elderly people, are important in determining the
underlying temperature–mortality relationship in a population (Curriero et al., 2002).

BUSHFIRES
According to research, the risk of bushfire is likely to increase by up to 50 per cent. With climate change,
these conditions are projected to increase, resulting in a 10 to 50 per cent rise in the frequency of days
with a very high to extreme risk of bushfire. The report also expects the fire season to be extended in
most regions, although before the extent of the increase can be predicted further research is needed
into the El Niño weather cycle, ignition rates, fuel accumulation, and moisture and carbon dioxide levels.

BIODIVERSITY
Climate change is emerging as a serious threat to native species and ecosystems and is expected to be
an on-going challenge to the effective conservation of these assets.

Rising temperatures and flooding/drought, as well as climate-induced changes in fire regimes, water
quality and ocean chemistry, will have wide-ranging impacts on biodiversity and will intensify existing
threats such as habitat loss, weeds, pest animals and drought.

Species that have survived previous climatic shifts by evolving, moving or modifying their behaviour may
find it more difficult to use these coping strategies when the change is rapid, especially if their habitat is
degraded or lost.

The most vulnerable ecosystems include those that are coastal, alpine, rainforest or fragmented
terrestrial, or those that are in areas vulnerable to fire or low freshwater availability.

Species that could become endangered or extinct include those living near the upper limits of their
temperature range (for example, in alpine regions); those with restricted climatic niches; and those that
cannot migrate to new habitats because of habitat fragmentation or lack of alternatives. For those
species capable of dispersal, action is required to ensure that there is sufficient remnant habitat, that
invasive species are controlled, and that links (including dispersal vectors) exist between habitats.
You can also read