Lake Vänern REGIONAL REPORT // - ESPON
←
→
Page content transcription
If your browser does not render page correctly, please read the page content below
REGIONAL REPORT //
Lake Vänern
Inner periphery seeking a new start
Annex to synthesis report // April 2021
This Regional Report is conducted within the framework of the ESPON 2020 Cooperation
Programme, partly financed by the European Regional Development Fund.

The ESPON EGTC is the Single Beneficiary of the ESPON 2020 Cooperation Programme. The
Single Operation within the programme is implemented by the ESPON EGTC and co-financed
by the European Regional Development Fund, the EU Member States and the Partner States,
Iceland, Liechtenstein, Norway and Switzerland.

This delivery does not necessarily reflect the opinions of members of the ESPON 2020
Monitoring Committee.

Authors
Erik Gløersen

Acknowledgements
Click or tap here to enter text.

Information on ESPON and its projects can be found at www.espon.eu.
The website provides the possibility to download and examine the most recent documents
produced by finalised and ongoing ESPON projects.

© ESPON, 2021

Graphic design by BGRAPHIC, Denmark

Printing, reproduction or quotation is authorised provided the source is acknowledged and a
copy is forwarded to the ESPON EGTC in Luxembourg.

Contact: info@espon.eu
REGIONAL REPORT //
Lake Vänern
Inner periphery seeking a new start
Annex to synthesis report // April 2021

Disclaimer

This document is a interim report.

The information contained herein is subject to change and does not
commit the ESPON EGTC and the countries participating in the
ESPON 2020 Cooperation Programme.

The final version of the report will be published as soon as approved.
REGIONAL REPORT // Lake Vänern

Table of contents
Abbreviations ......................................................................................................................................7

1               Introduction ........................................................................................................................8
2               Territorial analysis: the lake and its surroundings .......................................................11
2.1             Water quality ............................................................................................................................. 11
2.2             Ecosystem and biodiversity protection ...................................................................................... 14
2.3             Social and economic situation in the lake region ...................................................................... 17
2.4             Tourism and cultural / natural heritage ...................................................................................... 28
2.5             Agriculture, fisheries and food production ................................................................................. 31
2.6             Energy production ..................................................................................................................... 33
2.7             Spatial planning and development of transport ......................................................................... 35

3               Governance in the lake region ........................................................................................45
3.1             Actors involved in lake-based governance ................................................................................ 45
3.1.1           Main levels of governance in Sweden....................................................................................... 45
3.1.2           Cooperation organisations and networks focusing on Lake Vänern ......................................... 46
3.2             Governance of major lake-related issues .................................................................................. 50
3.2.1           Regulation of lake water level ................................................................................................... 50
3.2.2           Maritime transport ..................................................................................................................... 52
3.2.3           Tourism ..................................................................................................................................... 53
3.2.4           Water management .................................................................................................................. 54
3.2.5           Fisheries ................................................................................................................................... 57
3.3             Cross-sectoral and multi-level interplay .................................................................................... 58
3.4             Main trends in adaptive capacity, resilience, learning ............................................................. 60

4               Concluding remarks SWOT analysis of the lake region...............................................62

References .........................................................................................................................................64

Annex 1 Syntheses of Regional strategies ........ from 2021 onwards for Västra Götaland and
         Värmland                    67

                                                                                                                                ESPON // espon.eu                  5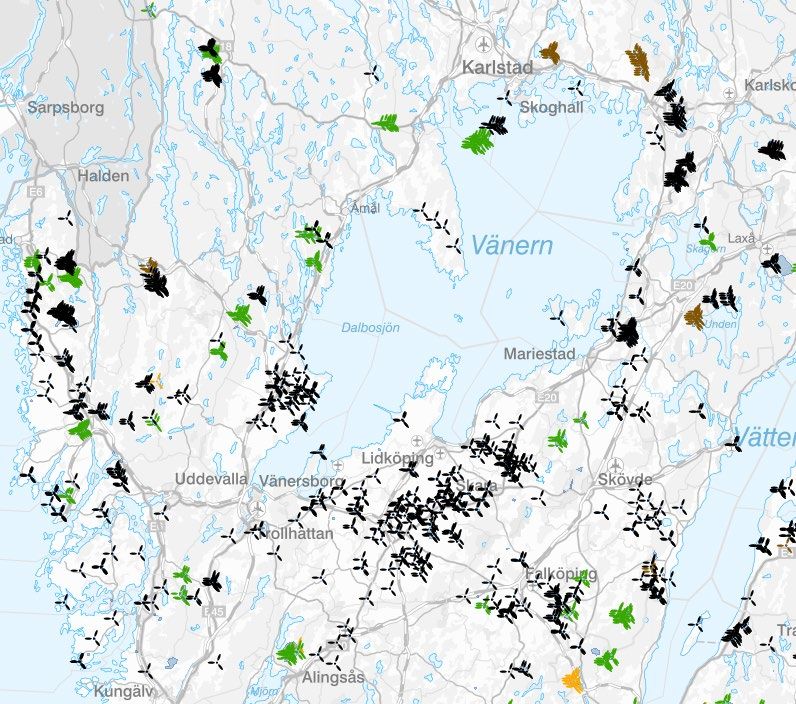
REGIONAL REPORT // Lake Vänern

List of maps, figures, charts and tables
List of maps
Map 1 Lake Vänern overview map............................................................................................................... 9
Map 2 Ecological status of Lake Vänern sub-areas ................................................................................... 13
Map 3 Protected areas around lake Vänern .............................................................................................. 15
Map 4 Ranking of labour market areas in Sweden (2016) ......................................................................... 21
Map 5 Labour Market Areas around Lake Vänern ..................................................................................... 22
Map 6 Population change around Lake Vänern .......................................................................................... 23
Map 7 Seniors and population change around Lake Vänern ...................................................................... 24
Map 8 Young peoples and population change around Lake Vänern........................................................... 25
Map 9 Synthesis of age structures and population change around Lake Vänern ....................................... 26
Map 10 Municipal gross product around Lake Vänern ............................................................................... 27
Map 11 Number of guest nights per municipality – 2019 and 2020 ........................................................... 29
Map 12 Touristic accommodations around Lake Vänern ............................................................................ 30
Map 13 Examples of land use patterns around Lake Vänern .................................................................... 37
Map 14 Extension of settlement areas between 1990 and 2018 ................................................................ 38
Map 15 Urbanisation around Lake Vänern ................................................................................................ 39
Map 16 Naturally vegetated areas and green urban areas around Lake Vänern ........................................ 40
Map 17 Agricultural areas around lake Vänern ........................................................................................... 41
Map 18 Transportation axes in Lake Vänern Region .................................................................................. 43
Map 19 Ten-T core inland waterways and freight traffic on Vänern and Göta river ................................... 44
Map 20 ‘Water Districts’ and ‘Water management associations’ ................................................................ 56

List of figures
Figure 1 Bays with overfertilization issues in Lake Vänern ......................................................................... 11
Figure 2 Gullspång river salmon ladder ...................................................................................................... 16
Figure 3 Lakes and canals connecting the Baltic Sea to the Kattegat Sea ................................................. 28
Figure 4 Volume of fish caught in Lake Vänern between 2011 and 2019, by species, in metric tons ......... 32
Figure 5 Value of first sale of fish caught in Lake Vänern by species - 2011-2019, in thousand SEK ........ 32
Figure 6 Wind energy in and around Lake Vänern..................................................................................... 34
Figure 7 SWOT of Lake Vänern, summarising the findings from previous sections.................................... 63

List of tables
Table 1 Key demographic data for Väner municipalities ............................................................................ 17
Table 2 Settlement populations.................................................................................................................. 18
Table 3 Employment per sector in Lake Vänern municipalities .................................................................. 20
Table 4 Wind power production .................................................................................................................. 34
Table 5 Estimated costs of a ‘100 year flood’ and ‘design flood’ (million euros, 2007) .............................. 61

6    ESPON // espon.eu
REGIONAL REPORT // Lake Vänern

Abbreviations
BCE     Before Common Era

CC-BY   Creative Commons Attribution License

COVID   Coronavirus Disease

EAFRD   European Agricultural Fund for Regional development

EMFF    European Maritime and Fisheries Fund

EU      European Union

FLAG    Fisheries Local Action group

GDP     Gross Domestic Product

MWh     Mega Watt hours

NUTS    Common classification of territorial units for statistics

PFAS    Per- and polyfluoroalkyl substances

PFOS    Perfluorooc-tanesulfonic acid

RBPR    River Basin Management Plan

SEK     Swedish Kroner

TEN     Trans European Network

TWh     Tera Watt hours

                                                                             ESPON // espon.eu       7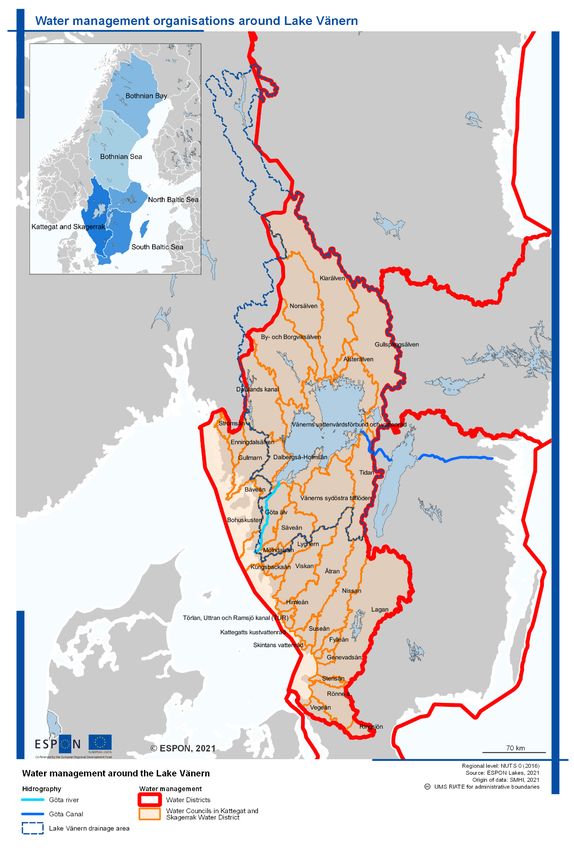
REGIONAL REPORT // Lake Vänern

1 Introduction
Vänern is the largest lake of the European Union, and the third largest lake in Europe with an area of
5,650 km2. Its river basin area covers an area of 46,800 km2 (i.e. more than 10% of Sweden).
It is drained into the Kattegat through Göta river, which is 93 km long and includes a dam, canal locks and
a hydropower station. The combined river basin area of Vänern and Göta River is 50,230 km2. The Lake is
located approximately 44 meters above sea level.

Lake Vänern belongs to two regions: To the north, the Värmland region of which the capital city, Karlstad,
is located right on the lake. Värmland is an inland region, in which the wood and packaging industries have
traditionally played a major role, alongside with the steel industry and mechanical engineering. Karlstad is
also located on the main axis between Stockholm and Oslo. Strengthening relations with the Oslo metro-
politan region is one of the privileged strategic development perspectives. (Region Värmland, 2014)

The southern part of Lake Vänern belongs to the Västra Götaland region, whose capital Gothenburg is
located around 1h15 by road from the southern tip of the Lake. Västra Götaland is a coastal region, with a
number of globally competitive industries, a well-development R&D&I sector, long traditions in the fields of
trade and logistics and a strong maritime cluster. The Trollhättan-Vänersborg-Uddevalla area, which is one
of the four urban core areas of the region, borders the Lake.

Compared to Värmland, Västra Götaland population is 6 times larger (1,7 million inhabitants against
280,000 for Värmland), and GDP 8 times larger (around 80 billion EUR, against just over 10 billion EUR for
Värmland).

The south-western shores of the Lake, which belong to the administrative region of Västra Götaland, were
historically part of the province of Dalsland. Historical provinces remain an important component of Swe-
dish territorial identities. There are also separate tourism promotion organisations for Dalsland.

The 13 municipalities bordering Lake Vänern established an economic association (“The Vänern Coopera-
tion”) as a framework for dialogue and cooperation on joint issues and development objectives in 2015.
These municipalities have populations that range from 5,300 inhabitants (Gullspang) to 90,000 inhabitants
(Karlstad). Population growth between 2011 and 2017 was highest (around 5%) around the cities of Karls-
tad and Vänersborg, 3-4% in the towns Lidköping, Åmål and Kristinehamn, 2% in Mariestad in lower in all
other municipalities. Statistics Sweden considers that these 13 municipalities belong to 4 different labour
market areas, respectively centred on Karlstad (west and north of the Lake), Skövde (east of the Lake),
Lidöping (south-east of the Lake) and Trollhättan-Vänersborg (south-west of the Lake). Two of the labour
market centres (Skövde and Trollhättan) are not located directly on the Lake. 1

The Lake Vänern economy is characterised by:
    -   Significant freight traffic, with between 1.5 and 2 million tons transported on the Lake on a yearly
        basis 2.
    -   A number tourism and leisure development opportunities. Actors around the Lake currently con-
        sider that it is “relatively unknown as a tourism destination within Sweden and Abroad” (Vänersa-
        marbetet, 2017)
    -   Significant fisheries activities. The total first resale value of catches in 2019 was around 3,5 mil-
        lion EUR.

1
 https://www.scb.se/hitta-statistik/statistik-efter-amne/arbetsmarknad/sysselsattning-forvarvsarbete-och-
arbetstider/registerbaserad-arbetsmarknadsstatistik-rams/produktrelaterat/Fordjupad-information/lokala-
arbetsmarknader-la/
2
    https://www.lakevanern.se/livet-vid-vanern/sjofart/

8      ESPON // espon.eu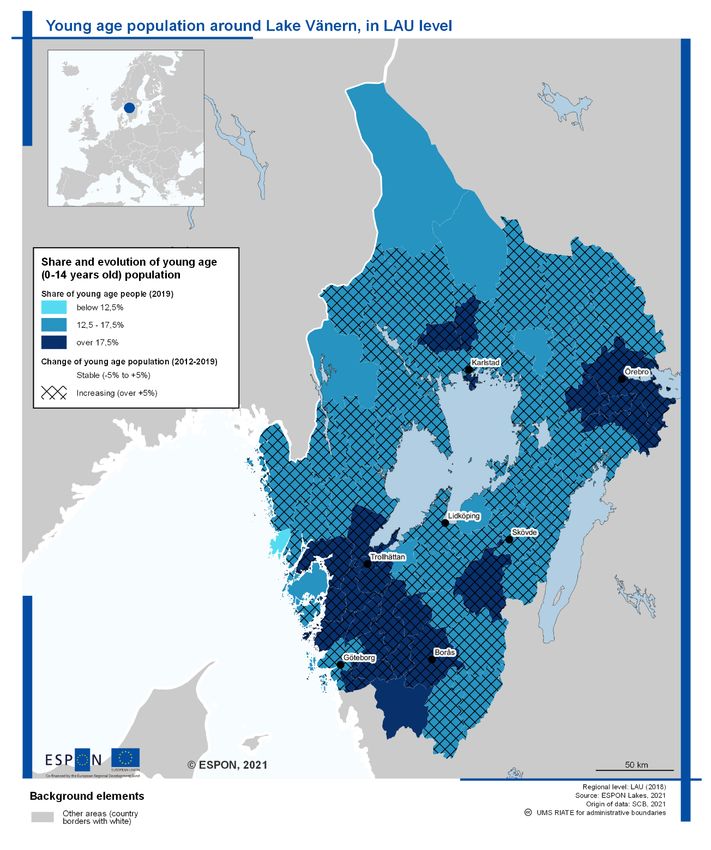
REGIONAL REPORT // Lake Vänern

Map 1 Lake Vänern overview map

                                          ESPON // espon.eu       9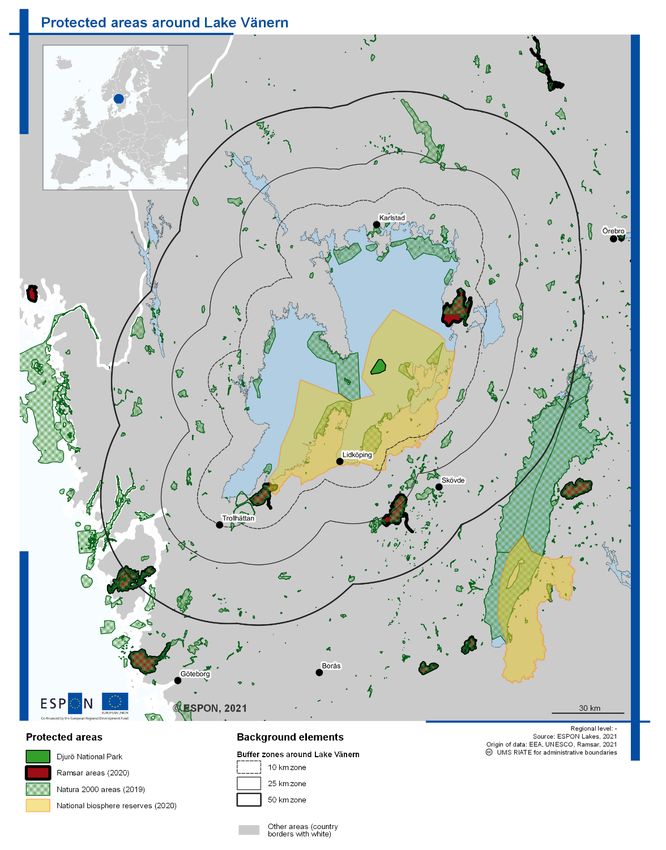
REGIONAL REPORT // Lake Vänern

The regulation of the water level of Lake Vänern is a key issue, which affect a number of sectors (Eklund
et al., 2018) :
     -    Agriculture: farmers wish to keep fields dry
     -    Inland waterway traffic is affected by low water levels
     -    Electricity producers wish to use water reserves to optimise national production (e.g. to meet
          peak energy demand) on Göta river, downstream from Lake Vänern
     -    Spatial planning: Extensive housing areas around Lake Vänern are exposed to flooding. A major
          flood occurred between November 2000 and June 2001, with a peak on 11th January 2001
     -    Environmental policy: Insufficient variations of water levels lead to bush encroachment and the
          disappearance of unique biotopes and open landscapes that were until recently characteristic of
          Lake Vänern.

The “Väner Council” is a network of public and private actors established to better address the complex
issue of water level regulation. These actors have signed an agreement to promote cooperation and con-
tribute to exchange of knowledge and experience. They also commit to assess the impact of their current
or planned activities on the Väner lake, and to explore how their activities could contribute to a long-term
sustainable regulation of the water in Vänern.

10   ESPON // espon.eu
REGIONAL REPORT // Lake Vänern
2 Territorial analysis: the lake and its
surroundings
2.1 Water quality
Lake Vänern drainage basin extends north and south of the Lake. It includes numerous tributaries: 13
different rivers are surveyed by the Vänern Water management association. Göta river is the only emis-
sary, (see Map 1).
Chemical status of the lake
The water quality in Lake Vänern is generally good and has improved significantly since the 1970s. A 2007
report states that drinking water extracted from Lake Vänern would meet most quality criteria without any
treatment (Vänern secretariate, 2007). Overfertilization and higher bacteria levels are observed in some
shallow, closed bays, for example after abundant rainfalls (see Figure 1). Nitrogen levels are high. While
they have not generated major issues in the ake, nitrogen emissions from Lake Vänern and Göta river
correspond to 60% of inflows of nitrogen in the Skagerrak sea. It is therefore necessary to reduce nitrogen
emissions (Västerhavets vattendistrikt, 2020). Phosphorous levels are low in central parts of the lake, but
are an issue in some bays. In these areas, eutrophication, algae blooming and overgrowth of weeds can
be an issues (Vänern water management association, 2006). Surveillance of nitrogen, phosphor and or-
ganic material levels in tributary rivers showed that concentration of nitrogen increased in 2019, as a result
of higher water discharge. However, levels of organic matter in tributary rivers stabilised or decreased after
some years of steady increase. (Sonesten, 2019)
Figure 1 Bays with overfertilization issues in Lake Vänern
Source: Vänern water management association (2016)
Drinking water quality
Lake Vänern and Göta river supply more than 800,000 persons with drinking water. There are currently 10
water works around the Lake. The air force base in Skaraborg also draws it water from the lake. An addi-
tional water work is being built in Trollhätten south of Vänern, drawing water from a pipe stretching into the
ESPON // espon.eu 11REGIONAL REPORT // Lake Vänern
lake. This water work is expected to be operational in 2026 3. In 2016, these water works produced around
62,500 cubic meters of drinking water per day. The risk analysis points out that, as a result of the large
volume of water in Lake Vänern, the suitability of extracted drinking water could be affected either by large
scale events, or by events in the immediate vicinity of water works. (Peilot, Olsen, et al., 2020; SWECO,
2016).
Drinking water is protected by establishing so called ‘Water protection areas. This is done by the County
Administrative Board and the concerned municipality, based on guidance by the Swedish Agency for Ma-
rine and Water Management. This guidance was updated in 2021 (Swedish Agency for Marine and Water
Management, 2021). It emphasizes that each water protection area must take into account preconditions
in each area. Contrary to the previous ‘handbook on water protection areas’ (Swedish environmental pro-
tection agency, 2010), there are no general recommendations on the types of provisions to be included.
Instead, the guidance focuses on the method and steps to be followed in the process of identification of
protection needs, assessment of risks, delineation and definition of regulatory provisions. It also empha-
sises that procedures to ensure that all provisions are effectively abided by must be clear and realistic. The
largest such areas can be found in the vicinity of Karlstad. The ‘Kattfjorden’ water protection area covers
64 km2 on land, and 55 km2 on water. The area is protected is four subzones, with different types of re-
strictions on activities.
Bathing water quality (current status and recent evolution)
Bathing water quality is mostly good. Out of 3,000 measurements carried out between 2010 and 2020, 88
indicated that the bathing water was of insufficient quality, and 263 led to reinforced controls. Few algae
blooming episodes have occurred in bathing areas: 2 in 2018, 3 in 2019 and none in 2020 (Peilot, Larsson,
et al., 2020)
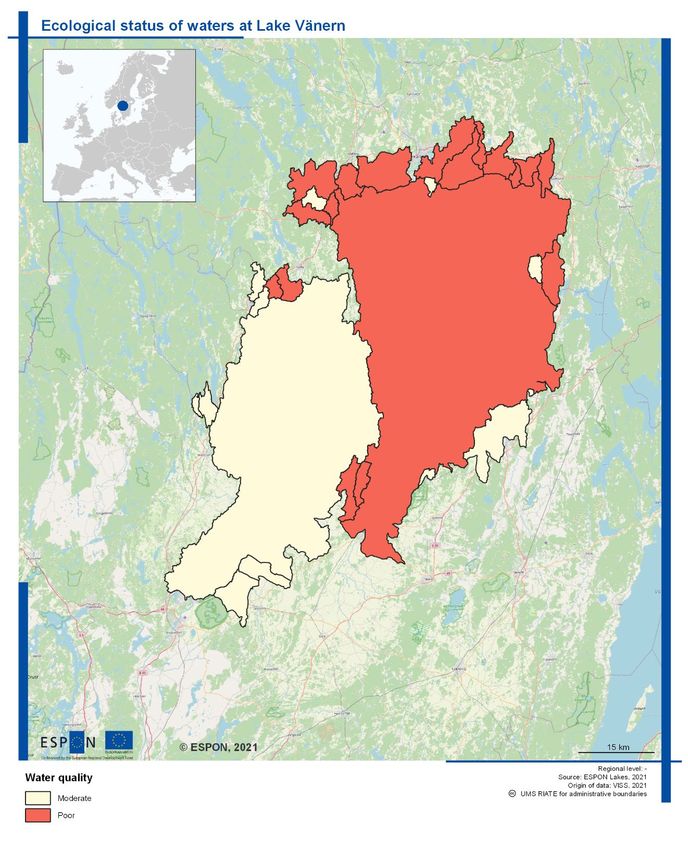
Ecological status
The ecological status of Lake Vänern is characterised as ‘moderate’ in the western part (so-called ‘Dalbo
Lake’), and unsatisfactory in the eastern part (so-called ‘Värmland Lake’) (see Map 2). This is mainly a
result of the regulation of the water levels, which has a detrimental effect on the hydrological regime. The
ecological status is also negatively affected by obstacles to migration of fishes to between different habi-
tats, e.g. for spawning and rearing (i.e. numerous small-scale hydroelectric production areas). In addition,
some tributaries and bays are affected by excessive inflows of fertilizers and other organic materials.
Because the large extent and structure of Lake Vänern, the River Basin Management Plan (RBMP) sepa-
rates it into 27 different water bodies. These are monitored separately, as illustrated in Map 2.
In the Kattegat and Skagerrak Water District (see Map 21 p. 56), 78% of the 2,537 natural surface waters
had worse than good ecological status between 2010 and 2016 (“2nd monitoring cycle”). When it comes
to lakes and watercourses, physical impact and acidification were the main reason for which good ecologi-
cal status was not achieved. Comparing the ecological status classifications of water bodies that wee mon-
itored in both 2009 and 2014, 770 waterbodies have changed from good to moderate status, while only 69
have changed in the other direction, ie., from moderate to good ecological status.
Lake Vänern showed similar pattern: while 11 of the 27 water bodies were in good condition between 2004
and 2009 (“1st monitoring cycle”), between 2010 and 2016 (“2nd monitoring cycle”) and 2017 and 2021 (3rd
monitoring cycle”) all of them showed moderate or poor status (Map 2). This is mostly due to a deteriori-
ation of hydromorphological conditions.
A contributing factor to this deterioration in status can be the new assessment criteria for hydromorphology
which provides a clearer picture of effects on ecosystems, indicating greater problems than previous as-
sessments. However, 2014 figures were based on a better database, primarily with respect to biological
3
https://www.trollhattanenergi.se/projekt/forberedelser-for-ett-nytt-vattenverk-pagar-for-fullt/
12 ESPON // espon.euREGIONAL REPORT // Lake Vänern
parameters, and the methodology for status classification has also been further developed. Thus, the dif-
ferences between 2009 and 2014 could rather be an effect of better knowledge and methods than a dete-
rioration of the environment. Available data for 2017-2021 (“3rd monitoring cycle”) suggest that not only
the hydromorphological elements are deteriorating, but also the biological quality element “fish fauna”.
Map 2 Ecological status of Lake Vänern sub-areas
ESPON // espon.eu 13REGIONAL REPORT // Lake Vänern
2.2 Ecosystem and biodiversity protection
Specific types of ecosystems and landscapes around the lake
Lake Vänern is traditionally surrounded by open, “sea-like” landscapes as a result of variations of lake
levels that limited vegetation along the shoreline and on skerries. These open landscapes, with areas that
are flooded regularly, host a number of specific biotopes. Shallow parts of the lake during seasonal floods
constitute important spawning areas for some fish species.
As a result of stricter regulation of water levels, fewer periods with ice on the lake, changes in permanent
meadow maintenance practices (or absence of maintenance), reduce pasture and mowing and excessive
use of fertilizers, on observes that following changes:
- Bush encroachment accelerates in shoreline areas, especially in bays;
- Small trees have grown in a number of new areas along the shoreline, especially between 2000
and 2014. The extent of areas affected by this type of growth has stabilised since 2014;
- Trees reach a medium-sized height in a growing number of areas, especially in the immediate vi-
cinity of the lake. However, the number of trees above 5 meters has not changed;
- The extent of heathlands and reeds is decreasing since 2009;
- The extent of areas with entirely unvegetated sand is decreasing.
Many of the approximately 270 threatened species around Vänern, including birds and fishes, are affected
by these changes. (Peilot, Larsson, et al., 2020)
Protected areas
A number of different types of protected areas can be found around Lake Vänern (see Map 3)
- Djurö national park was established in 1991 to preserve a Lake Vänern skerry landscape. It is
composed of around 30 islands, with a rich birdlife.
- A number of nature reserves focusing on groups of islets (‘skerries’), wetland or islands on the
lake. Most of these nature reserves on the lake are also Natura 2000 areas under the EU Birds
Directive of 1979 and the EU habitats directive of 1992. A few Natura 2000 areas are note nature
reserves (e.g. the Klarälv river delta close to Kalrstad, the Ölmeviken bay close to Kristinehamn).
The number of nature reserves focusing on groups of islets (‘skerries’), wetland or islands on the
lake has progressively increased over the last 4 decades. However, areas added since 2000 tend
to be smaller. One may for example mention:
o Lurö skerries (established 1967)
o Nötön-Åråsviken (established 1971)
o Segerstad Skerries (established 1979)
o Värmland skerries (established 1980)
o Millesviks skerries (established 1983)
o Kalvö skerries (established 1987)
o Brommö skerries (established 1987)
o Tösse skerries (established 1999)
o Vänersnev skerries (established 2004)
o Onsö (established 2005)
o Dyrön (established 2006)
- Some nature reserves organised around mainland areas around the lake, mainly around Lidkö-
ping and Vänerborg e.g.:
o Kinnekulle hill (established 1982)
o Halle- Hunnebergs plateaus (established 1982)
o Varan (established 2013)
14 ESPON // espon.euREGIONAL REPORT // Lake Vänern
o Hindens rev peninsula (established 1986)
Some of these protected areas, e.g. Ölmeviken Natura 2000 area close to Kristinehamn and Åråsviken
Nature reserve and Natura 2000 area in Gullspång municipality are concerned by overfertilization. The
conservation plans for Ölmeviken makes reference to efforts made to address this issue, e.g. through the
“Focus on Nutrients” (‘Greppa näringen’) national programme which is a joint venture between the Swe-
dish Board of Agriculture, the County Administration Boards, the Federation of Swedish Farmers and a
number of companies in the farming business 4. (Värmland County Adminsitrative Board, 2015)
Map 3 Protected areas around lake Vänern
4
https://greppa.nu/om-greppa-naringen/in-english
ESPON // espon.eu 15REGIONAL REPORT // Lake Vänern
Preservation of salmon and trout populations
In addition, a key issue for Lake Vänern is connectivity between habitats. Particular focus has been given
to salmon populations. Lake Vänern hosts the two only remaining populations of salmon that do not mi-
grate to saltwater in Europe (‘Gullspång salmon’ and ‘Klarälv salmon’). These salmons historically stem
from the Baltic Sea, but postglacial rebound 5 closed migration routes around 7,500-8,000 BCE. These
salmon populations have decreased significantly as a result of the construction of hydroelectric dams in
the Gullspång and Klarälv rivers. A project was implemented between 2003 and 2008 to address this is-
sue, as a cooperation between the County Administrative Board of Värmland, the electricity producer For-
tum, the municipality of Gullspång and the Vänern Lax foundation. This project included a modification of
the regulation of the water regime in Gullspång river at the Power Station, so as to increase the water flow
in the summer months, with a minimal flow of 3 m3/s is the Gullspång waterfall. Furthermore, the Gull-
spång river nature reserve was created. This reserve stretches from Lake Vänern to the power station
dam. Finally, a salmon ladder was built to allow salmons to reach their spawning area more easily. Follow-
up measures are foreseen, as the salmon population remains limited. 6
Figure 2 Gullspång river salmon ladder
Source: Per Henriksson, Wikimedia Commons (public domain)
The Klarälv salmon population has been supported since the 1930s by trapping it and transporting it by
truck 70 km upstream, beyond the dams. Additional measures to improve connectivity between biotopes
5
i.e. the rise of landmasses after the removal of the weight of ice sheets that covered parts of Europe during last glacial
period (115,000 – 11,700 BCE).
6
https://gullspang.se/Gullspangs-kommun/Miljo--avfall/Naturvard/Gullspangslaxen
16 ESPON // espon.euREGIONAL REPORT // Lake Vänern
are needed 7. A Foundation has been set up by municipalities and county administrative boards around
Vänern to improve salmon and trout fishing, e.g. by releasing smolt 8.
Biosphere reserve
Lake Vänern hosts one of Sweden’s seven biosphere reserves. The Lake Vänern Biosphere Reserve,
known in Swedish as ‘Väner skerries and Kinnekulle’ covers the southeast part of the lake and extends
across the municipalities of Götene, Lidköping and Mariestad. Kinnekulle is a 306 m high hill in the imme-
diate vicinity of the Lake and a well-established tourism destination. Thanks to a calcareous bedrock, it has
a particularly rich fauna and flora and has hosted stone quarries since the Middle Ages. The last quarry
was closed in 1970, and the cement factory of Hällekis in 1978. They have respectively been transformed
into a working life museum and an artificial lake. The biosphere area also includes the skerries of Kålland
peninsula and Island (‘Kålanndsö), known inter alia for the castle of Näckö and the fishery harbour of
Spiken.
2.3 Social and economic situation in the lake region
Lake Vänern municipalities have a total population (2019) of 311,000 inhabitants, and an average popula-
tion density of 41,4 inh./km2. Population in the area as a whole has been growing over the last two dec-
ades, and this growth seems to accelerate since 2011. Urban polarisation is increasing, as most of the
smallest municipalities have a stable or declining population. Population growth is particularly strong in
Karlstad (+16,3% between 2001 and 2019). More than half the population lives in settlements of more than
10,000 inhabitants (162,600 inhabitants) and 70% in settlements of more than 2,000 inhabitant, and 80%
in settlements of more than 200 inhabitants. A significant share of the population, 20%, therefore lives
outside of settlements. These rates of population living outside of settlements of more than 200 inhabitants
vary between 46% in Grästorp and 10% in Karlstad.
Table 1 Key demographic data for Väner municipalities
Municipali- Population Population Popu- Total area Population in
ty change lation (km2) settlements > 200
densi- inh.
2001 2011 2019 2001- 2011- ty 2005 2018
2019 2019 2019
(inh./
km2)
Karlstad 80,748 86,409 93,898 16,3% 8,7% 80,4 1,168,47 89,2% 90,0%
Lidköping 36,808 38,183 40,089 8,9% 5,0% 57,4 698,60 75,4% 76,8%
Vänersborg 36,795 36,962 39,591 7,6% 7,1% 61,5 643,94 79,0% 81,2%
Mariestad 23,725 23,732 24,537 3,4% 3,4% 40,7 602,40 75,6% 77,5%
Kristine- 23,969 23,698 24,255 1,2% 2,4% 32,1 755,29 81,8% 83,8%
hamn
Hammarö 14,121 14,943 16,568 17,3% 10,9% 278,7 59,45 91,0% 93,3%
Säffle 16,428 15,394 15,455 -5,9% 0,4% 12,7 1,221,34 63,5% 65,1%
Götene 12,970 13,134 13,207 1,8% 0,6% 32,6 404,55 61,0% 63,3%
Åmål 12,770 12,226 12,610 -1,3% 3,1% 26,2 480,98 79,1% 80,0%
Mellerud 9,781 9,068 9,310 -4,8% 2,7% 18,1 513,72 56,4% 59,5%
7
https://www.sverigesvattenmiljo.se/content/klaralvslaxen-unik-men-nastan-bortglomd
8
https://www.laxfondvanern.se/en/
ESPON // espon.eu 17REGIONAL REPORT // Lake Vänern
Municipali- Population Population Popu- Total area Population in
ty change lation (km2) settlements > 200
densi- inh.
Grums 9,418 9,017 9,047 -3,9% 0,3% t23,4 386,38 71,9% 72,5%
Grästorp 5,900 5,674 5,693 -3,5% 0,3% 21,5 264,63 50,6% 53,9%
Gullspång 5,866 52,51 5,280 -10% 0,6% 16,7 315,44 63,6% 67,4%
Total 291,300 295702 311559 7,0% 5,4% 41,4 7515,19 78,4% 80,5%
Table 2 Settlement populations
Name of settlement Municipality Settlement
Population (2019)
Karlstad Karlstad 65,273
Vänersborg Vänersborg 24,095
Lidköping Lidköping 23,467
Kristinehamn Kristinehamn 18,730
Mariestad Mariestad 16,611
Skoghall Hammarö 14,447
Åmål Åmål 9,439
Säffle Säffle 9,324
Skåre Karlstad 5,483
Götene Götene 5,077
Grums Grums 5,076
Vargön Vänersborg 4,999
Lidköping norra Lidköping 4,208
Mellerud Mellerud 4,028
Älvåker och Råtorp Karlstad 3,285
Grästorp Grästorp 3,086
Vålberg Karlstad 2,736
Total 219,364
Between 2011 and 2019, population has been mostly stable on the eastern and western shores of the
lake. It has been growing by 8,7% in Karlstad and 10,9% in Hammarö, i.e. the peninsula just south of
Karlstad. Population growth has been 7,1% in Vänersborg and 5% in Lidköping. Population growth has
been more moderate in the smaller towns of Mariestad, Kristinehamn and Åmål. Population levels are
mostly stable in all other municipalities between 2011 and 2019, after having experienced population de-
cline between 2001 and 2019. (see Table 1 and Map 6).
Population growth is considerably higher in main urban areas in the wider area around the lake, especially
around Göteborg and along the Göta River up to Lilla Edet and around Örebro. Current demographic
trends therefore tend to accentuate Lake Vänern as a position of Inner periphery in the wider regional
context, and the increasing importance of Karlstad as the urban node on Lake Vänern. (see Map 6)
With respect to age structures, all municipalities that are riparian of the lake except Karlstad and Hammarö
(i.e. the peninsula south of Karlstad) have relatively high proportions of seniors. They in this respect dis-
play similar patterns to other municipalities that are not close too main metropolitan areas or in particularly
attractive locations along the coast. Recent increases (2012-2019) in numbers of seniors are particularly
important in municipalities around main towns and cities (e.g. Grästorp and Essunga close to Trollhättan-
Vänersborg, Götene close to Lidköping, Hammarö and Kil close to Karlstad). (see Map 7)
During the same period Grästorp and Götene are the two only riparian municipalities in which the number
of children has not increased by over 5%. The highest rates of children are found around Trollhättan-
Vänersborg and Karlstad. (see Map 8)
In the 2016 assessment of local economic strength produced by the West Sweden Chamber of Com-
merce, local labour markets around the Lake consistently obtain intermediate scores (see Map 4). The
18 ESPON // espon.euREGIONAL REPORT // Lake Vänern
Karlstad and Vänersborg-Trollhättan labour market areas obtain similar scores to Lidköping and Skövde.
Some inland labour market areas north and west of the Lake obtain weak scores. Neighbouring areas of
Göteborg and Örebro obtain top scores. Lake Vänern labour market areas appears as a relatively weaker
area between the stronger economic nodes of Göteborg, Örebro and Oslo in Norway. Areas north of the
lake are in a particularly precarious situation.
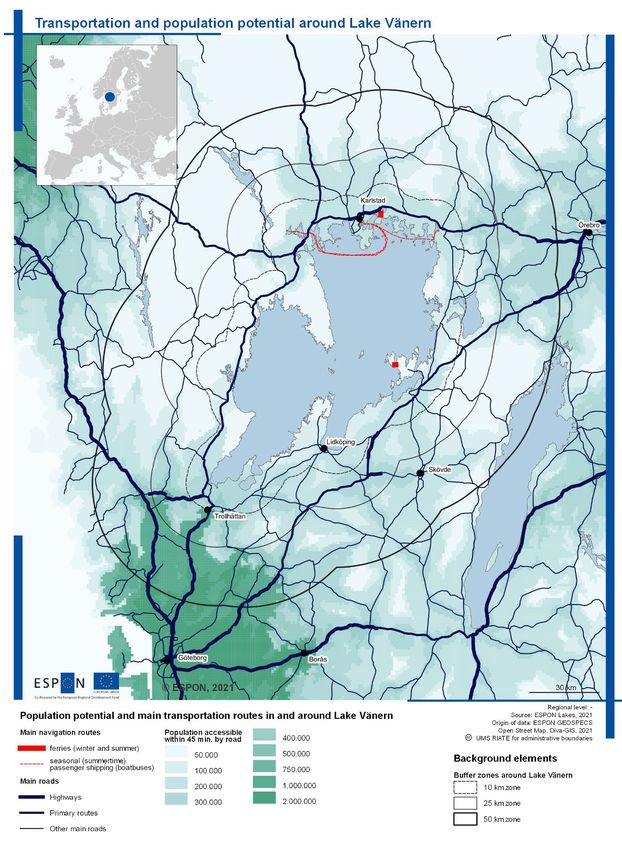
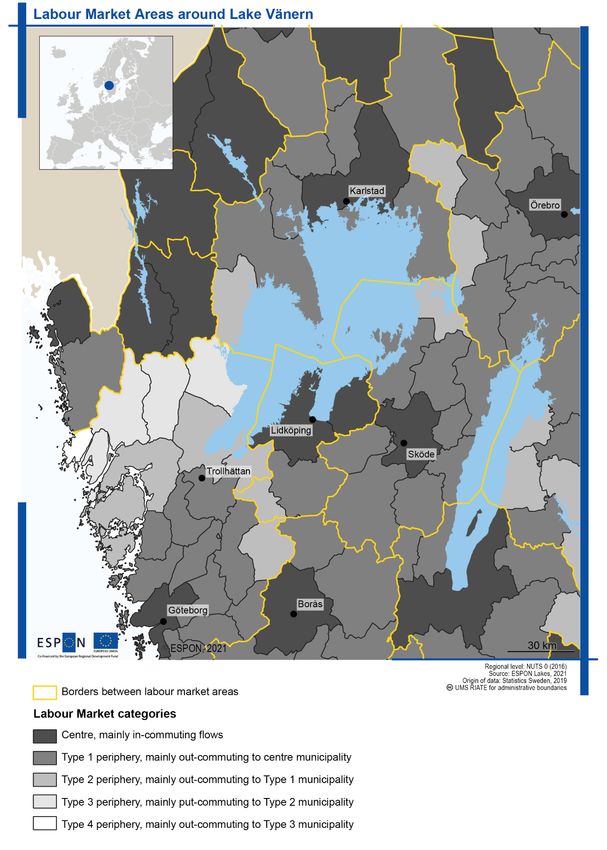
In terms of commuting patterns and industrial functional zones, the Lake Region is organised around some
core areas (Map 5):
- Karlstad is the centre of the northern half of the Lake Region and also of extensive inland areas
north of the Lake Region
- To the functional area to the southwest of the lake has a more polycentric structure. It is organ-
ised around Vänersborg (bordering the lake), Trollhättan and Uddevalla. These neighbouring ag-
glomerations are jointly designated as ‘Trestad’, or ‘Fyrstad’ (jointly with Lysekil)
- To south, a smaller functional area is organised around Lidköping and the considerably smaller
town of Götene.
- The remaining eastern parts of the Lake around Mariestad are attracted to Skövde, which is lo-
cated at equal distance between Väner and Vättern lakes.
Municipalities around Lake Vänern are primarily specialised in manufacturing and extracting activities (see
Table 3). The relative importance of the construction sector is also frequently above national average val-
ues. Agriculture and fisheries are another recurring field of economic specialisation. Compared to average
values for Sweden, business services are under-represented in all municipalities except Karlstad. Trade
and banking are also under-represented in a number of municipalities. Furthermore, none of the Lake
Vänern municipalities display a specialisation in tourism activities. Proportions of employment in hotels and
restaurants are systematically close to the national average.
In some municipalities, the share of persons working in public service delivery (education, healthcare,
civilian authorities and defense) is also higher than the national average. However, with a few exceptions,
these deviations are relatively modest.
The city of Karlstad is close to the national average, except for the under-representation of manufacturing
and extraction activities. It does not appear to concentrate specialised service activities. The data convey
the image of the Lake Vänern region as a predominantly rural and small-town territory where manufactur-
ing and agricultural activities remain pillars of the local economy. Tourism and leisure remain relatively
modest. Public service provision is an important field of activity. However, their relative importance does
not stand out compared to the national average as may be the case in some more fragile and isolated
communities.
ESPON // espon.eu 19REGIONAL REPORT // Lake Vänern Table 3 Employment per sector in Lake Vänern municipalities: deviations from national average values (2017, in percentage points) * 2012 Source: Statistics Sweden, Kommunfakta ** 2010 Municipalities are sorted geographically, *** 2016 clockwise from Karlstad around Lake Vänern . 20 ESPON // espon.eu
REGIONAL REPORT // Lake Vänern

Map 4 Ranking of labour market areas in Sweden (2016)

Based on a combined score of entrepreneurship, employment in private sector, wage levels, education
levels and health (number of days of absence linked to health)
Areas are grouped in categories from red (lowest to score) to dark green (best scores)
Source : West Sweden Chamber of Commerce(2016)

                                                                                   ESPON // espon.eu      21
REGIONAL REPORT // Lake Vänern Map 5 Labour Market Areas around Lake Vänern 22 ESPON // espon.eu
REGIONAL REPORT // Lake Vänern

Map 6 Population change around Lake Vänern

                                                      ESPON // espon.eu       23
REGIONAL REPORT // Lake Vänern Map 7 Seniors and population change around Lake Vänern 24 ESPON // espon.eu
REGIONAL REPORT // Lake Vänern

Map 8 Young peoples and population change around Lake Vänern

                                                                ESPON // espon.eu       25
REGIONAL REPORT // Lake Vänern Map 9 Synthesis of age structures and population change around Lake Vänern 26 ESPON // espon.eu
REGIONAL REPORT // Lake Vänern

Map 10 Municipal gross product around Lake Vänern

                                                             ESPON // espon.eu       27
REGIONAL REPORT // Lake Vänern
2.4 Tourism and cultural / natural heritage
Lake Vänern is generally described as underexploited in terms of tourism. The project plan for “Lake Vä-
nern Grand Tour” elaborated by the Lake Vänern cooperation in 2017 ” (Vänersamarbetet, 2017) points
out that:
Lake Vänern is […] relatively unknown as a destination in Sweden and abroad. There is no
clear awareness of what one can experience at sea or on land around Lake Vänern. Lake Vänern is
difficult to access, both physically and mentally. During the last decade, a number of positive punc-
tual initiatives have been carried out, and several local development plans exist. However, these do
not form a whole. The there is also no exchange between different types of tourism and different
activities.
Data on numbers of guest nights per municipality in Värmland and Västra Götaland counties confirm the
limited development of the tourism sector. If one excepts the city of Karlstad, which is inter alia an estab-
lished destination for conference tourism, municipalities surrounding the lake generally have fewer guest
nights that those located in in e.g. inner parts of Värmland (along the Norwegian border) and along the
coast of Västra Götaland. One may observe that municipalities located close to Göta Canal to the south-
east of Lake Vänern have experience a more limited decline in guest nights between 2019 and 2020, as a
number of Swedes decided to visit it in a context with extensive restrictions on international travel due to
the COVID epidemic. Encouraging a larger proportion of boat tourists on Göta Canal to visit leisure har-
bours around Lake Vänern is an important development perspective.
Göta Canal and Dalsland Canal are important component of the cultural heritage around Lake Vänern.
Among the other components of the cultural heritage, one may mention Läckö Castle on Kållandsö island
(municipality of Lidköping), inherited industrial areas and railway of Kinnekulle, the Rörstrand centre in the
previous porcelain factory in Lidköping, Alster manor in Karlstad and the historical centres of Karlstad,
Åmål,Lidköping and Mariestad. However, tourism promotion around Lake Vänern tends to focus on natural
assets:
- Aventure and sports tourism, e.g. canoeing, kayaking and exploration of the multiple protected
areas on and around the lake;
- Boat tourism: Lake Vänern includes 16-17 leisure harbours catering for the needs of boat tourists.
One of the strengths to be capitalised on is the connection to multiple canals (Göta canal, Trolhät-
te canal, Dalsland canal). An obstacle to be overcome is that the Swedish Maritime Administra-
tion sells passes to circulate on the canals, but these passes do not include stops at the Vänern
leisure harbours. As a result, visitors tend to sail through Lake Vänern without stopping 9
- Fishing tourism: The 2016 strategy for Lake Vänern fishing area identified 10 turism companies
focusing on fishing activities (FLAG Vänern, 2016)
- Urban tourism, e.g. focusing on the heritage in Karlstad and Lidköping 10
Figure 3 Lakes and canals connecting the Baltic Sea to the Kattegat Sea
Source Accountalive (2011) Wikimedia Commons.
9
Interview with Laila Gibson
10
http://www.vanernsdag.se/stader-att-besoka/
28 ESPON // espon.euREGIONAL REPORT // Lake Vänern
Map 11 Number of guest nights per municipality – 2019 and 2020
ESPON // espon.eu 29REGIONAL REPORT // Lake Vänern Map 12 Touristic accommodations around Lake Vänern 30 ESPON // espon.eu
REGIONAL REPORT // Lake Vänern

2.5          Agriculture, fisheries and food production

Agriculture is mainly mentioned in relation to Lake Vänern in connection to risks of flooding of fields and
meadows. Farmers are therefore one of stakeholder groups in relation to the regulation of water levels in
Vänern.

In June 2020, 50 Lake Vänern professional fishers have an active license, which is a reduction of 30%
compared to 2015. Their number have decreased over a long time, but volumes of catches have remained
constant. This is a result of technical improvements in fishing equipment and methods. (FLAG Vänern,
2016). They are concentrated around Spiken fish harbour at the tip of the Kållandsö peninsula, but are
otherwise spread around the lake. Only 3 out of 13 Vänern municipalities have no registered fishermen.
(Ringsby et al., 2020)

The average age of fishermen is high, with a very low number of young fishermen. In the absence of pro-
active measures to support the entry of new, younger actors, the fishery may therefore disappear. This
could include measures to facilitate investments in new fishery equipment, the creation of training pro-
grammes preparing for the fishing profession and an improved gender balance in the profession. There is
currently only one female fisher in Lake Vänern. In many cases, fisheries provide an extra income besides
a retirement pension. The number of authorisations and exams required to be a fisher, some of which
need to be renewed regularly and can be costly, are also an obstacle to the establishment of new fishers.

Monitoring of fish resources is carried out in cooperation between the County administrative boards and
the coastal guard. It is currently considered insufficient, as it does not allow for a sufficiently flexible alloca-
tion of new licences to fishermen. A restrictive policy is implemented as a cautionary measure as
knowledge of fish stocks is insufficient. Between 2015 and 2020, the Swedish Agency for Marine and Wa-
ter Management has rejected 5 out 8 fisher license applications, in spite of the fact that they were all sup-
ported by the concerned County administrative board.

There are 35-40 fish species in the lake. Over the last decades, total volumes of fish caught has remained
relatively stable, fluctuating between 517 and 646 tons. Between 40 and 50% corresponds to vendace, of
which only the roe has a market value (i.e. 5-7% of the mass of caught fishes). This is a seasonal activity,
concentrated in the late autumn, with highly variable catches from year to year. The creation of a “Väner
vendace roe” brand has contributed to the commercial success of this activity. The processing of the roe is
carried out directly by the fishermen, who have established a so-called ‘economic association’.

Pikeperch is the other major source of income. Commercial demand for Pikeperch has increased in recent
years, and this has contributed to increased catches (+25% between 2007 and 2017) and sales (+30% in
the same period).
Whitefish used to be one of the major fish species caught in Lake Vänern. However, in 2012 one observed
that levels of dioxins in these whitefish exceeded EU threshold levels. As a result, the County administra-
tive board decided that it would be forbidden to sell whitefish, unless dioxin measurements on the specific
catch indicated that dioxin levels were below threshold levels. Some worry that increased stocks of white-
fish as a result of low catches may lead to an ecological imbalance in Lake Vänern.

Quantities of fished salmon and trout have decreased significantly, from 54 tons in 2001 to 8 tons in 2019.
As the naturally occurring salmon populations of Lake Vänern are threatened (see section 2.2), one may
only fish salmon bred from hatchery reared smolts.

Crayfish is an increasingly important source of income. Stocks have increased especially in eastern parts
of Lake Vänern (“Dalbo Lake”). However, these are North American crayfish, as the original population of
European crayfish is extinct. It is classified as an invasive species by the European Union 11, no measures

11
     https://ec.europa.eu/environment/nature/invasivealien/list/index_en.htm

                                                                                             ESPON // espon.eu         31
REGIONAL REPORT // Lake Vänern
Figure 4 Volume of fish caught in Lake Vänern between 2011 and 2019, by species, in
metric tons
700
600
500
400
300
200
100
0
2011 2012 2013 2014 2015 2016 2017 2018 2019
Salmon (Lax) Trout (Öring)
Char (Röding) Whitefish (Sik)
Pike (Gädda) Pike-perch (Gös)
Perch (Abborre) Eel (Ål)
Crayfish (Kräfta) Others
Vendace roe (Siklöja löjrom) Vendace excl. roe (Siklöja exkl.löjrom)
Source: own elaboration from Swedish Agency for Marine and Water Management
Figure 5 Value of first sale of fish caught in Lake Vänern by species - 2011-2019, in
thousand SEK
45000
40000
35000
30000
25000
20000
15000
10000
5000
0
2011 2012 2013 2014 2015 2016 2017 2018 2019
Salmon (Lax) Trout (Öring)
Char (Röding) Whitefish (Sik)
Pike (Gädda) Pike-perch (Gös)
Perch (Abborre) Eel (Ål)
Crayfish (Kräfta) Others
Vendace roe (Siklöja löjrom) Vendace excl. roe (Siklöja exkl.löjrom)
Source: own elaboration from Swedish Agency for Marine and Water Management
32 ESPON // espon.euREGIONAL REPORT // Lake Vänern
are implemented to promote its development. Many fishers consider crayfish as a potentially promising
resource.
Fish catches are mainly sold at the Fish Auction in Göteborg. Smaller quantities are sold directly to whole-
salers, or at the Fish Auction in Stockholm. In 2020, the County administrative board has supported the
transformation of bream caught in the lake into mince in cooperation with the association of inland fisher-
men and Stockholm Fish Auction in order to transform fish from Vänern in Stockholm. The reason for
which it is not done locally in the Vänern region is that the volume of fish is insufficient to make this activity
profitable 12. Fishermen of the Lake have also recently started using social media solutions to commercial-
ise their catches locally (so-called REKO-ring). Experiences are positive 13.
Other initiatives to make the fishery activities more sustainable have been coordinated by the fishermen
organisations themselves. This includes the promotion of secondary education for fishermen and the pos-
sibility of obtaining licences after a successfully completed apprenticeship 14.
2.6 Energy production
Electricity is produced from hydropower and wind around Lake Vänern. Small scale hydropower produc-
tion occurs in the tributaries of the Lake. Larger production plants are located in Göta River, downstream
from the lake, with a yearly production of approximately 1,8 TWh (total for Sweden: 65 TWh). There are a
total of 16 power stations downstream from Lake Vänern. (Göta Älvs Vattenvårdförbund, 2015)
There is a concentration of wind power stations in the vicinity of Lake Vänern. In Värmland county, 63% of
the calculated yearly wind power comes from turbines located in Vänern municipalities. The corresponding
figure for Västra Götaland county is 25%. This is a high proportion, considering that Västra Götaland in-
cludes extensive coastal areas with particularly favourable conditions for the production of wind power.
One wind park is located directly on the lake, at Gässlingegrund outside Karlstad, in an area where the
lake is between 3 and 13 meters deep. This was the first major wind power initiative on a large lake. This
wind park was launched in 2010 by an economic association with a total of 1,100 members. As a result of
technical problems, bankruptcy of the company that installed the windmills and falling electricity prices, this
initiative generated substantial losses for involved municipalities and ended in bankruptcy 15. The windmills
were bought by the French company Innovent in 2020 16. An application to build another wind park with 20
turbines further south on the lake at ‘Stenkalles Grund’ was submitted by the private companies Rewind
offshores and ÅF in 2011. Authorisation was granted by the Land and Environment Court in 2013, but
complex legal procedures involving the Swedish Environmental Protection Agency followed until 2015. The
wind park has not yet been built.
12
http://www.skargarden.se/fars-gjord-pa-braxen-kan-lanseras-till-hosten/
13
https://www.visitkristinehamn.se/sv/gora/reko-ring-i-kristinehamn-81676
14
Interview Jonas S. Andersson – Värmland county administrative board
15
http://vindkraftgasslingen.se/nyheter-2/
16
https://www.lendosphere.com/les-projets/financez-le-developpement-international-d-innovent
ESPON // espon.eu 33REGIONAL REPORT // Lake Vänern
Figure 6 Wind energy in and around Lake Vänern
Built
Authorised
Permit currently
being processed
Appealed
against
Source: vbk.lansstyrelsen.se
Table 4 Wind power production
Region/municipality Total maximum Total calculated yearly
output (MW) production (GWh)
Värmland county 204,68 561,16
Grums 0 0
Hammarö 0,5 0,6
Karlstad 34,83 78,6
Kristinehamn 167,62 478,55
Säffle 1,73 3,41
Västra Götaland 250,38 668,66
county
Åmål 5,25 11,07
Götene 36 81,13
Grästorp 21,01 53,23
Gullspång 7,5 18
Lidköping 33,23 80,17
Mariestad 59,94 178,8
Mellerud 79,92 228,06
Vänersborg 7,53 18,2
Total 455,06 1229,82
Source: vbk.lansstyrelsen.se
34 ESPON // espon.euREGIONAL REPORT // Lake Vänern
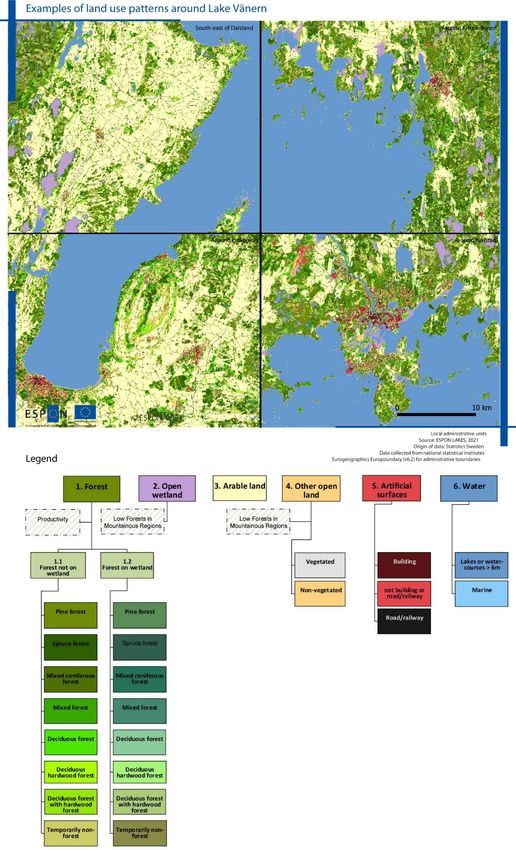
2.7 Spatial planning and development of transport
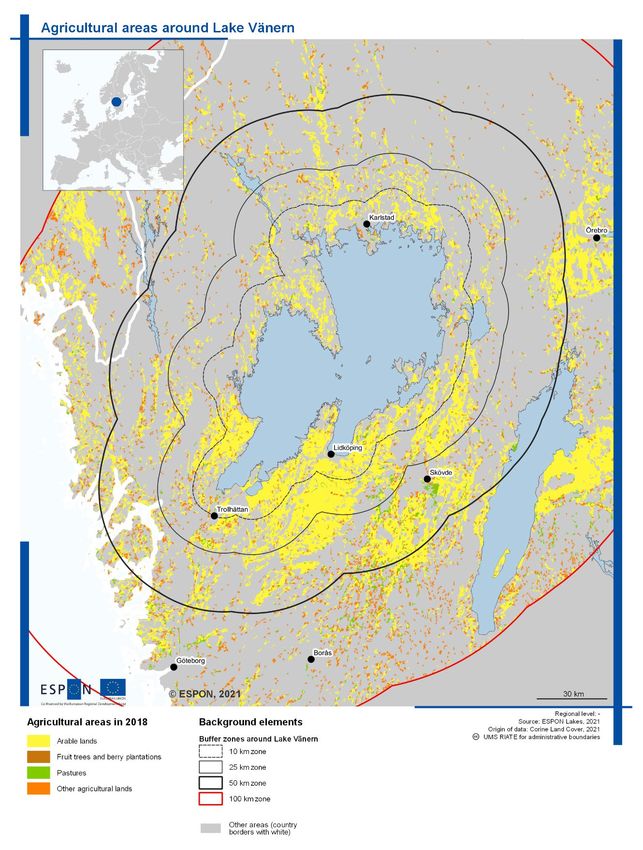
Land use
A main characteristic feature of the Lake Vänern Region compared to the rest of inland south Sweden is
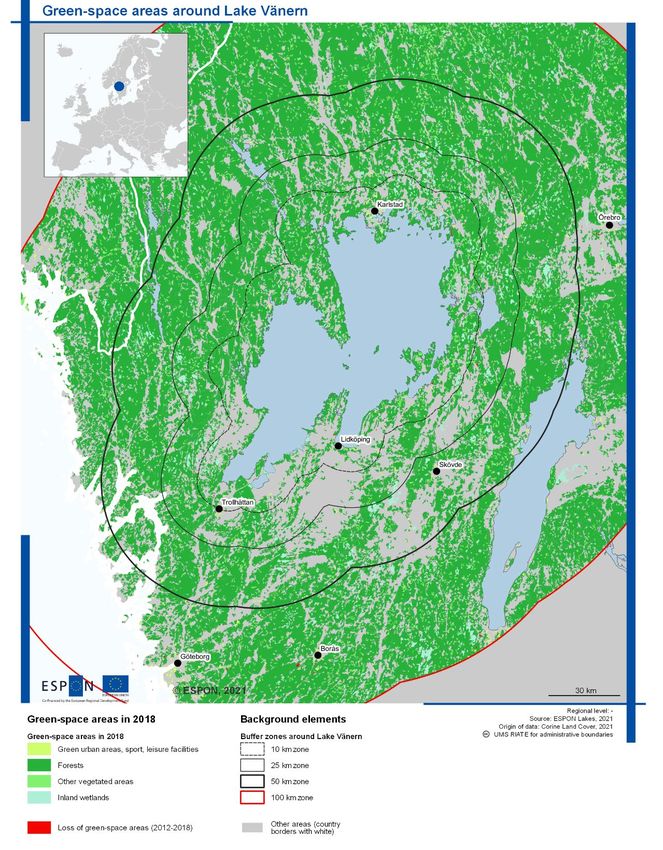
the extent of arable lands (Map 17) and the relatively lower proportion of forested areas (Map 16. These
are particularly large and continuous south-east of the lake, in the so-called West Göta Plain (‘Västgö-
taslättan’), as well as south-west of the lake, in parts of Dalsland historical province comprised between
Vänersborg and Mellerud. However, arable lands can also be found in most areas surrounding the lake.
They are usually separated from the lake by a forest ‘corridor’ of variable width or by wetlands (see Map
13).
Main cities and towns around Lake Vänern tend to be located directly close to the lake, but with a centre
that is at some distance from the shoreline to avoid flooding risks. In Karlstad, Kristinehamn and Lidköping,
for example, many of the areas closest to the lake in the core urban area are occupied by industrial activi-
ties.
In smaller towns and rural areas outside of these agglomerations, there is also no particular concentration
of population along the shoreline.
Additional built-up areas identified by comparing Corine Landcover data for 2012 and 2018 are relatively
limited around Lake Vänern. A limited number of grid cells concerned by such changes are identified
around the largest towns and cities (see Map 15). However, zoom-ins on selected cities around Lake Vä-
nern confirm that settlement areas have extended since 1990. The attractiveness of areas along the lake
is particularly obvious around Kristinehamn, whose urban settlement areas has developed along the at-
tractive Vålösundet waterway and its shoreline promenade 17. Similarly, in the municipality of Hammarö,
located on the peninsula just south of Karlstad, the shoreline areas of Tye and Rud/Lindenäs have experi-
enced extensive urbanisation in recent years (see Map 14).
Shoreline protection
Shorelines have benefited from protection in Sweden since the early 1950s. Initially, the objective was to
preserve access to areas for bathing and enjoyment of natural environments. Provisions were tightened in
1975, in response to the increasing number of secondary houses. From 1994, the purpose of the protec-
tion of shorelines was expanded to include also the protection of natural biotopes. Current regulations
were adopted in 2009. They specify that exemptions from shoreline regulation principles may only be giv-
en in individual cases, and not for categories of areas as was previously the case (Enquiry on the revision
of the shoreline protection regulation, 2020). This protection normally concerns the areas within 100 me-
ters from the shoreline, but can also be extended to areas within 300 meters from the shoreline when this
is needed to uphold he pursued objectives Decisions on the extent of the protected area are made by the
County administrative boards.
Some flexibility has been introduced in shoreline protection around large lakes, as compared to most mari-
time shorelines of southern Sweden (Swedish environmental protection agency and Swedish National
Board of Housing, Building and Planning, 2010: 15). As a result, municipalities around Lake Vänern may,
as part of their planning process, designate “areas for rural development in areas close to the shoreline” 18.
These are primarily areas with good access to the shoreline, where some construction is possible without
limiting the access of the public to the shoreline and without negative impacts on the fauna and flora. Na-
tional regulations contain specific provisions on the required characteristics of such areas when they are
bordering large lakes such as Lake Vänern. A 2020 review of such designations in the County of Värmland
showed that such designations were under elaboration in Karlstad, and had been adopted in 2013 in Säffle
(Carlson, 2020). In Västra Götaland county, such plans are under elaboration in some municipalities (e.g.
17
https://www.visitkristinehamn.se/sv/gora/strandpromenad-langs-valosundet-32302
18
”Landsbygdsutveckling i strandnära lägen (LIS)”
ESPON // espon.eu 35You can also read