FINAL Pleasant Bay System Total Maximum Daily Loads For Total Nitrogen
←
→
Page content transcription
If your browser does not render page correctly, please read the page content below
FINAL
              Pleasant Bay System
          Total Maximum Daily Loads
               For Total Nitrogen
             (Report # 96-TMDL-12,Control #244.0)

           COMMONWEALTH OF MASSACHUSETTS
 EXECUTIVE OFFICE OF ENERGY AND ENVIRONMENTAL AFFAIRS
                IAN A. BOWLES, SECRETARY
MASSACHUSETTS DEPARTMENT OF ENVIRONMENTAL PROTECTION
            ARLEEN O’DONNELL, COMMISSIONER
            BUREAU OF RESOURCE PROTECTION
       GLENN HAAS, ACTING ASSISTANT COMMISSIONER
                         May, 2007
Pleasant Bay
                           Total Maximum Daily Loads
                               For Total Nitrogen

                           Pleasant Bay System

Key Feature:     Total Nitrogen TMDL for Pleasant Bay
Location:        EPA Region 1
Land Type:       New England Coastal
303d Listing:    Crows Pond (MA96-47_2002), Frostfish Creek (MA96-49_2002), Ryder
                 Cove (MA96-50_2002), Muddy Creek (MA96-51_2002)
Data Sources:    University of Massachusetts – Dartmouth/School for Marine Science and
                 Technology; US Geological Survey; Applied Coastal Research and
                 Engineering, Inc.; Cape Cod Commission, Towns of Brewster, Chatham,
                 Harwich, and Orleans along with the Pleasant Bay Alliance.
Data Mechanism: Massachusetts Surface Water Quality Standards, Ambient Data, and
                 Linked Watershed Model
Monitoring Plan: Towns of Chatham, Harwich, and Orleans monitoring program (possible
                 assistance from SMAST)
Control Measures: Sewering, Storm Water Management, Attenuation by Impoundments
                 and Wetlands, Fertilizer Use By-laws

                                                                                     i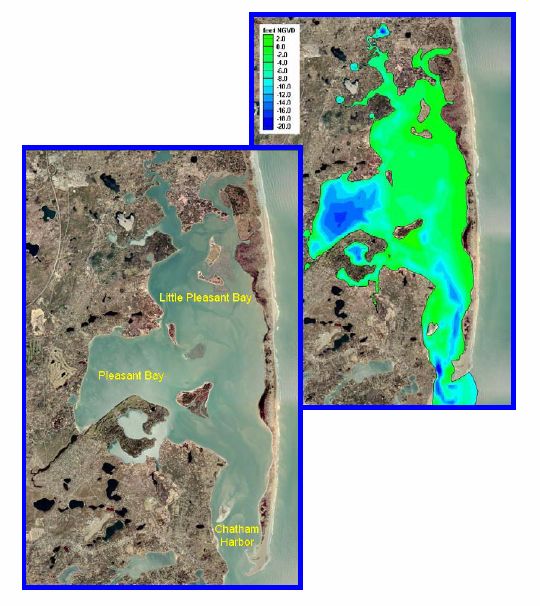
EXECUTIVE SUMMARY
Problem Statement
Excessive nitrogen (N) originating primarily from on-site wastewater disposal (both conventional
septic systems and innovative/alternative systems) has led to significant decreases in the
environmental quality of coastal rivers, ponds, and harbors in many communities in southeastern
Massachusetts. In the coastal waters of Massachusetts these problems include:
• Loss of eelgrass beds, which are critical habitats for macroinvertebrates and fish
• Undesirable increases in macro algae, which are much less beneficial than eelgrass
• Periodic extreme decreases in dissolved oxygen concentrations that threaten aquatic
life
• Reductions in the diversity of benthic animal populations
• Periodic algae blooms
With proper management of nitrogen inputs these trends can be reversed. Without proper
management more severe problems might develop, including:
• Periodic fish kills
• Unpleasant odors and scum
• Benthic communities reduced to the most stress-tolerant species, or in the worst cases,
near loss of the benthic animal communities
Coastal communities, including Brewster, Chatham, Harwich, and Orleans; rely on clean, productive,
and aesthetically pleasing marine and estuarine waters for tourism, recreational swimming, fishing,
and boating, as well as for commercial fin fishing and shellfishing. Failure to reduce and control N
loadings may result in complete replacement of eelgrass by macro-algae, a higher frequency of
extreme decreases in dissolved oxygen concentrations and fish kills, widespread occurrence of
unpleasant odors and visible scum, and a complete loss of benthic macroinvertebrates throughout
most of the embayments. As a result of these environmental impacts, commercial and recreational
uses of Pleasant Bay System coastal waters will be greatly reduced, and could cease altogether.
Sources of nitrogen
Nitrogen enters the waters of coastal embayments from the following sources:
• The watershed
On-site subsurface wastewater disposal systems
Natural background
Runoff
Fertilizers
Wastewater treatment facilities
• Atmospheric deposition
• Nutrient-rich bottom sediments in the embayments
Most of the present controllable N load originates from individual subsurface wastewater disposal
(septic) systems, primarily serving individual residences, as seen in the following figure.
iiFigure 1
Pleasant Bay Nutrient Loading
50 44.20
40
Percent
30 21.27 20.53
20
9.20
10 4.79
0
Fertilizers &
Systems
Atmosphere
Sediments
Background
Septic
Runoff
Target Threshold Nitrogen Concentrations and Loadings
The N loadings (the quantity of nitrogen) to this embayment system ranges from 2.74 kg/day in
Bassing Harbor, to 175.11 kg/day in Pleasant Bay. The resultant concentrations of N in these
subembayments range from 1.26mg/L (milligrams per liter of nitrogen) in the upper part of Muddy
Creek tributary to 0.35 mg/L in the lower part of Chatham Harbor.
In order to restore and protect this system, N loadings, and subsequently the concentrations of N in
the water, must be reduced to levels below the threshold concentrations that cause the observed
environmental impacts. This concentration will be referred to as the target threshold concentration. It
is the goal of the TMDL to reach this target threshold concentration, as it has been determined for
each impaired waterbody segment. The Massachusetts Estuaries Project (MEP) has determined that,
for this embayment system, the bioactive N concentrations of 0.16 – 0.20mg/L are protective. The
mechanism for achieving these target N concentrations is to reduce the N loadings to the
embayments. The Massachusetts Estuaries Project (MEP) has determined that the Total Maximum
Daily Loads (TMDL) of N that will meet the target thresholds range from 2 to 155 kg/day. This
document presents the TMDLs for each impaired water body segment and provides guidance to the
affected towns on possible ways to reduce the nitrogen loadings to within the recommended TMDL,
and protect the waters for these waterbodies.
Implementation
The primary goal of implementation will be lowering the concentrations of N by greatly reducing the
loadings from on-site subsurface wastewater disposal systems through a variety of centralized or
decentralized methods such as sewering and treatment with nitrogen removal technology, advanced
treatment of septage, and/or installation of N-reducing on-site systems.
These strategies, plus ways to reduce N loadings from stormwater runoff and fertilizers, are
explained in detail in the “MEP Embayment Restoration Guidance for Implementation Strategies”,
that is available on the MassDEP website at (http://www.mass.gov/dep/water/resources/restore.htm).
The appropriateness of any of the alternatives will depend on local conditions, and will have to be
determined on a case-by-case basis, using an adaptive management approach.
Finally, growth within the communities of Brewster, Chatham, Harwich, and Orleans that would
exacerbate the problems associated with N loadings, should be guided by considerations of water
quality-associated impacts.
iiiTable of Contents
Contents: Page:
Executive Summary ii
List of Tables v
List of Figures v
Introduction 1
Description of Water Bodies and Priority Ranking 2
Problem Assessment 8
Pollutant of Concern, Sources, and Controllability 9
Description of the Applicable Water Quality Standards 11
Methodology – Linking Water Quality and Pollutant Sources 12
Total Maximum Daily Loads 19
Background loading 20
Wasteload Allocation 20
Load Allocations 21
Margin of Safety 22
Seasonal Variation 24
TMDL Values for Pleasant Bay Systems 24
Implementation Plans 26
Monitoring Plan for TMDLs 27
Reasonable Assurances 27
Appendix A 30
Appendix B 31
Appendix C 32
Appendix D 33
Appendix E 34
ivList of Tables
Table Title Page:
Number
1A Pleasant Bay System Waterbody Segments in Category 5 of the 2
Massachusetts 2002 and 2004 Integrated List
1B Comparison of impaired parameters for the impaired 3,4
subembayments within the Pleasant Bay System
1C General summary of conditions related to the major indicators of 7
habitat impairment observed in the Pleasant Bay System.
2 Observed present nitrogen concentrations and target threshold 15
nitrogen concentrations derived for the Pleasant Bay Systems
3 Nitrogen loadings to the Pleasant Bay system from land use-related 18
runoff, septic systems, the atmosphere, and from nutrient-rich
sediments within the embayments.
4 Present Controllable Watershed nitrogen loading rates, calculated 19
loading rates that would be necessary to achieve target threshold
nitrogen concentrations, and the percent reductions of the existing
loads necessary to achieve the target threshold loadings.
5 The Total Maximum Daily Loads (TMDL) for the Pleasant Bay 25
System, represented as the sum of the calculated target thresholds
loads (from controllable watershed sources), atmospheric
deposition, and sediment sources (benthic input).
List of Figures
Figure Number Title Page:
1 Pleasant Bay Nutrient Loading iii
2 Overview of Pleasant Bay System 5
3 Pleasant Bay Subwatershed Delineation 6
4 Brewster, Chatham, Harwich, and Orleans Resident Population 8
5 Pleasant Bay % Nutrient Loading 10
6 Pleasant Bay System Controllable Nitrogen Sources 22
vIntroduction
Section 303(d) of the Federal Clean Water Act requires each state (1) to identify waters for which effluent
limitations normally required are not stringent enough to attain water quality standards and (2) to establish Total
Maximum Daily Loads (TMDLs) for such waters for the pollutants of concern. The TMDL allocation
establishes the maximum loadings (of pollutants of concern), from all contributing sources, that a water body
may receive and still meet and maintain its water quality standards and designated uses, including compliance
with numeric and narrative standards. The TMDL development process may be described in four steps, as
follows:
1. Determination and documentation of whether or not a water body is presently meeting its water quality
standards and designated uses.
2. Assessment of present water quality conditions in the water body, including estimation of present
loadings of pollutants of concern from both point sources (discernable, confined, and concrete sources such
as pipes) and non-point sources (diffuse sources that carry pollutants to surface waters through runoff or
groundwater).
3. Determination of the loading capacity of the water body. EPA regulations define the loading capacity as
the greatest amount of loading that a water body can receive without violating water quality standards. If
the water body is not presently meeting its designated uses, then the loading capacity will represent a
reduction relative to present loadings.
4. Specification of load allocations, based on the loading capacity determination, for non-point
sources and point sources, which will ensure that the water body will not violate water quality
standards.
After public comment and final approval by the EPA, the TMDL will serve as a guide for future
implementation activities. The MassDEP will work with the Towns to develop specific implementation
strategies to reduce N loadings, and will assist in developing a monitoring plan for assessing the success of the
nutrient reduction strategies.
In the Pleasant Bay System, the pollutant of concern for this TMDL (based on observations of eutrophication),
is the nutrient N. Nitrogen is the limiting nutrient in coastal and marine waters, which means that as its
concentration is increased, so is the amount of plant matter. This leads to nuisance populations of macro-algae
and increased concentrations of phytoplankton and epiphyton that impair eelgrass beds and imperil the healthy
ecology of the affected water bodies.
The TMDLs for N in the Pleasant Bay System are based primarily on data collected, compiled, and analyzed by
University of Massachusetts Dartmouth’s School of Marine Science and Technology (SMAST), the Cape Cod
Commission, and others, as part of the Massachusetts Estuaries Project (MEP). The data were collected over a
study period from 2000 to 2005. This study period will be referred to as the “Present Conditions” in the TMDL
since it contains the most recent data available. The accompanying MEP Technical Report can be found at
http://www.oceanscience.net/estuaries/reports.htm. This report presents the results of the analyses of this coastal
embayment system using the MEP Linked Watershed-Embayment Nitrogen Management Model (Linked
Model). The analyses were performed to assist the Towns with decisions on current and future wastewater
planning, wetland restoration, anadromous fish runs, shellfisheries, open-space, and harbor maintenance
programs. A critical element of this approach is the assessments of water quality monitoring data, historical
changes in eelgrass distribution, time-series water column oxygen measurements, and benthic community
structure that was conducted on each embayment. These assessment served as the basis for generating N
loading thresholds for use as goals for watershed N management. The TMDLs are based on the site specific
1thresholds generated for each embayment. Thus, the MEP offers a science-based management approach to
support the wastewater management planning and decision making process in the Towns of Brewster, Chatham,
Harwich, and Orleans.
Description of Water Bodies and Priority Ranking
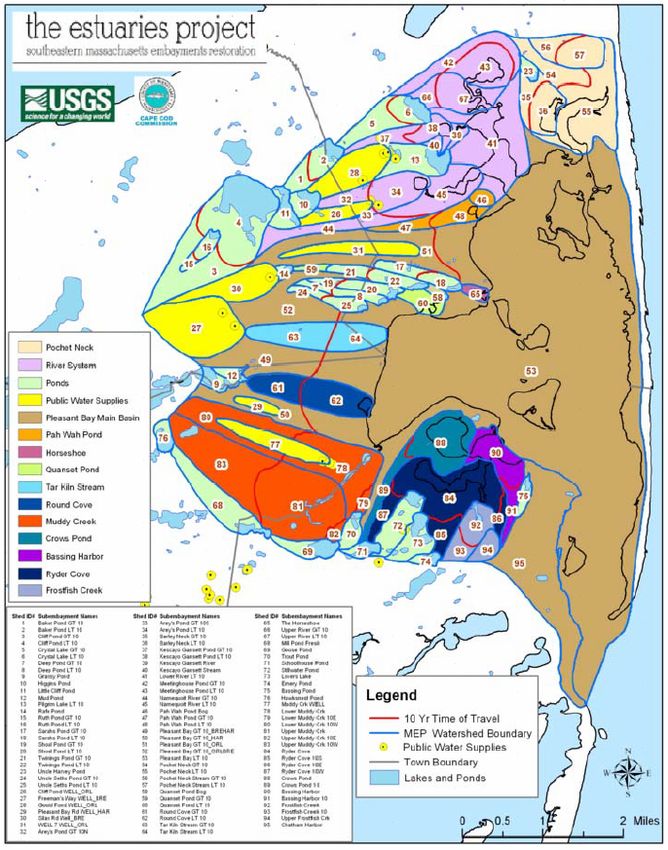
The Pleasant Bay System in Brewster, Chatham, Harwich, and Orleans Massachusetts, at the southeastern edge
of Cape Cod, faces the Atlantic Ocean to the south, and consists of a number of subembayments of varying size
and hydraulic complexity, characterized by limited rates of flushing, shallow depths and heavily developed
watersheds (see Figures 2 and 3 below). This system constitutes an important component of the Town’s natural
and cultural resources. The nature of enclosed embayments in populous regions brings two opposing elements
to bear: 1) as protected marine shoreline they are popular regions for boating, recreation, and land development
and 2) as enclosed bodies of water, they may not be readily flushed of the pollutants that they receive due to the
proximity and density of development near and along their shores. In particular, the subembayments within the
Pleasant Bay System are at risk of further eutrophication from high nutrient loads in the groundwater and runoff
from their watersheds. Because of excessive nutrients, some waterbody segments within this system are already
listed as waters requiring TMDLs (Category 5) in the MA 2002 and 2004 Integrated List of Waters, as
summarized in Table 1A. Several others were not listed because data was not available at that time. New data
collected as part of this TMDL effort has indicated additional impaired segments. One segment (Crows Pond)
although listed as a Category 5 waterbody segment was found not to be impaired for nutrients as part of this
TMDL effort. Table 1B identifies these segments previously listed by MassDEP and additional segments that
were observed to be impaired through the MEP analysis.
Table 1A. The Pleasant Bay System Waterbody Segments
in Category 5 of the Massachusetts 2002 and 2004 Integrated List1
NAME WATERBODY DESCRIPTION SIZE POLLUTANT
SEGMENT LISTED
Pleasant Bay
System
Crows Pond MA96-47_2002 To Bassing Harbor, Chatham 0.19 sq mi -Nutrients
Frostfish Creek MA96-49_2002 Outlet from cranberry bog northwest of Stony Hill 0.02 sq mi -Nutrients
Road to confluence with Ryder Cove, Chatham -Pathogens
Ryder Cove MA96-50_2002 Chatham 0.17 sq mi -Nutrients
-Pathogens
Muddy Creek MA96-51_2002 Outlet of small unnamed pond south of Countryside 0.05 sq mi -Pathogens
Drive and north-northeast of Old Queen Anne Road
to mouth at Pleasant Bay, Chatham
1
These segments are also classified as Category 5 on the Draft 2006 Integrated List.
A complete description of the system is presented in Chapters I and IV of the MEP Technical Report. A
majority of the information on these subembayments is drawn from this report. Chapter VI and VII of the MEP
Technical report provide assessment data on the individual waterbody segments listed in Table 1B (below).
Please note that pathogens are listed in Tables 1A and 1B for completeness. Further discussion of pathogens is
beyond the scope of this TMDL.
The subembayments addressed by this document are determined to be high priorities based on three significant
factors: (1) the initiative that the Towns have taken to assess the conditions of this entire embayment system, (2)
the commitment made by the Towns to restore and preserve the subembayments, and (3) the extent of
impairment in the subembayments. In particular, these subembayments are at risk of further degradation from
increased N loads entering through groundwater and surface water from their increasingly developed
watersheds. In both marine and freshwater systems, an excess of nutrients results in degraded water quality,
adverse impacts to ecosystems, and limits on the use of water resources.
2Table 1B. Comparison of impaired parameters for the impaired
subembayments within the Pleasant Bay System
NAME DEP Listed SMAST Listed
Impaired Impaired
Parameter Parameter
Pleasant Bay System
Meetinghouse Pond & Outlet -Nutrients
-DO level
-Chlorophyll
-Macroalgae
-Benthic fauna
Lonnies Pond -Nutrients
-DO level
-Chlorophyll
-Macroalgae
-Benthic fauna
Areys Pond & Outlet -Nutrients
-DO level
-Chlorophyll
-Macroalgae
-Benthic fauna
The River -Nutrients
-DO level
-Chlorophyll
-Macroalgae
-Eelgrass loss\
- Benthic fauna
Paw Wah Pond -Nutrients
-DO level
-Chlorophyll
-Macroalgae
-Benthic fauna
Quanset Pond -Nutrients
-DO level
-Chlorophyll
-Benthic fauna
Round Cove -Nutrients
-DO level
-Chlorophyll
-Benthic fauna
Muddy Creek Upper -Pathogens -Nutrients
-DO level
-Chlorophyll
-Benthic fauna
Muddy Creek Lower -Pathogens -Nutrients
-DO level
-Chlorophyll
-Eelgrass loss
-Benthic fauna
Ryders Cove -Nutrients -Nutrients
-Pathogens -Chlorophyll
-Macroalgae
-Eelgrass loss
-Benthic fauna
3Table 1B continued
Crows Pond1 -Nutrients -Chlorophyll
-Macroalgae
-Eelgrass loss
-Benthic fauna
Bassing Harbor -Chlorophyll
(Lower Basin)1 -Eelgrass loss
-Benthic fauna
Frost Fish Creek -Nutrients -Nutrients
-Pathogens -Chlorophyll
-Macroalgae
-Benthic fauna
Pochet -Nutrients
-DO level
-Benthic fauna
Little Pleasant Bay -Nutrients
-DO level
-Eelgrass loss
-Benthic fauna
Pleasant Bay -Nutrients
-DO level
-Chlorophyll
-Eelgrass loss
-Benthic fauna
1
Some areas indicate a decline or marginal impact thus a preventive TMDL was determined.
The general conditions related to the major indicators of habitat impairment, due to excess nutrient loadings, are
summarized and tabulated in Table 1C. Where more than one listing of conditions is listed (ex. MI/SI) a
gradient of increasing water quality is present from the upper sub-embayment to the lower sub-embayment.
This is due to the cleaner tidal flushing water from the Atlantic Ocean. Observations are summarized in the
Problem Assessment section below, and detailed in Chapter VII of the MEP Technical Report.
It should be noted that Chatham Harbor is not listed in Table 1B due to the fact that all parameters showed no
impairment. Bassing Harbor and Crows Pond are also not listed for being nutrient impaired is this table. In
Table 1C Chatham Harbor is listed as “Healthy” for all parameters and Bassing Harbor and Crows Pond are
listed from “Healthy” to “Moderately Impaired”. As discussed in the “TMDL Values for Pleasant Bay Systems”
section below these three waterbody segments will be Preservation TMDLs.
4Figure 2 Overview of the Pleasant Bay System
5Figure 3 Pleasant Bay Subwatershed Delineation
6Table 1C. General summary of conditions related to the major indicators of
habitat impairment observed in the Pleasant Bay System.
Embayment/ Eelgrass Dissolved Oxygen Chlorophyll a2 Macro- Benthic
1
Sub-embayment Loss Depletion algae Fauna3
Pleasant Bay
System
Meetinghouse Pond NS 10ug/L up to 21% of time MI SI
20 ug/L up to 1% of time
SI/SD SI/MI
Lonnies Pond NS 10ug/L up to 20% of time MI SI
20 ug/L up to 1% of time
SI MI
Areys Pond NS 10ug/L up to 50% of time SI/SD SD
20 ug/L up to 14% of time
SD SI
The River MI MI/SI MI MI/SI SI
Paw Wah Pond NS 20 ug/L up to 2% of time
H/MI
Bassing Harbor Lower H/MI 10ug/L up to 23% of time NO MI
20 ug/L 0% of time
H H/MI
Frost Fish Creek NS SI SI SI SI
Pochet NS H/MI >10ug/L up to 4% of time NO H/MI
>20 ug/L 0% of time
H
Little Pleasant Bay MI MI H NO MI
Pleasant Bay MI/SI 10ug/L up to 4% of time NO MI/SI
20 ug/L 0% of time
MI MI
Chatham Harbor H 10ug/L 0% of time NO H
20 ug/L 0% of time
H H
Footnotes and key to symbols/terms on following page
7Table 1C Footnotes and key to symbols/terms
1 Based on comparison of present conditions to 1951 Survey data.
2 Algal blooms are consistent with chlorophyll a levels above 20ug/L
3 Based on observations of the types of species, number of species, and number of individuals
4 Observation by the Pleasant Bay Association
H – Healthy – healthy habitat conditions*
MI – Moderately Impaired – slight to reasonable change from normal conditions*
SI – Significantly Impaired- considerably and appreciably changed from normal conditions*
SD – Severely Degraded – critically or harshly changed from normal conditions*
NS - Non-supportive habitat. No eelgrass was present in 1951 Survey data.
NO – none observed during study period.
* - These terms are more fully described in MEP report “Site-Specific Nitrogen Thresholds for
Southeastern Massachusetts Embayments: Critical Indicators”
December 22, 2003 (http://www.mass.gov/dep/water/resources/esttmdls.htm).
Problem Assessment
The watershed of Pleasant Bay system has had rapid and extensive development of single-family homes and the
conversion of seasonal into full time residences. This is reflected in a substantial transformation of land from
forest to suburban use between the years 1950 to 2000. Water quality problems associated with this
development result primarily from on-site wastewater treatment systems, and to a lesser extent, from runoff and
fertilizers from these developed areas.
On-site subsurface wastewater disposal system effluents discharge to the ground, enter the groundwater system
and eventually enter the surface water bodies. In the sandy soils of Cape Cod, effluent that has entered the
groundwater travel towards the coastal waters at an average rate of one foot per day. The nutrient load to the
groundwater system is directly related to the number of subsurface wastewater disposal systems, which in turn
are related to the population. The population of Brewster, Chatham, Harwich, and Orleans as with all of Cape
Cod, has increased markedly since 1950. In the period from 1950 to 2000 the number of year round residents
has almost quadrupled. In addition, summertime residents and visitors swell the population of the entire Cape
by about 300% according to the Cape Cod Commission
(http://www.capecodcommission.org/data/trends98.htm#population).
The increase in year round residents is illustrated in the following figure:
Figure 4
Brewster, Chatham, Harwich, and Orleans Resident
Population
14000
12000 Brewster
10000 Chatham
8000 Harwich
6000 Orleans
4000
2000
0
1940
1950
1960
1970
1980
1990
2000
8Prior to the 1950’s there were few homes and many of those were seasonal. During these times water quality
was not a problem and eelgrass beds were plentiful. Dramatic declines in water quality, and the quality of the
estuarine habitats, throughout Cape Cod, have paralleled its population growth since these times. The problems
in these particular subembayments generally include periodic decreases of dissolved oxygen, decreased
diversity of benthic animals, and periodic algal blooms. Eelgrass beds, which are critical habitats for
macroinvertebrates and fish, have shown significant deterioration in these waters. Furthermore, the eelgrass
can be replaced by macro algae, which are undesirable, because they do not provide high quality habitat for fish
and invertebrates. In the most severe cases habitat degradation could lead to periodic fish kills, unpleasant
odors and scums, and near loss of the benthic community and/or presence of only the most stress-tolerant
species of benthic animals.
Coastal communities rely on clean, productive, and aesthetically pleasing marine and estuarine waters for
tourism, recreational swimming, fishing, and boating, as well as commercial fin fishing and shellfishing. The
continued degradation of these coastal subembayments, as described above, will significantly reduce the
recreational and commercial value and use of these important environmental resources.
Habitat and water quality assessments were conducted on this system based upon available water quality
monitoring data, historical changes in eelgrass distribution, time-series water column oxygen measurements,
and benthic community structure. This system displays a range of habitat quality. In general, the habitat quality
of the subembayments studied is highest near the tidal inlet on the Atlantic Ocean and poorest in the inland-
most tidal reaches. This is indicated by gradients of the various indicators. Nitrogen concentrations are highest
inland and lowest near the mouths. Eelgrass has been significantly reduced from the original 1951 survey. The
dissolved oxygen records showed significant diurnal swings in this system accompanied by elevated levels of
chlorophyll a (above 20 ug/L). The benthic infauna study on this system showed the similar pattern of
improvement increasing as the distance to the tidal inlets decreases. All the subembayments showed significant
habitat impairment in the uppermost reaches with improvement to moderate habitat impairment approaching the
inlets. Only in the Chatham Harbor and inlet area did habitat improve to moderately healthy near the tidal inlet.
Pollutant of Concern, Sources, and Controllability
In this coastal system, as in most marine and coastal waters, the limiting nutrient is nitrogen (N). Nitrogen
concentrations beyond those expected naturally contribute to undesirable conditions, including the severe
impacts described above, through the promotion of excessive growth of plants and algae, including nuisance
vegetation.
Each of the waterbody segments covered in this TMDL has had extensive data collected and analyzed through
the Massachusetts Estuaries Program (MEP) and with the cooperation and assistance from the Towns of
Brewster, Chatham, Harwich, and Orleans, the USGS, and the Cape Cod Commission. Data collection included
both water quality and hydrodynamics as described in Chapters I, IV, V, and VII of the MEP Technical Report.
These investigations revealed that loadings of nutrients, especially N, are much larger than they would be under
natural conditions, and as a result the water quality has deteriorated. A principal indicator of decline in water
quality is the disappearance of eelgrass from a significant portion (up to 24% throughout the entire system) of
its natural habitat in these subembayments. This is a result of nutrient loads causing excessive growth of algae
in the water (phytoplankton) and algae growing on eel grass (epiphyton), both of which result in the loss of
eelgrass through the reduction of available light levels.
As is illustrated by Figure 5, most of the N affecting this system originates from the sediments, on-site
subsurface wastewater disposal systems (septic systems) and atmospheric deposition are the next largest
sources. Considerably less N originates from fertilizers, runoff and natural background sources. Although this
figure shows that overall the sediments are a large N source, examination of the sections of individual
9subembayments indicates that some of them have sediments that provide a significant sink of N (Table 3).
Under certain environmental conditions sediments can denitrify, thus freeing up capacity in the sediments to
absorb more nitrogen. Where the sediments result in N loading it should be emphasized that this is a result of N
loading from other sources. As the N loading from other sources decreases, the sediment N loading will
decrease.
Figure 5 Pleasant Bay % Nutrient Loading
44.22
50.00
40.00
21.27
20.53
30.00
9.20
20.00 4.79
10.00
0.00
Sediments Septic Atmosphere Fertilizers & Natural
Systems Runoff Background
The level of “controllability” of each source, however, varies widely:
Atmospheric nitrogen cannot be adequately controlled locally – it is only through region- and nation-wide air
pollution control initiatives that significant reductions are feasible;
Sediment nitrogen control by such measures as dredging is not feasible on a large scale. However, the
concentrations of N in sediments, and thus the loadings from the sediments, will decline over time if sources in
the watershed are removed, or reduced to the target levels discussed later in this document. Increased dissolved
oxygen will help keep nitrogen from fluxing;
Fertilizer – related nitrogen loadings can be reduced through bylaws and public education;
Stormwater sources of N can be controlled by best management practices (BMPs), bylaws and stormwater
infrastructure improvements;
Septic system sources of nitrogen are the largest controllable sources. These can be controlled by a variety of
case-specific methods including: sewering and treatment at centralized or decentralized locations, transporting
and treating septage at treatment facilities with N removal technology either in or out of the watershed, or
installing nitrogen-reducing on-site wastewater treatment systems.
Natural Background is the background load as if the entire watershed were still forested and contains no
anthropogenic sources. It cannot be controlled locally.
Cost/benefit analyses will have to be conducted on all of the possible N loading reduction methodologies in
order to select the optimal control strategies, priorities, and schedules.
10Description of the Applicable Water Quality Standards
Water quality standards of particular interest to the issues of cultural eutrophication are dissolved oxygen, nutrients,
aesthetics, excess plant biomass, and nuisance vegetation. The Massachusetts water quality standards (314 CMR
4.0) contain numeric criteria for dissolved oxygen, but have only narrative standards that relate to the other
variables, as described below:
314 CMR 4.05(5)(a) states “Aesthetics – All surface waters shall be free from pollutants in concentrations that
settle to form objectionable deposits; float as debris, scum, or other matter to form nuisances, produce
objectionable odor, color, taste, or turbidity, or produce undesirable or nuisance species of aquatic life.”
314 CMR 4.05(5)(c) states, “Nutrients – Shall not exceed the site-specific limits necessary to control
accelerated or cultural eutrophication”.
314 CMR 4.05(b) 1:
(a) Class SA
1. Dissolved Oxygen -
a. Shall not be less than 6.0 mg/l unless background conditions are lower;
b. natural seasonal and daily variations above this level shall be maintained; levels shall not be lowered below
75% of saturation due to a discharge; and
c. site-specific criteria may apply where background conditions are lower than specified
levels or to the bottom stratified layer where the Department determines that designated
uses are not impaired.
(b) Class SB
1. Dissolved Oxygen -
a. Shall not be less than 5.0 mg/L unless background conditions are lower;
b. natural seasonal and daily variations above this level shall be maintained; levels shall not be lowered below
60% of saturation due to a discharge; and
c. site-specific criteria may apply where back-ground conditions are lower than specified
levels or to the bottom stratified layer where the Department determines that designated
uses are not impaired.
Thus, the assessment of eutrophication is based on site specific information within a general framework that
emphasizes impairment of uses and preservation of a balanced indigenous flora and fauna. This approach is
recommended by the US Environmental Protection Agency in their draft Nutrient Criteria Technical Guidance
Manual for Estuarine and Coastal Marine Waters (EPA-822-B-01-003, Oct 2001). The Guidance Manual notes
that lakes, reservoirs, streams, and rivers may be subdivided by classes, allowing reference conditions for each
class and facilitating cost-effective criteria development for nutrient management. However, individual
estuarine and coastal marine waters have unique characteristics, and development of individual water body
criteria is typically required.
It is this framework, coupled with an extensive outreach effort that the Department, and technical support of
SMAST, that MassDEP is employing to develop nutrient TMDLs for coastal waters.
11Methodology - Linking Water Quality and Pollutant Sources
Extensive data collection and analyses have been described in detail in the MEP Technical Report. Those data
were used by SMAST to assess the loading capacity of each subembayment. Physical (Chapter V), chemical
and biological (Chapters IV, VII, and VIII) data were collected and evaluated. The primary water quality
objective was represented by conditions that:
1) restore the natural distribution of eelgrass because it provides valuable habitat for shellfish and finfish
2) prevent algal blooms
3) protect benthic communities from impairment or loss
4) maintain dissolved oxygen concentrations that are protective of the estuarine communities.
The details of the data collection, modeling and evaluation are presented and discussed in Chapters IV, V, VI,
VII and VIII of the MEP Technical Report. The main aspects of the data evaluation and modeling approach are
summarized below, taken from pages 4 through 8 of that report.
The core of the Massachusetts Estuaries Project analytical method is the Linked Watershed-Embayment
Management Modeling Approach. It fully links watershed inputs with embayment circulation and N
characteristics, and is characterized as follows:
• requires site specific measurements within the watershed and each sub-embayment;
• uses realistic “best-estimates” of N loads from each land-use (as opposed to
loads with built-in “safety factors” like Title 5 design loads);
• spatially distributes the watershed N loading to the embayment;
• accounts for N attenuation during transport to the embayment;
• includes a 2D or 3D embayment circulation model depending on embayment
structure;
• accounts for basin structure, tidal variations, and dispersion within the embayment;
• includes N regenerated within the embayment;
• is validated by both independent hydrodynamic, N concentration, and
ecological data;
• is calibrated and validated with field data prior to generation of “what if” scenarios.
The Linked Model has been applied previously to watershed N management in over 15 embayments throughout
Southeastern Massachusetts. In these applications it became clear that the model can be calibrated and
validated, and has use as a management tool for evaluating watershed N management options.
The Linked Model, when properly calibrated and validated for a given embayment, becomes a N management
planning tool as described in the model overview below. The model can assess solutions for the protection or
restoration of nutrient-related water quality and allows testing of management scenarios to support cost/benefit
evaluations. In addition, once a model is fully functional it can be refined for changes in land-use or
embayment characteristics at minimal cost. In addition, since the Linked Model uses a holistic approach that
12incorporates the entire watershed, embayment and tidal source waters, it can be used to evaluate all projects as
they relate directly or indirectly to water quality conditions within its geographic boundaries.
The Linked Model provides a quantitative approach for determining an embayments: (1) N sensitivity, (2) N
threshold loading levels (TMDL) and (3) response to changes in loading rate. The approach is fully field
validated and unlike many approaches, accounts for nutrient sources, attenuation, and recycling and variations
in tidal hydrodynamics (Figure I-2 of the MEP Technical Report). This methodology integrates a variety of
field data and models, specifically:
• Monitoring - multi-year embayment nutrient sampling
• Hydrodynamics -
- embayment bathymetry (depth contours throughout the embayment)
- site specific tidal record (timing and height of tides)
- water velocity records (in complex systems only)
- hydrodynamic model
• Watershed Nitrogen Loading
- watershed delineation
- stream flow (Q) and N load
- land-use analysis (GIS)
- watershed N model
• Embayment TMDL - Synthesis
- linked Watershed-Embayment Nitrogen Model
- salinity surveys (for linked model validation)
- rate of N recycling within embayment
- dissolved oxygen record
- macrophyte survey
- infaunal survey (in complex systems)
Application of the Linked Watershed-Embayment Model
The approach developed by the MEP for applying the linked model to specific subembayments, for the purpose
of developing target N loading rates, includes:
1) selecting one or two stations within each embayment system, located close to the inland-most reach or
reaches, which typically has the poorest water quality within the system. These are called “sentinel”
stations;
2) using site-specific information and a minimum of three years of sub-embayment-specific data to select
target threshold N concentrations for each sub-embayment. This is done by refining the draft target
threshold N concentrations that were developed as the initial step of the MEP process. The target
threshold N concentrations that were selected generally occur in higher quality waters near the mouth of
the embayment system;
3) running the calibrated water quality model using different watershed N loading rates, to determine the
loading rate which will achieve the target threshold N concentration at the sentinel station. Differences
between the modeled N load required to achieve the target threshold N concentration, and the present
13watershed N load, represent N management goals for restoration and protection of the embayment
system as a whole.
Previous sampling and data analyses, and the modeling activities described above, resulted in four major
outputs that were critical to the development of the TMDLs. Two outputs are related to N concentration:
• the present N concentrations in the subembayments
• site-specific target threshold N concentrations
and, two outputs are related to N loadings:
• the present N loads to the subembayments
• load reductions necessary to meet the site specific target threshold N concentrations
In summary: meeting the water quality standards by reducing the nitrogen concentration (and thus the nitrogen
load) at the sentinel station(s), the water quality goals will be met throughout the entire system.
A brief overview of each of the outputs follows:
Nitrogen concentrations in the subembayments
a) Observed “present” conditions:
Table 2 presents the average concentrations of N measured in this system from six years of data collection
(during the period 2000 through 2005). Concentrations of N are the highest in upper Muddy Creek (1.26
mg/L). Nitrogen in the other subembayments ranges in concentration from 0.23 to 1.16 mg/L, resulting in
overall ecological habitat quality ranging from healthy to severely degraded. The individual station means and
standard deviations of the averages are presented in Appendix A.
b) Modeled site-specific target threshold nitrogen concentrations:
A major component of TMDL development is the determination of the maximum concentrations of N (based on
field data) that can occur without causing unacceptable impacts to the aquatic environment. Prior to conducting
the analytical and modeling activities described above, SMAST selected appropriate nutrient-related
environmental indicators and tested the qualitative and quantitative relationship between those indicators and N
concentrations. The Linked Model was then used to determine site-specific threshold N concentrations by using
the specific physical, chemical, and biological characteristics of each sub-embayment.As listed in Table 2, the
site-specific target (threshold) bioactive N concentrations for the sentinel stations listed range from 0.16 – 0.21
mg/L.
The findings of the analytical and modeling investigations for this embayment system are discussed and
explained below:
The threshold nitrogen level for an embayment represents the average watercolumn concentration of nitrogen
that will support the habitat quality being sought. The watercolumn nitrogen level is ultimately controlled by
the integration of the watershed nitrogen load, the nitrogen concentration in the inflowing tidal waters
(boundary condition) and dilution and flushing via tidal flows. The water column nitrogen concentration is
modified by the extent of sediment regeneration and by direct atmospheric deposition.
Threshold N levels for each of the embayment systems in this study were developed to restore or maintain SA
waters or high habitat quality. In these systems, high habitat quality was defined as supportive of eelgrass and
diverse benthic animal communities. Dissolved oxygen and chlorophyll a were also considered in the
assessment. Overall N loads (Tables ES-1 and ES-2 of the MEP Technical Report) for the Pleasant Bay System
14were comprised primarily of benthic flux N and to a lesser degree the load from septic tanks and land use.
Land-use and wastewater analysis found that overall 70% of the controllable N load to the embayments was
from septic system effluent. This controllable load does not include atmospheric deposition or benthic flux.
Table 2. Observed present nitrogen concentrations and target threshold nitrogen concentrations derived
for the Pleasant Bay System
Subembayments Sub-embayment Sub-embayment Observed
(Sentinel Stations are in bold) Observed Total Bioactive Nitrogen Target Threshold
Nitrogen Concentration Bioactive Nitrogen
1 (mg/L) Concentrations (mg/L)
Concentration
(mg/L)
Meetinghouse Pd (WMO-10) 0.72-0.982 0.28-0.412 0.21
The River-upper (WMO-9) 0.86 0.25 0.20
The River-lower (PBA-13) 0.56 0.18 0.17
Lonnies Pond (PBA-15) 0.78 0.28 0.21
Areys Pond (PBA-14) 0.73 0.30 0.25
Namequoit River (WMO-06) 0.73-0.832 0.24-0.302 0.21
The River-mid (WMO-08) 0.85 0.18 0.18
Pochet Neck (WMO-05) 0.72-0.842 0.24-0.282 0.21
Little Pleasant Bay (PBA-12) 0.57-0.772 0.14-0.182 0.16
Paw Wah Pond (PBA-11) 0.71 0.27 0.21
Quanset Pond (WMO-12) 0.56-0.602 0.19-0.212 0.21
Round Cove (PBA-09) 0.71 0.25 0.21
Muddy Creek-upper (PBA-05a) 1.26 0.70 0.41
Muddy Creek-lower (PBA-05) 0.57 0.24 0.21
Pleasant Bay 0.44-0.732 0.14-0.192 0.16
Ryders Cove (PBA-03) 0.42-0.722 0.16-0.252 0.16
Frost Fish Creek-lower (M-14) 1.16 0.35 0.17
Crows Pond (PBA-04) 0.84 0.21 0.15
Bassing Harbor (PBA-022) 0.49 0.12 0.12
Chatham Hbr – upper (PBA-01) 0.35-0.432 0.10-0.112 0.10
Atlantic Ocean 0.09
(Boundary Condition)
1
calculated as the average of the separate yearly means of 2000-2005 data. Overall means and standard
deviations of the average are presented in Tables A-1 Appendix A
2
listed as a range since it was sampled as several segments (see Table A-1 Appendix A)
A major finding of the MEP clearly indicates that a single total nitrogen threshold can not be applied to
Massachusetts’ estuaries, based upon the results of the Popponesset Bay System, the Hamblin / Jehu Pond /
Quashnet River analysis in eastern Waquoit Bay. This is almost certainly going to be true for the other
embayments within the MEP area, as well.
The threshold nitrogen levels for the Pleasant Bay System were determined as follows:
Pleasant Bay Threshold Nitrogen Concentrations
While there is significant variation in the dissolved organic nitrogen levels, hence total nitrogen levels
supportive of healthy eelgrass habitat, the level of bioactive nitrogen supportive of this habitat appears to be
relatively constant. Therefore, the MEP Technical Team set a single eelgrass threshold based upon stable
eelgrass beds, tidally averaged bioactive N levels and the stability of eelgrass as depicted in coverage from
1951-2001. The eelgrass threshold was set at Little Pleasant Bay (Station PBA-12) 0.16 mg/L bioactive N
15based upon the Chatham (Dec 2003 MEP report) analysis for Bassing Harbor. That report for Bassing Harbor
indicated a bioactive level for high quality eelgrass habitat of 0.16 mg/L bioactive N based upon Healthy
eelgrass community in both Bassing Harbor at 0.12 mg/L bioactive N and in Stage Harbor at 0.16 mg/L
bioactive N (Oyster River Mouth). The higher value was used as the eelgrass habitat in Bassing Harbor was
below its nitrogen loading limit at that time. Taking into consideration the analysis of the Pleasant Bay System,
the bioactive nitrogen threshold of 0.16 mg/L N yields an equivalent Total Nitrogen Threshold for the Bassing
Harbor subembayment (average upper and lower Ryders Cove stations) of 0.52 mg/L N. This value is very
close to the previous Bassing Harbor specific threshold range of 0.53-0.55 mg/L N. The slight shift in threshold
level results from the greatly expanded water quality database for the present versus previous analysis. The
nitrogen boundary condition (concentration of N in inflowing tidal waters from Pleasant Bay) for the Bassing
Harbor System is 0.45 mg/L TN.
The sentinel station for the Pleasant Bay System based on a nitrogen threshold targeting restoration of eelgrass
was placed within the uppermost reach of Little Pleasant Bay (PBA-12) near the inlets to The River and Pochet.
The threshold bioactive nitrogen level at this site (as for Ryders Cove) is 0.16 mg/L bioactive N. Based upon
the background dissolved organic nitrogen average of upper Little Pleasant Bay and Lower Pochet 0.56 mg/L N
and the bioactive threshold value, the total nitrogen level at the sentinel station (PBA-12) is 0.72 mg/L N. The
restoration goal is to improve the eelgrass habitat throughout Little Pleasant Bay and the historic distribution in
Pleasant Bay, which will see lower nitrogen levels when the threshold is reached. In addition, the fringing
eelgrass beds within The River and within Pochet should also be restored, as they are in shallower water than
the nearby sentinel site and therefore are able to tolerate slightly higher watercolumn nitrogen levels.
Moreover, the same threshold bioactive nitrogen level should be met for the previous sentinel station (upper
Ryders Cove) in Bassing Harbor System when levels are achieved at the sentinel station in upper Little Pleasant
Bay. However, given the partial independence of the Bassing Harbor sub-embayment system relative to the
greater Pleasant Bay System (i.e. its own local watershed nitrogen load plays a critical role in its health), the
upper Ryders Cove sentinel station should be maintained as the guide for this sub-embayment to Pleasant Bay.
It should also be noted that while the bioactive threshold is the same at both sites, the Total Nitrogen level in
Ryders Cove is 0.52 mg/L N, due to the lower dissolved organic nitrogen levels in the lower Bay.
While eelgrass restoration is the primary nitrogen management goal within the Pleasant Bay System, there are
small basins, which do not appear to have historically (1951) supported eelgrass habitat. For these sub-
embayments, restoration and maintenance of healthy animal communities is the management goal. At present,
moderately impaired infaunal communities are present in Ryders Cove (PBA-03) at tidally averaged bioactive
nitrogen levels of 0.24 mg/L N. Similarly, there are moderately impaired infaunal communities, designated
primarily by the dominance of amphipods (amphipod mats) in most of the 8 sub-embayments of focus. These
communities are present adjacent the inlet to Lonnies Pond (in The River Upper) at bioactive nitrogen levels of
0.22 mg/L N, in the Namequoit River at 0.22-0.24 mg/L N and in Round Cove at 0.24 mg/L N. These
communities can be found at even higher levels in the fringing shallow areas of deep basins like Areys Pond
(0.30 mg/L N) and Meetinghouse Pond (0.41 mg/L N). Very shallow waters tend to minimize oxygen depletion
that severely stress infaunal communities in deeper basins. Paw Wah Pond is periodically hypoxic and as a
result does not presently support infaunal habitat. These data are at higher bioactive nitrogen levels than the
healthy infaunal habitat in the lower Pochet Basin (WMO-03) at 0.18 mg/L N. It appears that the infaunal
threshold lies between 0.18 and 0.22 mg/L N tidally averaged bioactive nitrogen. Based upon the animal
community and nitrogen analysis discussed in Chapter VIII, the restoration goal for the 8 small tributary sub-
basin systems to Pleasant Bay is to restore a healthy habitat to the full basin in the shallower or more open
waters and to the margins in the deep drowned kettles that periodically stratify. This would argue for a
bioactive nitrogen threshold of 0.21 mg/L N, lower than the lowest station with significant amphipod presence.
Translation to Total Nitrogen is presented in detail in Chapter VIII.
Development of nitrogen load reductions needed to meet the threshold concentration of 0.16 mg/l bioactive
nitrogen (DIN+PON) in Ryders Cove (the average of PBA-03 and CM-13) and Upper Little Pleasant Bay
16(PBA-13) focused primarily on septic load removal within the River and Bassing Harbor systems. Due to the
relatively large size of the Pleasant Bay system, achieving the primary threshold concentration for the
restoration of eelgrass at the sentinel stations alone did not achieve the secondary threshold at the series of small
embayments surrounding Pleasant and Little Pleasant Bays. The secondary threshold concentration of 0.21
mg/l bioactive nitrogen (DIN+PON) in Meetinghouse Pond (Outer), Lonnies Pond, Upper Namequoit River,
Upper Pochet, Paw Wah Pond, Little Quanset Pound, Round Cove and Lower Muddy Creek required site-
specific removal of septic nitrogen from the watersheds directly impacting these sub-embayments. Chapter
VIII of the MEP Technical Report presents the percent of septic load removed from the various watersheds to
achieve both the primary and secondary threshold concentrations of bioactive nitrogen at the sentinel stations
It is important to note that the analysis of future nitrogen loading to the Pleasant Bay estuarine system focuses
upon additional shifts in land-use from forest/grasslands to residential and commercial development. However,
the MEP analysis indicates that significant increases in nitrogen loading can occur under present land-uses, due
to shifts in occupancy, shifts from seasonal to year-round usage and increasing use of fertilizers (presently less
than half of the parcels use lawn fertilizers). Therefore, watershed-estuarine nitrogen management must include
management approaches to prevent increased nitrogen loading from both shifts in land-uses (new sources) and
from loading increases of current land-uses. The overarching conclusion of the MEP analysis of the Pleasant
Bay estuarine system is that restoration will necessitate a reduction in the present nitrogen inputs and
management options to negate additional future nitrogen inputs.
Nitrogen loadings to the subembayments
a) Present loading rates:
In the Pleasant Bay System overall, the highest N loading from controllable sources is from on-site wastewater
treatment systems. On-site septic system loadings range from 0.78 kg/day in Areys Pond to as high as 14.87
kg/day in Pleasant Bay. Nitrogen loading from the nutrient-rich sediments (referred to as benthic flux) is
significant in these embayments. As discussed previously, however, the direct control of N from sediments is
not considered feasible. However, the magnitude of the benthic contribution is related to the watershed load.
Therefore, reducing the incoming load should reduce the benthic flux over time. The total N loading from all
sources ranges from 2.74 kg/day in Bassing Harbor to 175.11 kg/day in the Pleasant Bay. A further breakdown
of N loading, by source, is presented in Table 3. The data on which Table 3 is based can be found in Table ES-1
of the MEP Technical Report.
b) Nitrogen loads necessary for meeting the site-specific target nitrogen concentrations.
As previously indicated, the present N loadings to the Pleasant Bay System must be reduced in order to restore
conditions and to avoid further nutrient-related adverse environmental impacts. The critical final step in the
development of the TMDL is modeling and analysis to determine the loadings required to achieve the target N
concentrations. Table 4 lists the present controllable watershed N loadings from the Pleasant Bay system. The
last two columns indicate one scenario of the reduced loads and percentage reductions that could achieve the
target threshold N concentrations at the sentinel systems (see following section). It is very important to note
that load reductions can be produced through reduction of any or all sources of N, potentially increasing the
natural attenuation of nitrogen within the freshwater systems to the system, and/or modifying the tidal flushing
through inlet reconfiguration (where appropriate). The load reductions presented below represent only one of a
suite of potential reduction approaches that need to be evaluated by the communities involved. The presentation
of load reductions in Table 4 is to establish the general degree and spatial pattern of reduction that will be
required for restoration of these N impaired embayments. The loadings presented in Table 4 represent one, but
not the only, loading reduction scenario that can meet the TMDL goal.
17Table 3. Nitrogen loadings to the Pleasant Bay system from land use-related runoff, septic systems, the
atmosphere, and from nutrient-rich sediments within the embayments.
Present Land Present Septic Present Present Total nitrogen load
Use System Atmospheric Benthic from all sources
Pleasant Bay Load 1 Load Deposition Input 2 (kg/day)
System (kg/day) (kg/day) (kg/day) (kg/day)
Subembayments
Meetinghouse Pond 1.06 5.14 0.58 14.37 21.15
The River – upper 0.70 2.07 0.29 6.26 9.32
The River – lower 1.01 2.87 2.24 10.48 16.60
Lonnies Pond 0.81 1.63 0.23 1.59 4.26
Areys Pond 0.53 0.78 0.18 6.00 7.49
Namequoit River 0.73 2.01 0.52 14.57 17.83
Paw Wah Pond 0.35 1.51 0.08 3.63 5.57
Pochet Neck 1.81 6.61 1.77 0 10.19
Little Pleasant Bay 3.15 4.99 24.09 37.23 69.46
Quanset Pond 0.38 1.40 0.17 5.99 7.94
Round Cove 1.06 3.16 0.17 8.42 12.81
Muddy Creek – upper 2.83 7.16 0.16 4.56 14.71
Muddy Creek – lower 2.14 6.34 0.21 0 8.69
Pleasant Bay 14.41 14.87 37.01 108.82 175.11
Ryder Cove 2.68 7.14 1.30 9.36 20.48
Frost Fish Creek 0.70 2.20 0.10 0 3.00
Crows Pond 0.89 3.33 1.39 0.61 6.22
Bassing Harbor 0.27 1.40 1.07 0 2.74
Chatham Harbor 2.90 14.20 14.15 0 31.25
System Total 38.41 88.81 85.71 231.89 444.82
1
composed of fertilizer and runoff and atmospheric deposition to lakes
2
nitrogen loading from the sediments, negative fluxes have been set to zero
This table looks at reducing both controllable land use and septic system loads. Other alternatives may also
achieve the desired threshold concentration as well and can be explored using the MEP modeling approach. In
the scenario presented, the percentage reductions in N loadings to meet threshold concentrations range from
100% in the Meetinghouse Pond and Muddy Creek – lower subembayments to 0 % in the Horseshoe, Crows
Pond, Bassing Harbor, and Chatham Harbor subembayments. Table VIII-3 of the MEP Technical Report (and
rewritten as Appendix B of this document) summarizes the present loadings from on-site subsurface wastewater
disposal systems and the reduced loads that would be necessary to achieve the threshold N concentrations in the
Pleasant Bay system, under the scenario modeled here. In this scenario only the on-site subsurface wastewater
disposal system loads were reduced to the level of the target threshold watershed load.
18Table 4. Present Controllable Watershed nitrogen loading rates, calculated loading rates that are
necessary to achieve target threshold nitrogen concentrations, and the percent reductions of the existing
loads necessary to achieve the target threshold loadings.
Present Target Percent controllable
Subembayments controllable threshold watershed load reductions
watershed watershed needed to achieve
load 1 load2 threshold loads
(kg/day) (kg/day)
Meetinghouse Pond 6.20 1.06 83
The River – upper 2.77 1.74 37
The River – lower 3.88 2.44 37
Lonnies Pond 2.44 1.63 33
Areys Pond 1.30 0.92 29
Namequoit River 2.74 1.73 37
Paw Wah Pond 1.86 0.73 61
Pochet Neck 8.42 4.12 51
Little Pleasant Bay 8.13 5.88 28
Quanset Pond 1.78 1.08 39
Round Cove 4.23 2.96 30
Muddy Creek – upper 9.98 4.61 54
Muddy Creek – lower 8.48 2.14 75
Pleasant Bay 29.28 21.85 25
Ryder Cove 9.82 4.47 55
Frost Fish Creek 2.90 0.70 76
Crows Pond 4.22 4.22 0
Bassing Harbor 1.67 1.67 0
Chatham Harbor 17.10 17.10 0
System Total 127.20 81.25 36
1
Composed of combined controllable land use and septic system loadings
2
Target threshold watershed load is the load from the watershed needed to meet the embayment threshold N
concentrations identified in Table 2 above and derived from data found in Table ES2 of the Tech Report
It should be emphasized once again that this is only one scenario that will meet the target N concentrations at
the sentinel stations, which is the ultimate goal of the TMDL. There can be variations depending on the chosen
sub-watershed and which controllable source is selected for reduction. Alternate scenarios will result in
different amounts of nitrogen being reduced in different sub-watersheds. For example, taking out additional
nitrogen upstream will impact how much nitrogen has to be taken out downstream. The towns involved should
take any reasonable effort to reduce the controllable nitrogen sources.
Total Maximum Daily Loads
As described in EPA guidance, a total maximum daily load (TMDL) identifies the loading capacity of a water
body for a particular pollutant. EPA regulations define loading capacity as the greatest amount of loading that a
water body can receive without violating water quality standards. The TMDLs are established to protect and/or
restore the estuarine ecosystem, including eelgrass, the leading indicator of ecological health, thus meeting water
quality goals for aquatic life support. Because there are no “numerical” water quality standards
19You can also read