Water Utilities - governance and performance - quarterly vol.22 I n 1 I 2020 - Network ...
←
→
Page content transcription
If your browser does not render page correctly, please read the page content below

Water Utilities – governance and
performance
                                           vol. 22 I n°1 I 2020

« au service de l’analyse » — since 1998

                                                 quarterly
contents
Network Industries Quarterly, Vol. 22, issue 1, 2020 (March)
“Water Utilities – governance and performance” dossier
This issue of Network Industries Quarterly is devoted to water utilities,
their governance and their performance. With growing urbanization, 3 When Utility Aggregations Fail to Deliver
pollution and water stress, utilities are ever more challenged to provide Cost Savings
safe and affordable drinking water in an ecologically sustainable
Michael Klien
manner. Are they and will they in the future be up to the task? What is
and should be the right size to do this? What is and should be the best
governance of them (ownership, legal structure, regulation) to make 7 The Governance of Water and Wastewater
sure that they can deliver? What is and should be the most appropriate
articulation between governance of the water resource and governance Provision in Brazil: Are There Clear Goals?
of the utility? These are some of the questions that the four papers seek Juliana Smiderle, Morganna Capodeferro, Pedro Fernandes, Ed-
to address. The examples the authors refer to pertain mainly to Latin son Gonçalves, Joisa Dutra
America, namely Brazil, Mexico, and Argentina.
The first contribution authored by Klien makes the argument that 12 The Contextual and Jurisdictional Framework
water utility aggregations do not necessarily lead to cost savings.
The author uses a global database of utilities to document how for Metropolitan Water Provision in
aggregations change utilities with respect to network density and Mexico: The Case of the Monterrey
cost structure. He argues that aggregations typically do not change Metropolitan Area
utilities in a way suited to deliver performance improvements.
Ismael Aguilar-Barajas, Aldo I. Ramírez
Smiderle, Capodeferro, Fernandes, Gonçalves and Dutra discuss
the concentration of state-owned water-supply and sanitation 16 Mapping and Strengthening Water and
service providers in Brazil. In particular, they look at the contracts
between these companies and municipalities and critically examine Sanitation Service Regulation in Argentina:
the kinds of goals that are pursued by means of these contracts. from Diagnosis to Policy Recommendations
Maria Salvetti, Aziza Akhmouch, Antonio Cañamas-Catala
Aguilar-Barajas and Ramírez examine the contextual and
jurisdictional framework for metropolitan water provision in Mexico,
based on the Monterrey Metropolitan Area case. They argue that proper 24 Announcements
understanding of the supply of drinking water requires an urban region-
system framework so that major interactions are recognised and analysed.
Akhmouch, Cañamas-Catala and Salvetti critically and very
comprehensively analyse water and sanitation service regulation and
regulatory functions in Argentina (including water resources). From their
analysis, they derive suggestions on how to improve such regulations.
Network Industries Quarterly | Published four times a year, contains information about
Matthias Finger postal, telecommunications, energy, water, transportation and network industries in gen-
eral. It provides original analysis, information and opinions on current issues. The editor
establishes caps, headings, sub-headings, introductory abstract and inserts in articles. He
also edits the articles. Opinions are the sole responsibility of the author(s).
Subscription | The subscription is free. Please do register at fsr.transport@eui.eu to be
alerted upon publication.
Letters | We do publish letters from readers. Please include a full postal address and a
reference to the article under discussion. e letter will be published along with the
name of the author and country of residence. Send your letter (maximum 450 words) to
the editor-in-chief. Letters may be edited.
Publication director | Matthias Finger
Managing editor | Irina Lapenkova
Publishing editor | Ozan Barış Süt
Founding editor | Matthias Finger
Proof-reading | David Frank Barnes
Cover image | By 楚门 From LovePik.com
Publisher | Chair MIR, Matthias Finger, director, EPFL-CDM, Building Odyssea,
Station 5, CH-1015 Lausanne, Switzerland (phone: +41.21.693.00.02; fax: +41.21.693.
00.80; email: mir@epfl.ch; website: http://mir.epfl.ch/)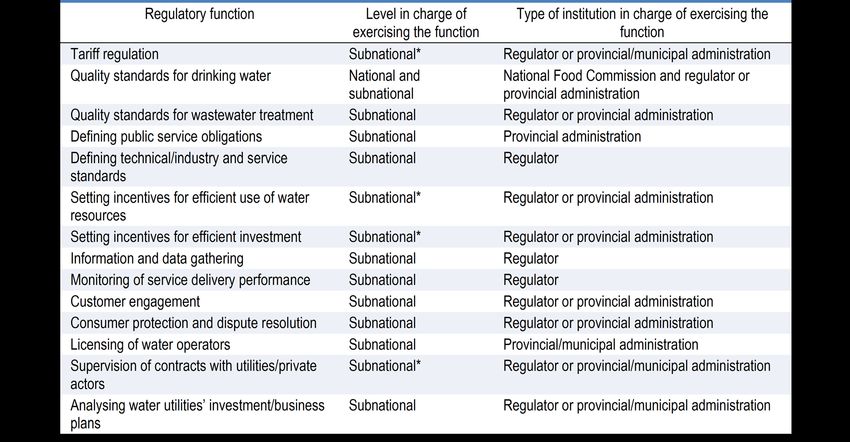
dossier

When Utility Aggregations Fail to Deliver Cost Savings
Michael Klien*

There is growing evidence that utility aggregations do not necessarily lead to cost savings. In this paper I use a global database of utilities to document
how aggregations change utilities with respect to network density and cost structure. I argue that aggregations typically do not change utilities in a
way suited to delivering performance improvements.

    Introduction                                                               of customer density (cost elasticity w.r.t. customers) and
  The goal of this paper is to explain the seeming contradic-                  economies of size (cost elasticity w.r.t. service area). In
tion between studies documenting economies of scale in                         most instances, a ceteris paribus increase in volume (keep-
the water sector and the disappointing results from studies                    ing the service area constant) would result in a less than
analysing the effects of aggregation. After briefly reviewing                  proportional increase in cost. Similar, albeit less strong, are
the literature, the study compares ex-ante expectations of                     the findings on customer density.
how aggregations change utilities with real-world examples                      The results are much less clear when the service area, e.g.
of aggregations.1 I argue that the effects of aggregations                     by aggregating providers, increases. For instance, Mercadi-
hinge on how they change the utilities involved. Therefore,                    er et al. (2016) find that cost savings among Peruvian wa-
the focus of the paper is to identify the relationship be-                     ter utilities can be achieved through increasing the volume
tween aggregations, utility structure (volume, density and                     or customers (density). Conversely, increasing the number
the number of towns served) and the input mix (labour                          of towns served at the same time (economies of scale) does
cost, energy cost, others). I hope this will help to structure                 not lead to a reduction in unit costs.
discussion on the effects of aggregations and I want to em-                      This finding is mirrored in the aggregation study by
phasize that the design of aggregations matters.                               Urakami and Parker (2011), which finds that economies
                                                                               of scale through aggregations are curbed by a loss of den-
    Background                                                                 sity. In a similar vein, Klien and Michaud (forthcoming)
  There is a very large literature on economies of scale in the                find no cost savings for a sample of central and eastern Eu-
water sector, concluding by and large that there are sub-                      ropean countries. Aggregated utilities do not show better
stantial economies of scale in water provision (González-                      cost efficiency than similar utilities that are not aggregated.
Gómez and García-Rubio, 2008; Abbott and Cohen,                                  In addition to the question of how aggregations change a
2009; Carvalho et al., 2012; and Saal et al., 2013). This                      utility in terms of structure, there is also evidence that the
finding has generated a widespread expectation that aggre-                     input matters. Among the few studies analysing the sources
gation of water utilities leads to higher cost efficiency (see                 of economies of scale, Shih et al. (2006) show that the larg-
World Bank, 2017).                                                             est cost savings from (potential) aggregations would arise
  However, a careful reading of the literature suggests that                   from capital, labour and material costs, and somewhat less
several important qualifications arise. In many cases, dise-                   from energy and outsourced services. Particularly due to
conomies of scale have been reported for (very) large util-                    their large overall share, changes in labour costs represent a
ities. Particularly in countries like the UK and the Neth-                     considerable portion of potential economies of scale. This
erlands, which have very concentrated structures, there                        suggests that reductions in labour costs are a crucial chan-
is discussion on whether utilities have become too large.                      nel for aggregations to achieve cost savings.
Another qualification is that the type of utility expansion                     Overall, the existing literature suggests that despite the
matters for the result. Many state-of-the-art studies – for                    presence of economies of scale, aggregations do not nec-
instance Filippini et al. (2008) – distinguish economies of                    essarily deliver cost savings. To achieve cost savings, the
output density (cost elasticity w.r.t. volume), economies                      aggregations should tend to increase volume rather than

*
 Michael Klien, Austrian Institute of Economic Research (WIFO), michael.klien@wifo.ac.at
1
 We define aggregations as organizational transformations where previously separate utilities are regrouped under a common ownership structure. A physi-
cal connection of the networks is not necessary, and in the cases analysed is an exception rather than the rule.

                                                                  Network Industries Quarterly | Vol. 22 | N°1 | March 2020                                3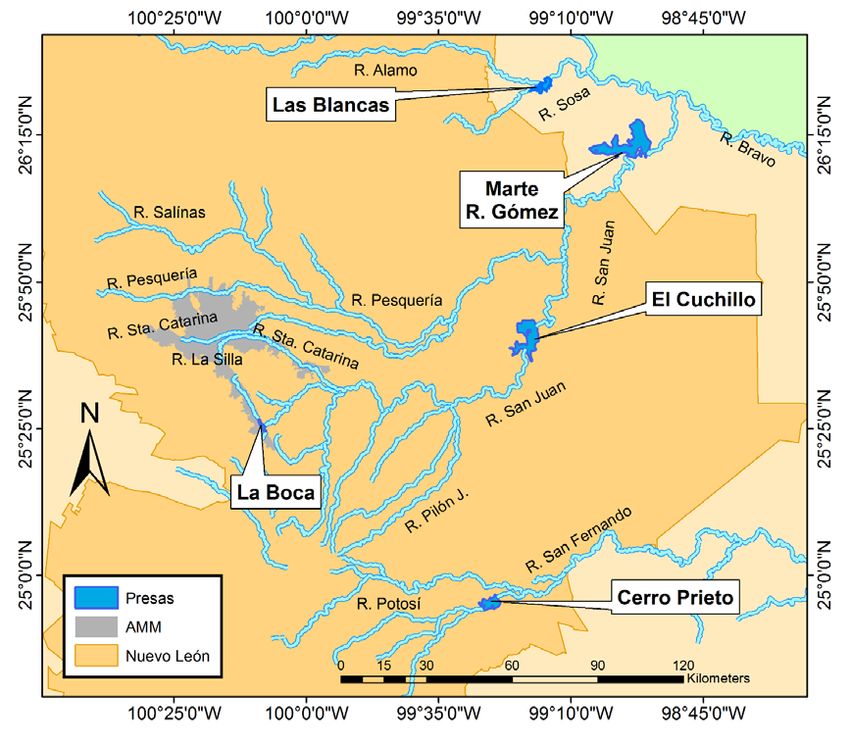
dossier

the service area and reduce the share of labour costs. In       the country level, the following countries exhibit the most
the following section, I try to assess the empirical content    cases of aggregation: Romania (15), Poland (12), Hungary
of these predictions by studying how utilities have been        (6), Kazakhstan (7), Serbia (5), Macedonia FYR (4) and
changed by actual aggregations.                                 the Czech Republic (4). It should be noted, however, that,
                                                                while the bulk are located in this region, 25 countries ex-
 Empirical analysis                                             hibit cases of aggregations that feed into the analysis. For
                                                                further information about the data and their limitations,
 Data                                                           see Klien and Michaud (forthcoming).
  To analyse how aggregations change utilities, I use data
                                                                  Aggregations and utility structure
from the International Benchmarking Network (IBNet)
database. IBNet is a data repository initiated and main-         Aggregations entail the expectation that utilities will grow
tained by the World Bank with the objective of improving        in size. The way aggregations affected the utilities in the
the service delivery of water-supply and sewerage utilities     sample of IBNet data is displayed in Figure 1.
through the provision of international comparative bench-         Looking at the volume per served town, the left-hand
mark performance information.                                   panel shows whether the aggregations were heavier in terms
 The utility coverage by IBNet varies strongly among            of increasing volume or increasing the number of towns
countries, both in terms of the number of utilities and         served. The right-hand panel repeats the same measure for
the population living in the utilities’ service areas. While    customers per town served instead of volume. Both figures
IBNet covers several thousand utilities all over the globe,     strongly suggest that the aggregations added little volume/
the number of aggregations in the database is substantially     customers relative to the area served (measured with the
lower. After cleaning the data and restricting the analysis     number of towns). The main explanation for this finding
to utilities suitable for an evaluation, 79 aggregation cases   is that many of the aggregations involved a large number
remain. Most of those cases occurred in Europe or Central       of small utilities, and hence decreased the network density.
Asia.                                                           This suggests that the design of the aggregations appears to
                                                                have been unfavourable in terms of achieving cost savings.
 Virtually all the aggregations were in the time period from
                                                                Moreover, economies of scale as the standard predictor of
2000 to 2010, with few before and after these dates. At

                                  Figure 1. Aggregations and change in utility structure
                                                      Source: IBNet data
                         Note: Box plots show the 10th, 25th, 50th (median), 75th and 90th percentiles.

                                                      Network Industries Quarterly | Vol. 22 | N°1 | March 2020             4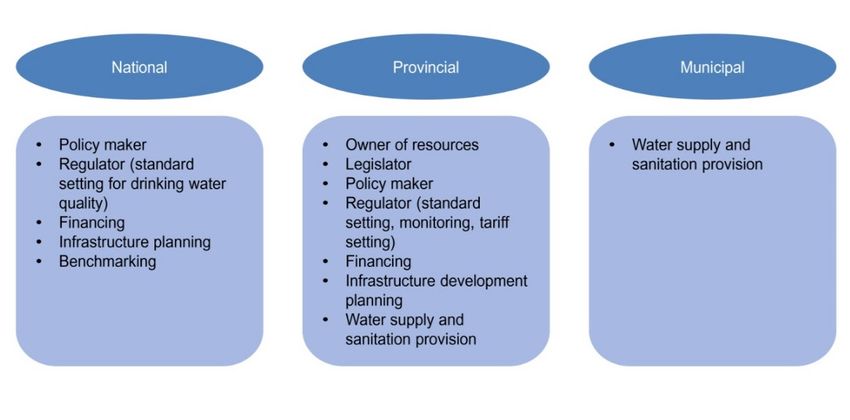
dossier

aggregation effects – which are usually defined as a pro-             or many customers, which would be required to achieve
portional increase in customers, volume and the number                significant cost savings. In contrast, the aggregations ana-
of towns – might be very misleading, as the changes were              lysed typically added many additional (small) towns. That
far from proportional but typically added relatively more             gains from aggregation are hampered by a loss of density
towns.                                                                mirrors findings in earlier literature such as Mercadier et al.
                                                                      (2016) and Urakami and Parker (2011). Second, I do not
 Aggregations and input mix                                           find evidence that the utilities changed their input struc-
  Another issue that calls into question the potential cost           ture following the aggregations. The aggregations in my
savings in the aggregations observed is the evolution of              sample show a slight reduction in energy cost shares, but
the cost structure. Findings from previous literature sug-            no change or even an increase in the share of labour costs.
gest that cost savings should typically be related to low-            While other sources of economies of scale might exist, ag-
er expenditure shares on labour. The data do not suggest              gregations that do not alter the input mix forgo a large
any reduction in the labour share for aggregating utilities.          potential for cost savings.
While all the cost components increase before aggregations             To conclude, the analysis stresses the importance of the
– which might be due to inflation and possibly also some              reform design, which would be an interesting avenue for
short-run transaction costs of the aggregation reform – en-           future research. More important than whether to aggregate
ergy and other costs come to a halt and even decrease after           or not seems to be the way a utility is transformed through
the aggregations whereas labour costs continue to increase.           the reform, and which utilities are affected.
This suggests that the aggregating utilities did not adapt
their cost structures in the way that more cost-efficient util-
ities do. This finding is confirmed by case-study evidence
from Romania suggesting that employment reductions are
a considerable political constraint (see Frone, 2008).

 Conclusion
 The results of this analysis suggest that the aggregations
analysed were not designed in such a way as to facilitate
cost savings. Two explanations are important to under-
stand why the aggregations did not improve utility perfor-
mance. First, the aggregations did not add much volume

                                   Figure 2. Cost components before and after aggregations
                                                          Source: IBNet data
    Note: The blue dots refer to averages in bins of the respective time since/till aggregation. The red line shows lowess smoothing.

                                                           Network Industries Quarterly | Vol. 22 | N°1 | March 2020                    5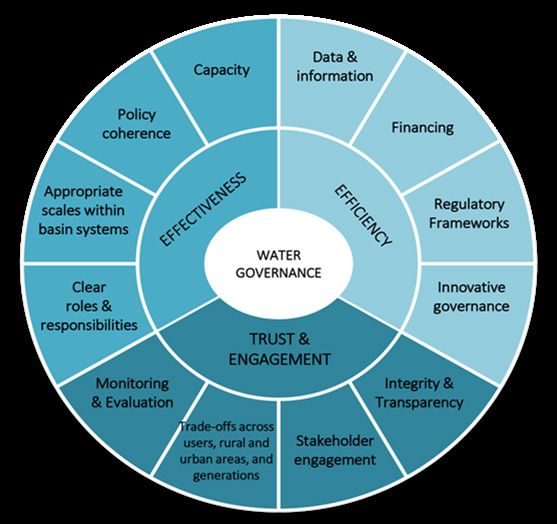
dossier

 References
  Abbott, M. and Cohen, B. (2009). Productivity and ef-
ficiency in the water industry. Utilities Policy, 17(3): 233–
244.
 Carvalho, P., Marques, R. C. and Berg, S. (2012). A me-
ta-regression analysis of benchmarking studies on water
utilities market structure. Utilities Policy, 21: 40–49.
  Filippini, M., Hrovatin, N. and Zoric, J. (2008). Cost
efficiency of Slovenian water distribution utilities: an ap-
plication of stochastic frontier methods. Journal of Produc-
tivity Analysis, 29(2): 169–182.
  Frone, S. (2008). Factors and challenges of regionaliza-
tion in the water and wastewater sector. Romanian Journal
of Economics, 27(2), 36.
 González-Gómez, F. and García-Rubio, M. A. (2008).
Efficiency in the management of urban water services.
What have we learned after four decades of research. Haci-
enda Pública Española/Revista de Economía Pública, 185(2):
39– 67.
 Klien, M. and Michaud, D. (2019). Water utility consol-
idation: Are economies of scale realized? Utilities Policy,
61, 100972.
 Mercadier, A., Cont, W. and Ferro, G. (2016). Econo-
mies of scale in Peru’s water and sanitation sector. Journal
of Productivity Analysis, 45(2): 215–228.
  Saal, D. S., Arocena, P., Maziotis, A. and Triebs, T.
(2013). Scale and scope economies and the efficient ver-
tical and horizontal configuration of the water industry:
a survey of the literature. Review of Network Economics,
12(1): 93– 129.
 Shih, J.-S., Harrington, W., Pizer, W. A. and Gillingham,
K. (2006). Economies of scale in community water sys-
tems. Journal - American Water Works Association, 98(9):
100–108.
 Urakami, T. and Parker, D. (2011). The effects of con-
solidation amongst Japanese water utilities: a hedonic cost
function analysis. Urban Studies, 48(13): 2805–2825.
 World Bank (2017). Joining forces for better services?
When, why and how can water and sanitation service pro-
viders benefit from working together? Global Study WSS
Aggregation. Water Global Practice. Washington D.C.

                                                     Network Industries Quarterly | Vol. 22 | N°1 | March 2020   6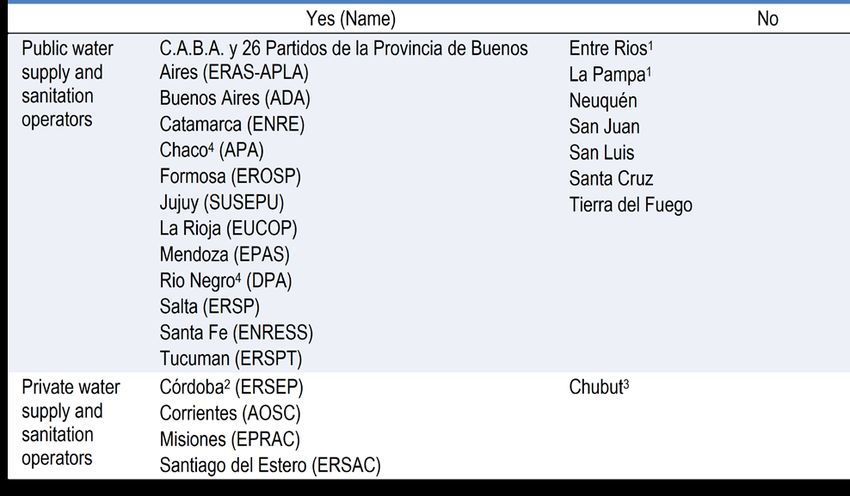
dossier

The Governance of Water and Wastewater Provision in Brazil: Are
There Clear Goals?
Juliana Smiderle*, Morganna Capodeferro**, Pedro Fernandes***, Edson Gonçalves****
Joisa Dutra****

In this paper, we discuss the concentration of state-owned companies as water supply and sanitation service providers in Brazil. We also analyse the
content of the contracts signed between these companies and municipalities to verify the existence of well-defined goals.

    Introduction                                                               initial findings, such as the precariousness of WSS service

G
         overnment-owned water supply and sanitation                           contracts, and offer ideas for further research.
         companies serve most of the urban population in
         developing countries (Marin, 2009). Brazil has                          The water and wastewater provision framework
the same scenario. State-owned companies (SOCs) serve                            We divide the Brazilian WSS sector framework into three
more than 70% of the urban population, even though                             phases: (i) The National WSS Plan - 1970-1990; (ii) WSS
municipalities are responsible for water supply and sanita-                    Federal Law – 2007 until now; and (iii) the current WSS
tion (WSS) services (SNIS, 2018). Private companies are                        Regulatory Reform. Below, we present the main character-
responsible for providing these services to only 7% of the                     istics of each phase and its implications for WSS service
urban population.                                                              provision.
  There is a concentration of WSS service provision in
SOCs due to the sector’s historical evolution. As will be                        The National WSS Plan (PLANASA, 1970-1990)
shown later in this paper, there have been incentives for                        During the Brazilian military period (1964-1985), the
municipalities to delegate WSS services to them since the                      national government defined the expansion of WSS service
1970s. Currently, some barriers hinder private companies                       coverage as a national priority. As a way to tackle this chal-
from entering this market. However, there is a reform un-                      lenge, Decree-law 949 of 1969 authorised the National
der discussion in Congress to change the WSS Federal Law                       Housing Bank (BNH) to apply its resources and FGTS’s1
and allow for openings.                                                        resources to financing operations for the implementation
  The purpose of this paper is to discuss the concentration                    or improvement of WSS systems.
of SOCs as WSS service providers and to explore the con-                        In 1971, BNH implemented PLANASA. The objectives
tent of the contracts signed between these companies and                       of the plan were:
municipalities to verify the existence of goals in these con-
                                                                                “1) to supply, by 1980, drinking water, to more than 80% of
tracts. To achieve these aims, the paper is structured as fol-
                                                                               the urban population in at least 80% of Brazilian cities and
lows. First, we present the sector’s historical evolution and
                                                                               all metropolitan regions;
its implications for WSS service provision. Then, we assess
the WSS service contracts between south-eastern Brazilian                        2) to serve, by 1980, the metropolitan regions, capitals and
municipalities and SOCs. Finally, we comment on some                           larger cities with adequate sanitation services;

*
  Master student at Rio de Janeiro Federal University, Rio de Janeiro, RJ, Brazil. Researcher at the Center for Regulation and Infrastructure Studies (FGV
CERI), Rio de Janeiro, RJ, Brazil. E-mail: juliana.smiderle@fgv.br
**
   Master student at Rio de Janeiro Federal University, Rio de Janeiro, RJ, Brazil. Researcher at the Center for Regulation and Infrastructure Studies (FGV
CERI), Rio de Janeiro, RJ, Brazil. E-mail: morganna.capodeferro@fgv.br
***
    Bachelor student at Getulio Vargas Foundation, Rio de Janeiro, RJ, Brazil. Research intern at the Center for Regulation and Infrastructure Studies (FGV
CERI), Rio de Janeiro, RJ, Brazil. E-mail: pedro.fernandes@fgv.br
****
     Professor, FGV School of Economics, Rio de Janeiro, RJ, Brazil. Researcher at the Center for Regulation and Infrastructure Studies (FGV CERI), Rio
de Janeiro, RJ, Brazil. E-mail: edson.goncalves@fgv.br
*****
      Professor, FGV School of Economics, Rio de Janeiro, RJ, Brazil. Head of the Center for Regulation and Infrastructure Studies (FGV CERI), Rio de
Janeiro, RJ, Brazil. E-mail: joisa.dutra@fgv.br
1
   FGTS is the ‘Guarantee Fund for Time of Service,’ a severance indemnity fund for workers. Companies must pay 8 percent of monthly pay into an
account held in the name of the employee at CEF. The balance is only available on dismissal without cause, retirement, and in certain other situations (for
example, to finance the purchase of housing).

                                                                   Network Industries Quarterly | Vol. 22 | N°1 | March 2020                              7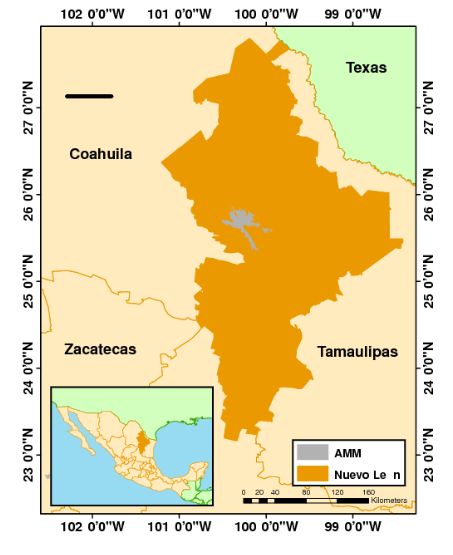
dossier

 3) to provide, as much as possible, simpler sanitation services   region, where the municipalities and the state are jointly
to smaller cities and towns” (De Almeida, 1977).                   responsible for WSS services.
 SOCs were created to distribute PLANASA’s investments               As service holders, municipalities can provide WSS ser-
at the state level. BNH allocated investments with priority        vices by choosing among three options: (i) the provision
to SOCs. Thus, municipalities had an incentive to delegate         may be performed directly by the service holder, which
service provision to SOCs in order to receive investments.         does not need to sign any contract; (ii) the provision may
The objective in adopting this model was to facilitate the         be performed indirectly through delegation to a SOC by
control of loans and to enable financial self-sustainabili-        way of agreement of a “programme” contract (according to
ty through cross-subsidy between municipalities. Con-              the Public Consortia Law – Law No. 11,107 of 2005); or
sequently, SOCs became responsible for providing WSS               (iii) the provision may be delegated to a private company,
services to 70% of Brazilians (Jorge, 1992).                       although it must be done through a concession or PPP
                                                                   contract, with prior bidding and according to the law gov-
  According to Decree-law 949 of 1969, the SOCs should
                                                                   erning each case (Concessions Law – Law No. 8,987 of
submit a proposal annually to the BNH with new tariff
                                                                   1995; and the Public-Private Partnerships Law (PPP – Law
levels. The Ministry of the Interior, the ministry linked
                                                                   No. 11,079 of 2004).
to the BNH, issued the rules regarding the calculation of
tariff levels. Following evaluation by BNH, the Ministry            The current framework is that SOCs are responsible for
of the Interior would decide whether to revise the tariffs         providing water to 72% of the total population with water
charged by SOCs. As it turns out, the BNH and the Min-             access. Although there is legal provision for private part-
istry of the Interior both regulated services at the time.         ners to act as WSS providers, their representativeness is low
                                                                   – only 7%. Municipalities then make the provision for the
 Jorge (1992) states that because of PLANASA, sanitary
                                                                   other 21% (SNIS, 2018).
conditions in urban areas, especially water supply, signifi-
cantly improved. The author estimates that in the 1980s,            In terms of regulation, although it is also a service holder
urban water supply reached 80% of the population. How-             responsibility, it can be exercised at either municipal, re-
ever, the advance in sewage collection was not so signifi-         gional or state levels. It is worth mentioning that the WSS
cant, reaching only 32.4% of the population at that time.          Federal Law determined that the designation of the reg-
                                                                   ulatory entity is one of the conditions for the validity of
 Decree-law 2,291 dissolved BNH in 1986, which brought
                                                                   WSS service contracts. Despite this, less than half of Bra-
the end of PLANASA. Investments in the sector declined,
                                                                   zilian municipalities have a defined WSS service regulator
and advances in WSS service expansion stalled. The insti-
                                                                   (IBGE, 2017).
tutional architecture remained unchanged: SOCs mostly
continued to perform service provision (as they still do).           Currently, 52 competent regulatory authorities regulate
                                                                   WSS services in the country: 25 state entities; 22 munici-
 WSS Federal Law n° 11,445 – 2007 until now                        pal entities; and five regional entities (ABAR, 2019). There
                                                                   is a multi-level governance structure of the Brazilian WSS
 It was only in 2007 that a legal framework for the WSS
                                                                   sector due to its decentralisation.
sector was established, with the enactment of Federal Law
No. 11,445. The law states that the WSS service holder
                                                                    WSS Regulatory Reform
(municipalities) is responsible for the planning, regulation
and provision of these services. Both the regulation and            Given the limited access to WSS – about 33 million Bra-
the provision of the service can be exercised or delegated         zilians still do not have access to the water supply and 95
to another party.                                                  million lack sewage collection (SNIS, 2018) – and the lack
                                                                   of public resources for investment, the federal government
  The WSS Federal Law did not clearly define who the
                                                                   adopted a strategy to open this market to private capital.
holder of the service is (municipality, state or union). Rec-
                                                                   Hence, Congress began discussing a WSS legal framework
ognition of municipalities as service holders already existed
                                                                   reform in 2018 to attract the necessary investment for the
as an interpretation of the Federal Constitution. In fact,
                                                                   universalisation of WSS services.
the Federal Supreme Court only accepted this definition
after the Unconstitutionality Action (ADI) 1,842 case in            Among the proposed amendments, three stand out: (i) to
2015. The interpretation given is that the municipality            establish the National Water Agency (ANA) as the WSS
is the service holder, except in the case of a metropolitan        services regulatory supervisor; (ii) to introduce equal con-

                                                        Network Industries Quarterly | Vol. 22 | N°1 | March 2020             8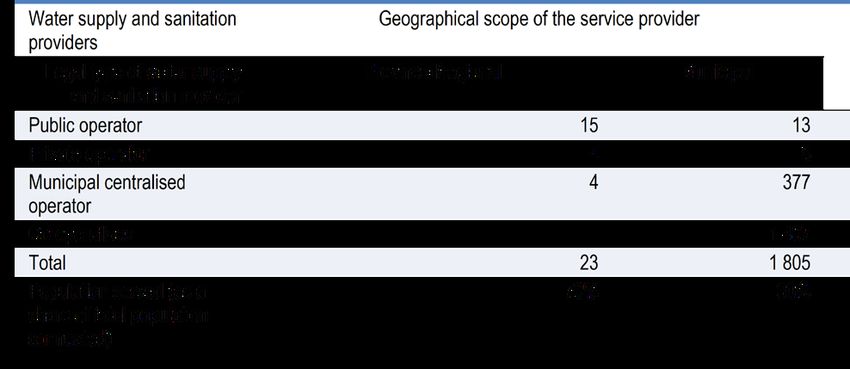
dossier

ditions for competition; and (iii) to incentivise regional-        Our analysis considers well-defined goals to be those
ised provision.                                                   called SMART: specific (S), measurable (M), attainable
  The reform gives ANA the power to create national ref-          (A), realistic (R) and with a given timeframe (T) (Cruz
erence standards to promote uniform WSS service regula-           and Sarmento, 2019).
tion. Municipalities where the regulatory agency follows            We consider that the goals will meet the criteria of speci-
ANA’s reference standards will receive federal funds with         ficity (S) and measurability (M) if the contract includes at
priority.                                                         least one of the following indicators: (i) coverage of water
  Another of the reform’s amendments is a prohibition of          and sewage services; (ii) a reduction of distribution losses;
‘programme’ contracts. Under this amendment, it will              or (iii) expansion of sewage treatment. In addition, we con-
only be possible to renew current ‘programme’ contracts           sider that the goal has a given timeframe (T) if the indica-
once. These renewed contracts will necessarily be adapted         tors have clear deadlines. We cannot evaluate whether the
to meet the same requirements as the concession contracts.        goals are attainable (A) or realistic (R) because this would
After this transition period, the ‘programme’ contracts will      require information regarding the companies’ investment
be completely terminated and any contract signed with the         capacities, which we do not have access to.
municipality must follow the concession contract model.            The analysis covers the ‘programme’ contracts signed
This will guarantee equal conditions for both private and         between the municipalities and companies in the follow-
public service providers. It will no longer be possible to        ing states: Rio de Janeiro (Rio de Janeiro State Water and
hire a SOC without a prior bidding process. This proposal         Sewerage Company – CEDAE); Espírito Santo (Espíri-
is being widely criticised, especially by SOCs, which will        to Santo Sanitation Company – CESAN); Minas Gerais
lose their preference in service provision.                       (Minas Gerais Sanitation Company – COPASA); and São
  Finally, regionalised provision is incentivised by prioritis-   Paulo (São Paulo State Basic Sanitation Company – SABE-
ing access to federal investment. Regionalised provision          SP). These companies serve respectively 70%, 67%, 68%
occurs when a group of municipalities delegates the pro-          and 57% of the municipalities in the states (SNIS, 2018;
vision of their services to one company by signing only           IBGE, 2018).
one contract. States will form these groups of municipal-          Table 1 summarises the number of municipalities served
ities (or blocks) to generate scale gains and guarantee the       by these SOCs and the sample of municipalities whose
technical and economic-financial viability of WSS services.       contracts we access and analyse. It is worth noting that it is
The advantage offered by this regionalised arrangement is a       possible to provide WSS services without a formal instru-
simplification of sector governance.                              ment of delegation (contract).
 We conclude that the main proposals are moving towards
a centralised approach as they attribute more capability to
the union and the states. There are two main reasons for
moving towards this model. First, the technical capacity
of the municipalities is less than that of the states and the
union and, second, the main financier of the sector is the
federal government.

    Contract assessment
  To contribute to the discussion on sector reform, we turn
our attention to ‘programme’ contracts, aiming to answer
the following question: what do we mean by ‘programme’
contracts? The focus of our analysis is on verifying the                 Table 1. Summary of the contracts analysed
existence of well-defined contractual goals in the existing                         Source: SNIS (2018)
‘programme’ contracts in south-eastern Brazil. Around
42% of Brazilians live in this region (IBGE, 2018), and           Figure 1 shows the results of our analysis. According to
53% of Brazilian GDP is concentrated there (IBGE,                 the definition adopted, on average 55% of the contracts
2017).                                                            accessed in the south-eastern region lack well-defined goals.2

*
    See FGV CERI (2019).

                                                       Network Industries Quarterly | Vol. 22 | N°1 | March 2020              9
dossier
Concluding Remarks and Further Research
The concentration of SOCs as WSS service providers is
historical as investments were allocated to them with pri-
ority during the PLANASA period. The barrier imposed
on the entry of private companies into the market fosters
the maintenance of this situation. SOC hiring is facilitated
by the bidding waiver.
The governance of the WSS sector in Brazil is multi-level
because of its allocation of responsibilities to each munic-
ipality. This adds complexity to the governance of WSS
service provision and can be an obstacle to development of
the sector. The sectorial framework reform is an attempt to
drive the sector towards universal access to WSS services
for the entire population.
Figure 1. Panorama of the existence of well-defined goals
in contracts signed between SOCs and south-eastern Our preliminary analysis of ‘programme’ contracts shows
Brazil municipalities the difficulty in public access to these contracts, and also
Source: Authors’ own compilation their precariousness. From 2007, every contract should
have had well-defined goals. We recognise that some of
The companies in São Paulo and Espírito Santo States are the companies analysed partially advanced by including
among those with the highest proportion of contracts with clear goals in their contracts after 2007, but not all. The
well-defined goals – approximately 80%. One hypothesis lack of well-defined goals makes it difficult to monitor the
is that their contracts are, on average, more recent. This provision of WSS services. Without goals, there is no way
hypothesis is relevant as the WSS Federal Law (Article 11) to verify compliance.
establishes the existence of contractual goals as a condition In this paper, we have only analysed contracts, although
for the validity of contracts. Of the São Paulo state compa- we recognise that they are only one of the instruments that
ny’s contracts that we analyse, 83% of them were signed af- promote quality in service provision. We also recognise
ter 2007. This was the same year that the WSS Federal Law that the regulator can raise standards leading to progres-
was enacted. We find that all the contracts signed within sive expansion and increased quality of services. Lastly, it
the legal framework contain well-defined goals. is worth mentioning that there is a duty of legal regulation
In the case of the Espírito Santo state company, 93% of to guarantee compliance with the conditions and goals es-
the contracts accessed were signed after 2010. A striking tablished in contracts.
detail is that more than half of them were signed in the last For further research, we wonder about the existence of a
two years. The contracts demonstrate efforts to regularise benchmarking contract and the enforcement of them. Do
service provision during the WSS reform discussion. regulators verify the achievement of the goals agreed in the
The Rio de Janeiro state company finds itself in a worse contracts? Do regulators impose penalties when the goals
position as in almost all the contracts analysed it does are not met? Do they offer bonuses that encourage the ser-
not have well-defined goals. The result is not compatible vice providers to pursue the achievement of these goals?
with the fact that 73% of these contracts were signed after These are questions that we aim to answer with a broader
2007. This highlights the company’s non-compliance with research agenda regarding Brazilian WSS governance and
the legal provision. In general, this company’s contracts do regulation.
have a target plan attached but it does not fit the definition
used in this analysis.
In the case of the Minas Gerais state company, more than
60% of the contracts accessed were signed prior to the
WSS Federal Law, which may partly explain the absence
of well-defined goals. Overall, 87% of the contracts signed
after 2007 have well-defined goals.
Network Industries Quarterly | Vol. 22 | N°1 | March 2020 10dossier
References
FGV CERI (2019), Research Teaser: 55% dos contratos fir-
mados entre Companhias Estaduais de Saneamento Básico e
municípios na região Sudeste carecem de metas bem definidas.
Available at: https://ceri.fgv.br/sites/default/files/publica-
coes/2019-12/Contratos_de_Programa_2.pdf
Marin, P. (2009), ‘Public-private partnerships for ur-
ban water utilities: a review of experiences in developing
countries’, World Bank, , accessed 10 February 2020.
SNIS (2018), ‘Sistema Nacional de Informações sobre
Saneamento,’ , accessed 10 February 2020.
De Almeida, W.J.M. (1977), Abastecimento de água à po-
pulação urbana: uma avaliação do PLANASA (IPEA/IN-
PES).Jorge, W.E. (1992), ‘A Avaliação da Política Nacional
de Saneamento Pós 64,’ Revista do Programa de Pós-Grad-
uação em Arquitetura e Urbanismo da FAUUSP.IBGE
(2017), Pesquisa de Informações Básicas Municipais.ABAR
(2019), Anuário Regulação Saneamento Básico.
IBGE (2018), ‘Estimativa da população,’ , accessed 10
February 2020.
IBGE (2017), ‘Produto Interno Bruto’, , accessed 10 February 2020.
Network Industries Quarterly | Vol. 22 | N°1 | March 2020 11dossier
The Contextual and Jurisdictional Framework for Metropo-
litan Water Provision in Mexico: The Case of the Monterrey
Metropolitan Area
Ismael Aguilar-Barajas*, Aldo I. Ramírez**
This contribution addresses the good provision of water services – drinking water and sanitation – in Monterrey, a major Mexican metropolis. It is
argued that this experience is contextually based and, therefore, not easy to replicate elsewhere. An urban-region system framework is required in order
to understand the key interactions involved. This case study confirms that is possible to divide basin waters and share the benefits.
Introduction MMA’s water supply is therefore of regional and national
U
rbanisation is expanding at high rates, especial- interest.
ly in the less industrialised world. The effective
provision of water services – drinking water and
sanitation – is a key challenge to keep up with this accel-
erated growth. In this context, the search for good prac-
tices is highly relevant. The Monterrey Metropolitan Area
(MMA) in Mexico offers good insights in this regard. This
metropolis is considered a good national and Latin Amer-
ican reference. This contribution argues that its experience
is contextually based and that therefore it is difficult to
replicate elsewhere. Furthermore, a proper understanding
of the supply of drinking water requires an urban-region
system framework so that major interactions are recog-
nised and analysed. Growing urbanisation will accentuate
transfers of water from rural to urban areas. In this regard,
the lessons derived from the MMA and the reallocation of
water based on the El Cuchillo dam demonstrates that this
process needs to be designed and assessed from a holistic
perspective to identify, measure and share the costs and
benefits. This case study confirms that is possible to divide
waters and share the benefits.
The case of the Monterrey Metropolitan Area and its
significance in the local and national contexts
The Monterrey Metropolitan Area (MMA) is a rapidly
growing semi-arid urban centre in north-eastern Mexico Figure 1. Location of Monterrey Metropolitan Area,
and a major economic hub in the country (Gobierno Nue- MEXICO
vo León, 2019) (Figure 1) This metropolis, which includes Source: Aguilar et al, (2015)
13 municipalities, is the historical birthplace of several
Mexican multinationals of global significance. With a pop- The MMA is often mentioned as a reference with re-
ulation of 4.5 million and a tradition of entrepreneurship, gard to good provision of water services, notwithstanding
MMA has established itself as a preponderant destination the fact that it faces a relatively dry climate (with a mean
for foreign direct investment in Mexico and is only second precipitation of 622 mm/yr). The MMA has a limited lo-
to Mexico City. The city has been a major actor in the cal and regional availability of natural water sources, and
North American Free Trade Agreement (NAFTA) and will recurring episodes of both droughts and hurricanes. The
certainly have an important role to play in the new United Monterrey Water Authority (Servicios de Agua y Drenaje
States-Mexico-Canada Trade Agreement (USMCA). The de Monterrey, SADM – a public sector institution estab-
*
Ismael Aguilar-Barajas, Tecnologico de Monterrey, MEXICO, iaguilar@tec.mx
**
Aldo I. Ramírez, Tecnologico de Monterrey, MEXICO, aldo.ramirez@tec.mx
Network Industries Quarterly | Vol. 22 | N°1 | March 2020 12dossier
lished in 1956), is the institution responsible for providing nized that the good performance of SADM is connected
water services to Monterrey. SADM is a pioneering organi- to a strong programme of investments undertaken over
zation in Mexico. several decades. The rating takes into account a compre-
The MMA is one of the few locations in Latin America hensive framework, and not only economic and financial
that provide its inhabitants with 24/7 water services and considerations. For example, the analysis of water sources
treats 100% of its wastewater stream. In 1954, 55% of and the institutional setting play important roles.
the MMA’s half a million inhabitants had access to piped
water at home; today over 99% of the population (over The particular institutional framework of Servicios de
eight times more) enjoy the service. Between 1954 and Agua y Drenaje de Monterrey
2017, water supply to the metropolis increased 16-fold, The MMA presents particularities, especially with regard to
from 25 to 400 million cubic meters (MCM) a year (Agui- its institutional architecture, that at least partially explains its
lar-Barajas and Ramírez, 2020). In terms of users (i.e. con- success. SADM is a state entity and serves the MMA through an
tracts), in 1989 there were 477,249; at the end of 2017 the integrated metropolitan system, an arrangement that has proven
number had multiplied almost three times to 1,409,517 both efficient and cost-effective. This has been possible thanks
users (this corresponds to approximately 4.5 million peo- to SADM´s 1997 Water Law. This contrasts with most munici-
ple) – an increase of 195 per cent. SADM achieved this palities in Mexico, which according to Article 115 of the Mexican
by developing multiple water sources (both surface and Constitution are responsible for water services. In the majority
ground) and massively increasing the size and reach of its of cases they lack the resources to do this effectively. Their nar-
conveyance and distribution infrastructures. SADM is one rower mandate (only three years versus six years in the case of
of the few water authorities in Mexico generating yearly SADM) does not help either. In the case of the MMA, in the
operating surpluses. Since 2007, SADM has met the na- past some metropolitan municipalities wanted to provide
tional norms for water quality with rates of 97 to 99%. Its the services themselves but cancelled their requests when
water is perfectly fine for human consumption. SADM has they found out the complexity of doing so. This indicates
a 24/365 call centre to service water users. The institution pro- that scale is crucial in the provision of metropolitan water
duces an indicator named Quality of Attention to Customers’ services.
Complaints. This indicator, which measures the percentage of
SADM has a management board with a strong involve-
complaints that are resolved to the user’s satisfaction, has been
ment of the private sector. This is a unique experience in
maintained at around 99%.
Mexico, and surely also in the Latin American context.
From the national perspective, SADM provides This institutional arrangement provides SADM with a rel-
the MMA with good water services (CCA, 2011; IMCO, atively good degree of independence from local and state
2014; Fitch Ratings, 2018). The results of the 2017 Nation- political authorities. This has several advantages. Unlike
al Survey of Quality and Governmental Impact (ENIGH, many operators in Mexico, the Monterrey Water Author-
2017) rank Nuevo León as number one in the country. In ity has the capacity to set water rates, in most times away
comparison with other local water authorities, SADM has from the sphere of politics. This has aided its sound finan-
more management independence, a greater scale of provi- cial situation. Furthermore, the institution’s directors and
sion of services and finance sustainability (IMCO, 2014). In managers tend to stay in office much longer than is the
fact, a report by the Mexican Institute of Competitiveness case elsewhere, where the 3-year municipal political cycle
(IMCO) considers SADM a case study, the best practices impedes the accumulation of organizational and manage-
of which should be followed by others. However, IMCO rial experience.
also makes it clear that the particularities of the Monterrey
case would make this replication difficult. Two examples are The regional jurisdictional framework that governs
provided: the state mandate and the high concentration of water supply in the Monterrey Metropolitan Area
population in the state of Nuevo León in MMA.
The regional and jurisdictional framework in which water
The SADM credit rating by Fitch Ratings underlines the services are provided is more complex than is common-
existence of distinctive characteristics with regard to oth- ly thought. The MMA´s governance mechanisms related
er cities, such as its geographical location in a semi-desert to water allocation within the San Juan basin – where the
climate, a state mandate, a prosperous metropolis of 4.5 MMA is situated – link the local arena to the binational
million people, over 1.4 million users and a management scale (with the Unites States) in ways that are not usually
board with public-private participation. It is also recog- known, even by some authorities and professionals work-
Network Industries Quarterly | Vol. 22 | N°1 | March 2020 13dossier
ing in the field (Figure 2). The urban system perspective An issue worth highlighting is that under the 1944 In-
(Bourne and Simons, 1978) provides a good conceptual ternational Treaty signed between Mexico and the United
framework for understanding the interconnections be- States the waters of the San Juan basin, where Monterrey
tween the metropolis and its surroundings, which include is located, are 100% Mexican waters and therefore are not
agricultural activities in the neighbouring state of Tamauli- officially considered in the deliveries to the US. Howev-
pas, and more particularly in Irrigation District 026. The er, in practice and due to difficult political circumstances,
District is irrigated mainly by waters from the MRG dam, Mexico has used part of these waters to comply with the
which in turn receives water from upstream sources, in- Treaty. This occurred in 2005 and more recently in Febru-
cluding the El Cuchillo dam, treated water from the MMA ary 2020. This shows the complexity of the issues at hand.
(through the Pesquería River), the Las Blancas dam and For Monterrey, it basically means an external pressure on
even the Río Bravo. As the San Juan river is a tributary of its sources of water.
the Rio Grande/Río Bravo basin which is shared by the
states of Chihuahua, Coahuila, Nuevo Léon, Tamaulipas Concluding remarks
and Texas – it has direct links with binational waters.
In view of its high relevance to the national economy, se-
The operating rules of El Cuchillo, the main surface source curing water for today and the future of Monterrey should
of water for Monterrey, which provides around one fifth (or be a matter of national interest. The construction of the
2.5 m3 per second) of all the supply, reflect very clearly a re- reservoirs that supply water to the city was based on this
gional dimension in the allocation of water. Water extractions premise. The metropolis is an excellent national (and Lat-
from this dam to the MMA and the MRG dam are based in American) reference when it comes to the provision of
on a 1996 Agreement. This accord was signed by the Na- good water and sanitation services. There are certainly les-
tional Water Commission and the states of Nuevo León and sons behind this provision – like the need for vision and
Tamaulipas. According to the National Water Law, the 1996 permanent innovation together with a functional institu-
Agreement established that the operation of these reservoirs tional framework. Paradoxically, the very existence of these
is under the control of the National Water Commission. The ingredients makes it very difficult to replicate this experi-
agreement states that every October there will be an analysis ence elsewhere. At least, this should be done with caution.
of the regional system, in which a transfer of water from El
On the other hand, the water supply to Monterrey is
Cuchillo to the MRG dam takes place if the first reservoir has
framed within a complex regional and jurisdictional frame-
more than 315 Mm3 and the MRG dam contains less than
work that needs to be understood in debates about the re-
700. It was also agreed that Monterrey would send an annual
gion´s water future. The notion of an urban system is use-
minimum volume of 189 Mm3 through the Pesquería River.
ful, so linkages with agricultural activities downstream are
properly considered in this system, which also includes the
management of binational waters with the United States.
Water reallocation from the El Cuchillo dam has been
key in securing the water supply to MMA. The main lesson
from El Cuchillo is, in fact, that water reallocation needs
to be designed and assessed in a systemic regional context
to track the changing costs, benefits and mechanisms for
sharing water (Aguilar and Garrick, 2019). On balance,
this case study shows that it is possible to divide water and
share the benefits, which is precisely one of the major les-
sons from a four-nation study – Mexico and El Cuchillo
being one of them – commissioned by the World Bank
(Garrick et al 2019). This is a major finding which paves
the way for further academic and policy discussions.
Acknowledgments
Figure 2. Regional hydrography of the Monterrey We are grateful to Mexico´s National Coun-
Metropolitan Area cil for Science and Technology (Conacyt-FORDE-
Source: Aguilar-Barajas and Ramírez (2020) CYT/12SE/2018/11729-05) for financial support
Network Industries Quarterly | Vol. 22 | N°1 | March 2020 14dossier
IMCO (Instituto Mexicano de la Competitividad) (2014),
Guía para la Creación de Organismos Metropolitanos de Agua
References Potable y Saneamiento en México, México, D.F., Instituto
Mexicano para la Competitividad, A.C. y Embajada Británi-
Aguilar-Barajas, I., Sisto, N., Ramírez, A.I. (2015), Agua ca en México. Available at: https://imco.org.mx/wp-content/
para Monterrey: Logros, Retos y Oportunidades para Nuevo uploads/2014/03/AguaPotable.pdf Accessed 27/12/2018.
León y México (Monterrey: APP for Tecnológico de Monterrey,
Water Center for Latin American and the Caribbean and In-
ter-American Development Bank).
Aguilar-Barajas, I, Sisto, N.P., Ramírez, A.I., y Magaña-Rue-
da, V (2019). “Building Resilience and the Co-production
of Knowledge in the face of extreme weather events: lessons
from Hurricane Alex, Monterrey Metropolitan Area (Mexi-
co),” Environmental Science and Policy 99, pp. 37-47. https://
doi.org/10.1016/j.envsci.2019.05.021
Aguilar Barajas, I. and Garrick, D. (2019), “Water Re-
allocation in Mexico: A Systemic Analysis of El Cuchillo
Dam,” Water Security, 8. https://doi.org/10.1016/j.wa-
sec.2019.10036.
Aguilar-Barajas, and Ramírez, A.I. (2020, in press), Agua
para Monterrey: Logros, Retos y Oportunidades para Nuevo
León y México, 2nd edition, Tecnologico de Monterrey.
Bourne, L., Simmons, J.W. (1978), Systems of Cities: Read-
ings on Structure, Growth and Policy (New York: Oxford Univer-
sity Press).
CCA (Consejo Consultivo del Agua, A.C.) (2011),
Gestión del Agua en las Ciudades de México: Indicadores de
Desempeño de los Sistemas de Agua Potable, Alcantarillado y
Saneamiento. Available at: http://www.aguas.org.mx/ Ac-
cessed on 10/06/2018.
ENIGH (2017), Encuesta Nacional Ingreso Gasto de los
Hogares, Aguascalientes, INEGI.
Fitch Ratings Mexico (2018a). Servicios de Agua y
Drenaje de (SADM). Reporte de Calificación. Available at
https://www.fitchratings.com/site/re/10018803. Accessed
14.09.2019.
Garrick, D., De Stefano, L., Turley, L., Jorgensen, I.,
Aguilar-Barajas, I., Schreiner, B., de Souza Leão, R., O´-
Donnell, E. and Horne, A. (2019) Dividing the Waters,
Sharing the Benefits: Lessons from Rural-to-Urban Water Re-
allocation. World Bank Water Global Practice Discussion
Paper, June. Available at http://documents.worldbank.
org/curated/en/383181561530825618/Dividing-the-Wa-
ter-Sharing-the-Benefits-Lessons-from-Rural-to-Urban-Wa-
ter-Reallocation. Accessed 01.07.2019.
Gobierno Nuevo León (2019), “Data Nuevo León,” Avail-
able at www.nl.gob.mx/conoce-data-nuevo-leon Accessed
26.01.2019.
Network Industries Quarterly | Vol. 22 | N°1 | March 2020 15dossier
Mapping and Strengthening Water and Sanitation Service
Regulation in Argentina: from Diagnosis to Policy Recom-
mendations
Maria Salvetti, Aziza Akhmouch, Antonio Cañamas-Catala*
This article draws on a broader work on water governance in Argentina led by the OECD jointly with the Secretariat
of Infrastructure and Water Policy of Argentina. It builds upon a one-year policy dialogue with 200+ stakeholders from
public, private, non-profit sectors and representatives from across all levels of government in Argentina, which concluded
with the publication of a report on Water Governance in Argentina (2019).
Water and sanitation services (WSS) regulation in Argentina has been analysed using the OECD Water Governance
Principles (Figure 1) as a reading template which provides a framework to understand whether water governance
arrangements are performing optimally and help to adjust them where necessary.
The legal and institutional framework for water and sanitation services was transferred to the 23 provinces of
sanitation services in Argentina Argentina. In 1994, Argentina underwent a constitutional
reform that introduced an environmental provision (Arti-
The present legal and institutional setting cle 124) acknowledging the historical right whereby the 23
T
provinces and the autonomous city of Buenos Aires own
he current legal and institutional setting for WSS
their water and have jurisdiction over it. From then on,
in Argentina is rooted in decades of decentrali-
they were therefore responsible for the provision of wa-
sation and constitutional reforms. In 1980, with
ter services within their own boundaries. Article 41 states
the decentralisation of the state-owned Obras Sanitarias
that the national state may dictate minimum standards of
de la Nacion (ONS) the provision of drinking water and
quality and protection, which can be supplemented by the
provinces. This means that the national government can
establish a national water policy, strategy, programme or
plan, but needs the support of the provinces to implement
it (Figure 2). In practice, there is no national water law,
and each of the 23 provinces and the city of Buenos Aires
have their own water legislation, both for resources man-
agement and for WSS.
Figure 1. OECD Principles on Water Governance Figure 2. The allocation of responsibilities regarding
Source: OECD (2015d) water and sanitation services, Argentina
Source: OECD (2019b)
*
The Water Governance Programme advises governments at all levels on how to design and implement better water policies for better lives. Water gov-
ernance, defined as the set of rules, practices, and processes through which decisions for the management of water resources and services are taken and
implemented, and decision-makers are held accountable, plays a key role in contributing to the design and implementation of such policies.
OECD Water Governance Programme corresponding author: aziz.akhmouch@oecd.org
Network Industries Quarterly | Vol. 22 | N°1 | March 2020 16dossier
The national level The subnational level
Since the recent elections held in Argentina in Octo- The most frequent institutional organisation structure
ber 2019, the Ministry of Public Works has the sectoral at the provincial level consists of a body responsible for
competence for WSS policy at the national level. Within sector-based planning and revenue collection (provincial
this ministry, the Secretariat for Infrastructure and Water ministry, secretariat or undersecretary) and a regulatory
Policy (SIPH) establishes the national policy and planning body for WSS. When there is no economic regulator, as is
for water and sanitation services and decides the national the case in eight provinces (Table 1), the regulatory func-
financial resource allocation to and within the sector. tions are exercised by provincial water administrations.
In particular, the SIPH is the enforcement authority for Economic regulators are generally responsible for regulat-
the regulatory framework for water and sewer services pro- ing all the water and sanitation operators within a province
vided by Agua y Saneamientos Argentinos SA (AySA)., or territory, including municipal operators and coopera-
which is a public limited company owned by the state tives, and generally apply the same regulatory framework
(90%) and by the employees’ union (10%). Currently across all the operators. However, the regulatory frame-
AySA provides services to the capital of Buenos Aires and works provide limited economic efficiency incentives to
26 municipalities in Greater Buenos Aires. operators as financial operating cost recovery is generally
Two further self-governing bodies, the Water and Sani- sought through tariff increases, not efficiency gains. Fur-
tation Regulatory Entity (Ente Regulador de Agua y San- thermore, other financial and institutional incentives gen-
eamiento, ERAS) and the Planning Agency (Agencia de erally focus on short-term investment and solutions which
Planificación, APLA) respectively have the functions of can close gaps in access to services – there is no longer-term
service provision control (including pollution control of focus.
water discharge) and review/validation of investment plan- WSS are generally provided by provincial companies
ning by liaising with the municipalities and concession- which cover the main cities in the provinces (except for the
aires, and monitoring the execution of works. provinces of Chubut, Entre Ríos and La Pampa, where ser-
vices in the main cities are provided by municipal entities
and cooperatives). In many small localities and local com-
munities, services are provided by the municipal adminis-
tration, user cooperatives or community entities (Table 2).
Regulatory functions in water and sanitation services
in Argentina
Regulatory functions in WSS encompass economic, en-
vironmental and social aspects. They can be shared among
Table 1. The existence of provincial regulatory
authorities, Argentina
Source: SIPH (2016)
Notes: 1. Predominantly municipal. 2. Only the Córdoba
drinking water service; other water and sanitation services
are operated by municipalities and/or cooperatives.
3. Predominantly co-operatives, with one regulator for the Table 2. Scale and number of water supply and
city of Trelew. 4. Regulatory functions exercised by water sanitation providers, Argentina
directorates. Source: SIPH (2016)
1
Prior to the October 2019 elections in Argentina, the SIPH used to be within the Ministry of the Interior, Public Works and Housing which has now
been split into two ministries: the Ministry of the Interior and the Ministry of Public Works.
Network Industries Quarterly | Vol. 22 | N°1 | March 2020 17You can also read