INDONESIA COUNTRY REPORT - CLIMATE VARIABILITY AND CLIMATE CHANGES, AND THEIR IMPLICATION
←
→
Page content transcription
If your browser does not render page correctly, please read the page content below
INDONESIA COUNTRY REPORT

    CLIMATE VARIABILITY AND
   CLIMATE CHANGES, AND THEIR
          IMPLICATION

GOVERNMENT OF REPUBLIC OF INDONESIA

             JAKARTA

               2007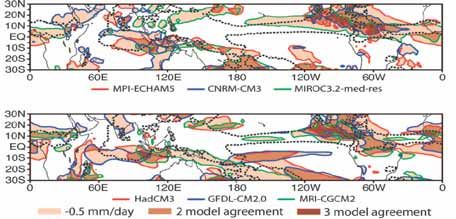
INDONESIA COUNTRY REPORT

  CLIMATE VARIABILITY AND
 CLIMATE CHANGES, AND THEIR
        IMPLICATION

GOVERNMENT OF REPUBLIC OF INDONESIA

             JAKARTA

               2007
Published by:
Ministry of Environment
Republic of Indonesia
Jl. D. I. Panjaitan Kav. 24
Jakarta Timur 13410
Indonesia

© Ministry of Environment, 2007

Any part of this publication may be produced and quoted with a proper quotation
suggested below.

Suggested Quotation:

MoE. 2007. Indonesia Country Report: Climate Variability and Climate Change,
and their Implication. Ministry of Environment, Republic of Indonesia, Jakarta.

A catalog record of this publication is available from Perpustakaan Nasional
Indonesia.

ISBN: 978-979-8362-92-7

Coordinating Lead Authors:
Rizaldi Boer, Sutardi and Dadang Hilman

                                            ii
FOREWORD FROM
                NATIONAL FOCAL POINT TO THE UNFCCC

The Intergovernmental Panel on Climate Change (IPCC) concludes that global
warming over the past 50 years was mainly caused by human activities that have
increased atmospheric concentrations of greenhouse gases. Over recent years, it is
quite clear that the El Niño events have become more frequent as the global
temperature anomalies associated with each El Niño continue to increase. This
means that the extreme regional weather and climate anomalies associated with El
Niño are being exacerbated by increasingly higher temperatures.

Extreme weather and climate events cause serious floods, drought and wild fires in
Indonesia. Many reports showed that these events have caused serious impact on
Indonesian economy and human living. Wild fire occurred in El-Nino 1997 has
caused huge economic loss and damaged people’s livelihoods – increasing poverty
rates by one-third or more. Drought occurred in 1972 has also impacted millions of
people. Flood occurred in early February 2007 which lasted for about 22 days also
affected thousands of people and destroyed about 1,500 houses. Flood hazards have
become common in many part of Indonesia regions. In the period 2001-04, about
530 floods were reported, occurring in almost all provinces. The scale of damage is
also increasing.

This country report describes impact of climate variability and climate change on
various sectors in Indonesia and be considered as one of official document of
Government of Indonesia that contains the most updated information related to
climate variability and climate change. Part of this report has been presented in the
International Workshop on Water and Climate on 23-24 May 2007 at Hotel
Kemang, Jakarta which was organized by the State Ministry of Environment and the
Ministry of Public Works of Republic of Indonesia supported by the Dutch
government and in partnership with among others, i.e. Partners for Water
(Netherlands), Wetlands International, World Bank, UNESCO and WMO.

This report has been prepared with support from many agencies. On behalf of the
Government of Indonesia I would like to welcome and endorse this report to wider
audience. Feedback and comments will definitely be appreciated in order to improve
and updated this report in the future. Let me take this opportunity to extend my
sincere gratitude and thanks to authors, reviewers, contributors of this report, who
have made the publication possible.

Special     thanks    are     extended     to    Ton Bresser      from   UNESCO-
IHE Institute for Water Education, BertJan Heij from Netherlands Environmental
Assessment Agency and Hank van Schaik from Co-operative Programme on Water
and Climate who have assisted in editing this report. Acknowledgement also
extended to Bayu Krisnamurti, R.W. Triweko, Guy Alaerts, Raymond Kemur, and
Jan Verhagen who have provided written comments and inputs for the improvement
of the report, and to all participants of the Joint International Water and Climate
Workshop for their valuable comments. Finally, our appreciation to the United

                                            iii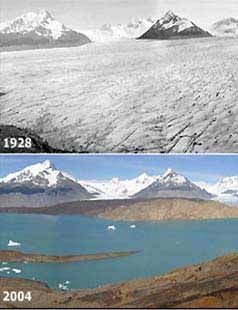
Nations Development Program (UNDP) who has provided fully support in the
process of finalizing and producing the report.

Finally, it is hoped that this report can be one of references showing to the global
community how climate variability and climate change has impacted developing
countries and what would be the implication if no serious efforts are taken from now
to adapt to climate change.

                                                            Jakarta, December 2007

                                                               Masnellyarti Hilman

                                Deputy Minister III for the Minister of Environment
                                             National Focal Point to the UNFCCC

                                            iv
FOREWORD FROM THE

                 Ministry of Environment, Republic of Indonesia

Understanding the historical interactions between society and climate hazards,
including adaptations that have evolved to cope with these hazards is a critical first
step in developing adaptations to manage future climate risks. Past experiences and
lessons learned in addressing climate risks need to be documented as this
information is important in developing successful adaptation strategies to climate
change. Adaptation will be more successful if it accounts for both current and future
climate risks. Even if future adaptation strategies would need to be very different
from those currently in use, today’s adaptation strategies will allow us to refine the
approaches needed in the future. Starting with adaptation to current climate
variability with building in additional safety margins for future climate changes is a
cost-effective and “no regrets” approach.

Long historical climate data record as well as reliable information on impacts of past
and present variable climates is essential for developing adaptation plans. Studies
and analysis to understand how the current system behaves to past and present
climate variability and what changes should be done and planned to the system to
increase the coping range of the system to future climate, are the urgent actions in
developing the adaptation programs.

This country report is one of important references that provide information on
impact of climate variability and climate change on a number of major sectors in
Indonesia.

Last but not least, I hope this report can provide a glance how climate variability has
impacted Indonesia and how future climate may look like and its implication on
sectors. And the information contained in this report could meet our current needs
on information based on scientific activities that is still lacking in this country.

                                                              Jakarta, December 2007

                                                           Minister of Environment,
                                                              Republic of Indonesia

                                                                    Rachmat Witoelar

                                              v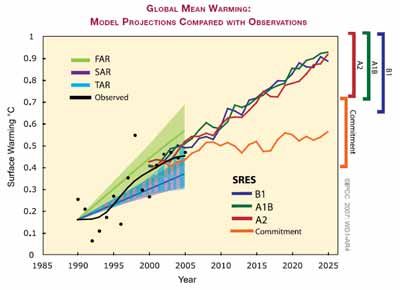
FOREWORD FROM THE

                Ministry of Public Works, Republic of Indonesia

Water is fundamental to human well-being, socio-economic development and the
healthy evolution of ecosystems. In many countries, including Indonesia, water
access and management is a constant challenge. Climate variability and/or climate
change is likely to pose an additional burden on water resources and their
management, especially in areas where water resources are already under stress due
to meteorological and upper-watershed conditions and demand pressure from
society. Increased intensity and frequency of storms, drought and flooding, altered
hydrological cycles and precipitation variance have implications for future water
availability for various uses and sectors, i.e., water supply, agriculture, human
health, human settlements, industry, hydro power, fishery, tourism, environmental,
etc. In addition to that, the increased of number infrastructure and property damages
as well as human injured and loss due to water related disasters are observed for the
last ten years. To address these challenges and adapt water management to changing
climatic conditions, it is necessary to ensure that the current meteorological trends
and information on the future water availability and demands are taken into account
in the process of water resources management and policy development. This
information ideally should be synthesized in a country report.
This country report which was developed by the Inter-sectoral Working Group that
was formed by The Minister of Public Works Decree No: 239/KPTS/M/2007, dated
27 April 2007 was intended to be a reference document that provide information on
the extend of climate hazards, their impacts and their trends of impact in the future
to related sectors for the participants of the Joint International Water and Climate
Workshop in May 2007 in Jakarta. During the workshop the country report was
presented in order to receive comments and inputs for its improvement. The final
version of the country report which already have accommodated most of the
comments and the inputs for improvement and finalized through intensive
discussion within the Inter-sectoral Working Group is intended to be a formal
reference document on the impacts of climate change and adaptation measures in
coping with climate change on the water sector and this document will be up dated
in each two (2) years in order to accommodate the recent development of the current
meteorological trends and their adaptation measures.
I hope this country report will serve as a complementary document for the National
Action Plan for Mitigation and Adaptation to Climate Change (RAN-MAPI) and
also for inputs on the development the Second National Communication for
Mitigation and Adaptation for climate change.

                                                            Jakarta, December 2007

                                                           Minister of Public Works
                                                             Republic of Indonesia

                                                                    Djoko Kirmanto

                                            vi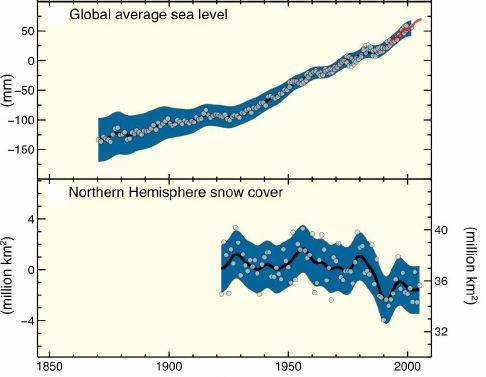
CONTENTS

Preface (Acknowledgement)
Content
List of Tables
List of Figures
Foreword from the Ministry of Environment
Foreword from the Ministry of Public Work
I.   Introduction                                                          1
II. Climate Hazards in Indonesia                                           3
     2.1 Type of Climate Related Hazards in Indonesia                      3
     2.2 Detecting Changes in Frequency and Intensity of Climate Hazards   3
III. Impact of Extreme Climate Events                                      5
     3.1 Changes in rainfall                                               5
     3.2 Impact on Water Reservoirs, Electricity Generation and
          Drinking Water                                                   6
     3.3 Impact on Agriculture                                             7
     3.4 Impact on Land and Forest Fires                                   12
     3.5 Impact on Coastal Zones and Fishery                               14
     3.6 Impact on Health                                                  14
IV. Past and Future Climate Change                                         16
     4.1 Past Global Climate Changes                                       16
     4.2 Past Changes in Climate, Hydrology an Sea Level                   17
     4.3 Future Global Climate Change and Sea Level Rise                   28
                                     st
     4.4 Indonesian Climate in the 21 Century                              29
V. Implication of Climate Changes and Sea Level Rise in Indonesia          35
     5.1 Impact of Climate Changes                                         35
     5.2 Impact of Sea Level Rise                                          40
VI. Knowledge Gap and Adaptation Programs                                  44
References
Appendix

                                            vii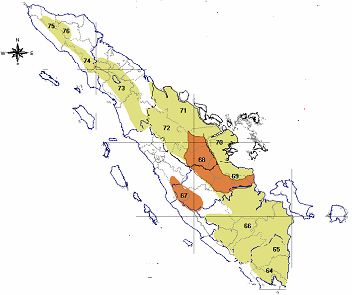
LIST OF TABLES

1.    Percent change of rain relative to normal rainfall by provinces             5
2.    Percentage of young plants killed due the long dry season                   10
3.    Total economic loss nationally due to fires in 1997 El Niño year (in
      million USD)                                                                14
4.    Relative sea level rise in a number of observation stations                 27
5.    List of small islands that serve as baseline for Indonesian sea territorial 41
6.    Plan for adaptation to climate change in nine sectors                       52

                                LIST OF FIGURES

1.    Degree of exposure to natural hazards and percentage of area affected       2
2.    Global surface mean temperature anomalies during the top 10 El Niño
      events in this century                                                      4
3.    Number of floods occurred in Indonesia during the period of 2001-2004       4
4.    Average volume of water at the main water storage in Java during La-
      Niña, El-Niño, and normal years                                             6
5.    Anomaly of electricity production from 1992-2006                            6
6.    Impact of El-Niño on rice and secondary crops                               7
7.    National food crops production in the period 1980-1997. Arrows indicate     9
      El-Niño years
8.    January-April rice production in relation to monsoon onset                  9
9.    Drought index and rice production loss by district                          11
10.   Variation of wereng attack during a period of 1989 to 2005 in Indonesia     12
11.   Yield of Palm Oil with age                                                  12
12.   CO2 emission from South East Asia in period of 1991 to 2001. Dashed
      and solid lines show different degrees of smoothing of the bariability      13
13.   Number of incidence rate and affected cities and districts by dengue        15
14.   Annual trend of dengue incidence rate by districts in Java                  15
15.   (a) Anomaly of mean globa sea-land and (b) 2001-2005 mean surface
      temperature relative to 1951-1980 measured at meteorological
      stations and ship and satellite SST measurements                            16
16.   Observed changes in global average sea level rise from tide gauges (blue)
      and satellite (red) data and (c) Northern Hemisphere snow cover for
      March-April. All changes are relative to responding averages for the
      period 1961-1990                                                            17
17    Annual rate of maximum (a) and minimum temperature (b) changes over
      33 stations in Indonesia                                                    18
18    Disappearance of snow cover at the Jaya Wijaya Mount at Irian Jaya,
      Indonesia (left) and melting of glacier at Upsala Argentina (right)         19
19.   Significant decreasing annual rainfall trend in Bengkulu of Sumatra and
      Ketapang of Kalimantan                                                      20
20.   Annual changes of wet season (a) and dry season rainfall (b) over 30
      stations in Indonesia                                                       21
21.   Number of extreme dry month (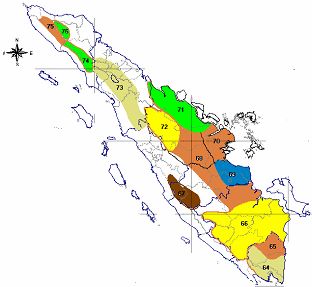
22. The changes in onset of wet season and onset of dry season in Sumatra
    Island                                                                        22
23. The changes in onset of wet season and onset of dry season in Java Island     23
24. Percentage of rivers which have minimum flows that potentially cause
    drought (a) and flood problems (b).                                           23
25. The change in peak flow and its relationship with flood volume in the 12
    rivers in West Java                                                           23
26. Decreasing trend in base flows (m3/s) of Ciliwung (a), Barito (b) and
    Larona (c) rivers.                                                            25
27. Water inflow from local rivers to the three cascade dams of Citarum
    Watershed (Cirata, Saguling and Jatiluhur)                                    26
28. Water quality at Tarum Barat Canal used for drinking water supply at
    DKI Jakarta                                                                   26
29. Existing operational Sea Level Monitoring Stations in Indonesia               27
30. Model projections of global mean warming compared to observed
    warming                                                                       28
31. The change in mean temperature and seasonal rainfall in Indonesia under
    the two emission scenarios for the five GCM models.                           30
32. Changes in JJA seasonal rainfall for 2070–2099 relative to 1901–1960
    (mm day-1) from six of the ocean–atmosphere climate models, for the
    Special Report on Emissions Scenarios A2 global warming scenario.
    Contour line colors correspond to different models.                           32
33. Precipitation trend for JJA of the multimodel ensemble median from 1979
    to 2099. Shading indicates_99%significance by the Spearman-rho test.
    The black line gives the 4 mmday_1 contour from the median
    climatology (1900–1999 average) of the models to indicate a typical
    boundary of the convection zones.                                             32
34. Summed precipitation for April–June (AMJ) and July–September (JAS)
    for the present climate (dashed line) and for the future predicted climate,
    using the A2 scenario                                                         33
35. Likelihood of exceeding the 30-day monsoon threshold in 2050 for the
    three EDMs applied to all GCMs for each scenario (15 GCMs for
    SRESA2 and 19 GCMs for SRESB1.                                                33
36. Likely rainfall pattern in Java and Bali                                      34
37. Status of clean water availability in 2015 by districts                       37
38. Projection of water status by sub-district at Citarum watersheds with no
    change in rainfall and water extraction of 10%                                38
39. Projection of water status by sub-district at Citarum watersheds with no
    change in rainfall and water extraction of 20% using baseline demand
    scenario                                                                      39
40. Area being inundated in 2050 under different sea level rise and land
    Subsidence scenarios.                                                         42
41. Example of long-term plan for adaptation for agriculture sector               45

                                            ix
TEAM OF AUTHORS
Coordinating Lead Authors
Rizaldi Boer, Sutardi and Dadang Hilman
Lead Authors:
Subandono Diposaptono, Orbita Roswintiarti, Agus Supangkat, Firdaus Agung,
Nyoman Suryadiputra, Kasdi Subagyono, Agung Bagiawan, Wanny Adhidarma,
Irsal Las, Mezak A. Rataq, Edvin Aldrian, Parluhutan Manurung, Ruchiyat Deny,
Saeful Anwar, Bambang Arifatmi, Zainal I. Nampira, Dayat Rachman, Rita
Kusriastuti, Agus Prabowo, Dony Azdan, Siti Belafoliyani, Bambang Gatot Irianto,
Woro Estiningtyas
Contributing Authors
Adi Rakhman, Nur Pamudji, Lis Novari Trisiane, Aris Harnanto, Sutisna Pitrasaleh,
Rini Hidayati, Bambang Dwi Dasanto, Benny Istanto, Adi M, Erni Murniati, Reni
Mayasari, Endang Titi Purwani, Atang Saputra, Roni Kurniawan, Rini
Agustianingsih
xI. INTRODUCTION
In the past four decades, climate related hazards such as floods, droughts, storms,
landslides and wild fires have caused major loss of human lives and livelihoods, the
destruction of economic and social infrastructures as well as environmental damages.
In many parts of the world, the frequencies and intensities of these hazards tend to
increase (Sivakumar, 2005; ADRC, 2005). Floods and windstorms accounted for
70% of total disasters and the remaining 30% of the total disasters are accounted for
by droughts, landslides, forest fires, heat waves and others. Within the period of
2003-2005 alone, there were about 1,429 disaster incidences in Indonesia. About
53.3 percent were hydro-meteorological disasters (Bappenas and Bakornas PB,
2006). Of this figure, floods occur most often (34%), followed by landslides at 16%.
It is likely that global warming will lead to greater extremes of drying and heavy
rainfall which will in turn lead to higher risk of climate hazards (Trenberth and
Houghton, 1996; IPCC, 2007). A report from UN-OCHA (2006) indicates that
Indonesia is one of the vulnerable countries to climate related hazards (Figure 1).
In the future, a changing climate brought about by global warming is expected to
create new patterns of risk, and higher risks generally. Sea level rise due to melting
glaciers and polar ice and thermal expansion will contribute to the increase of
coastal flooding. Increasing intensity of tropical cyclones observed in recent decades
may be tied to increasing sea surface temperatures. By impacting the hydrologic
cycle, global warming is expected to alter climatic ranges, shift regional climatic
averages, resulting in shifting of climate zones, and lead to a higher frequency and
amplitude of weather events. Climate variability and change occurring against a
backdrop of increasing global population and globalization of economic processes
may be expected to lead to increased competition over resources and new
vulnerabilities. With the increase of climate risk, many countries, particularly least
developed and developing countries, may have difficulties to achieve the
Millennium Development Goals related to poverty, hunger and human health.
This country report describes briefly the type of climate hazards in Indonesia and
their impact on various sectors, trends of climate change in the past and climate
change scenarios in the future as well as their implication on the sectors. Views from
sectors on how to address this climate change impact are summarized in the last
chapter. The country report was developed based on data and information provided
by sectors, reviewed journal articles and project reports. Scientific explanations are
not discussed in detail, however, where relevant, short notes on the methodology
used for data analysis are provided as foot notes.
1The bar charts show the degree of exposure to natural hazards and the percentage of area affected
Figure 1. Degree of exposure to natural hazards and percentage of area affected (UN-
OCHA, 2006)
2I. CLIMATE HAZARDS IN INDONESIA
2.1. Type of Climate Related Hazards in Indonesia
Floods, droughts, land slides and forest fires are the common types of climate related
hazards in Indonesia. The outbreak of crop pests and diseases as well as human
vector borne diseases was often reported connected to climate extreme events
(Gagnon et al., 2001; Hopp and Foley, 2003). The El Niño Southern Oscillation
(ENSO) is found as one of the natural phenomena that resulted in devastating
consequences on climate and cause disasters. In Indonesia, El Niño is often related
to drought and La Niña to floods. Based on 43 drought events occurred in the
period of 1844-1998, only six drought events were not associated with El-Niño
(Boer and Subbiah, 2005, ADB and Bappenas, 1999; Quinn et al., 1978). Moreover,
ENSO is considered as one of the overriding control factors in major forest/land
fire and haze occurrence and frequency.
Climate-related hazards in Indonesia are also caused by the location and movement
of the tropical cyclones in the eastern south Indian Ocean (January to April) and the
eastern Pacific Ocean (May to December). Essential for cyclone genesis are ocean
surface temperature above 26.5qC, latitude beyond 5 degrees, and small vertical
wind shear. Since tropical cyclones has sustained surface winds of 32ms-1 or more,
its impact to the Indonesia region commonly is local strong winds and heavy
rainfall in the order of hours to days. Strong winds also often occur during the
transition of the Northeast to Southwest monsoon and vice versa.
2.2. Detecting Changes in Frequency and Intensity of Climate Hazards
Over recent years, it is quite clear that the El Niño events have become more
frequent as the global temperature anomalies associated with each El Niño continue
to increase (Hansen et al., 2006). This means that the extreme regional weather and
climate anomalies associated with El Niño are being exacerbated by increasingly
higher temperatures (Fig. 2). The warmer conditions have been linked to higher
concentrations of atmospheric greenhouse gases.
The occurrence of extreme climate events in many parts of the world is commonly
associated with this natural phenomenon. Therefore, the increase in frequency and
intensity of this event may lead to the increase of climate hazards. Observations in
the region of South East Asia and Bangladesh during the period 1900 – 1996
showed that 700 disasters have occurred of which 23% occurred between 1900-1979
(within 79 years), and 77% occurred between 1972 and 1996 (within 24 years)
(Sivakumar, 2005). Similarly in Latin America and the Carribean, a noticeable trend
of increase in the frequency of climate disasters was observed (Charveriat, 2000). In
Indonesia, of 46 massive drought events, about 30 events occurred between 1844
and 1960 (within 117 years), and 16 events occurred between 1961-2006 (within 46
years). Furthermore, flood is also becoming a common hazard. Every year, floods
which normally occur during rainy season are reported by a number of provinces. In
the period 2001-2004, about 530 floods have been reported and they occurred almost
3in all provinces of Indonesia. A rising trend of flood occurrence was also observed
in this short period of observation (Figure 3).
Figure 2. Global surface mean temperature anomalies during the top 10 El Niño events in
this century (1914/15, 1917/18, 1940/41, 1957/58, 1965/66, 1972/73, 1982/83,
1986/87, 1991/92, and 1997/98. Source: NCDC/NOAA)
200
Number of Flood Events
150
100
50
0
2001/2002 2002/2003 2003/2004
Figure 3. Number of floods occurred in Indonesia during the period of 2001-2004 (Source:
Provided by the Ministry of Public Works, 2007)
4II. IMPACT OF EXTREME CLIMATE EVENTS
3.1. Changes in rainfall
As discussed in Chapter II, many of the extreme climate events in Indonesia,
particularly droughts, were associated with ENSO. This was primarily due to the
significant decrease in rainfall. The impact of the 1982 and 1997 El-Niño events
(the two strongest El-Niño years in the last 25 years) on rainfall over Indonesia, has
been documented by Irawan (2002). His analysis was based on monthly rainfall
data in 1970-1997 by province and the impact was measured based on the
percentage of changeof seasonal rainfall relative to the rainfall means during the
period. It was found that all provinces had lower seasonal rainfall in these years.
Sumatra, Java and Sulawesi consistently showed a decrease of seasonal rainfall, in
particular of dry season rainfall (Apr-Sep or May-Oct depending upon the pattern of
monthly rainfall of each province, Table 1). The average decrease in dry season
(Apr-Sep or May-Oct) and wet season (Oct-Mar or Nov-Apr) Indonesian rainfall in
1997’s El-Niño was about 62% and 32% respectively while those in 1982’s El-Niño
was about 47% and 19% respectively. These results indicate that the effect of
ENSO on DS rainfall is stronger than on WS rainfall.
Table 1. Percentage of change of rainfall by province, relative to normal rainfall (average
of 1970-1997)
1997 1982
Island
Oct-Mar or Apr-Sep or Oct-Mar or Apr-Sep or
Nov-Apr May-Oct Annual Nov-Apr May-Oct Annual
Sumatra -35 -47 -38 -21 -32 -24
Java -34 -80 -41 -11 -85 -23
Bali/Nusa Tenggara -26 -82 -31 -26 -75 -32
Kalimantan -33 -57 -40 -5 -36 -16
Sulawesi -28 -67 -39 -35 -33 -30
Maluku/Ambon -13 -53 -40 -5 -27 -20
Indonesia -32 -62 -38 -19 -47 -24
Source: Irawan (2002)
Furthermore, ENSO influences on inter-annual rainfall variability in Indonesia
reveal that (USDA, 1984; ADPC, 2000; Yoshino et al., 2000; and Kirono and
Partridge, 2002): (i) the end of the dry season occurs later than normal during El
Niño and earlier during La Niña years, (ii) the onset of the wet season is delayed
during El Niño and advanced during La Niña years, (iii) a significant reduction of
dry season rainfalls could be expected during El Niño and significant increase
during La Niña years, (iv) long dry spells occur during the monsoon period,
particularly in Eastern Indonesia.
53.2. Impact on Water Reservoirs, Electricity Generation and Drinking Water
The decrease and increase in rainfall has significant impact on water storage in
reservoirs (Figure 4). Significant changes in water volume in the reservoirs (dams)
occurred during dry seasons, in particular in dry season II (June-September). Many
of these dams have functions for electricity generation and for providing irrigation
water and drinking water.
140
from
Okt-Jan (MH)
Oct-Jan
Feb-Mei
Feb-May (MK I)
(% al)
120 Jun-Sep (MK II)
Jun-Sep
(% dari Norm
100
Air water
80
Vo lum e of 60
40
Volume
20
0
La-Nina El-Nino La-Nina El-Nino
Jatiluhur Kedung Ombo
Figure 4. Average volume of water at the main water reservoirs in Java during La-Niña, El-
Niño, and normal years. WS: wet season, DS: dry season Source: Las et al.
(1999)
The occurrence of ENSOs that caused significant decrease of water levels in the
reservoirs has caused serious impact on electricity generation. Data from eight
Dams (four small dams and four big dams in Java) indicated that in El-Niño years of
1994, 1997, 2002, 2003, 2004 and 2006 most of the power plants operated in the
eight dams produced less electricity than normal (long-term means; Figure 5). The
interesting feature was that during the 1994 El-Niño, the four big dams (Cirata,
Saguling, Brantas and Jatiluhur) were still able to produce electricity above the long
term means, but not in El-Niño years of 1997 onwards.
100
80
Electricity Production Anomaly
60
(% from long term mean)
Area 1
40 Area 2
20 Area 3
Area 4
0
Cirata
-20 Saguling
-40 Brantas
Jatiluhur
-60
-80
-100
1992 1994 1996 1998 2000 2002 2004 2006
Figure 5. Anomaly of electricity production from 1992-2006 (Drawn from data provided by
PLN., Electricity State Company, 2007).
6The shortage of water in the reservoirs during extreme dry years will also influence
the availability of drinking water, especially in urban/metro areas. For example,
Jakarta, the capital city of Indonesia, gets drinking water from the Citarum Dam.
Under extreme drry years, the water level at Citarum Dam may go down to a level of
less than 75 m. Under this condition, the water pump at the dam can not be operated
and supply of water to processing the plant will stop. On the other hand, in extreme
wet years, the flood will damage the processing plant and contaminate the water.
Floods occurred in February 2007 have caused damage in the production installation
which amounted to about 2.2 million USD. Heavy rainfall also increases the
turbidity and this will increase the cost of water processing. Current technology for
water processing is still conventional and it can tolerate the turbidity of between 500
and 2000 NTU. Under emergency, the plant still can be operated even though the
turbidity has increased up to 8.000 NTU, but the cost for the processing will increase
significantly. If the turbidity goes beyond 8,000 NTU, the plant can not be operated.
3.3. Impact on Agriculture
Significant decrease in rainfall in dry seasons has significant impact on food crops
production. From historical data, it was shown that, in general, the area affected by
drought significantly increased during El Niño years (Figure 6). However, from
national production statistics the impact of El Niño, apart from 1982, is not distinct,
except for rice (Figure 7). This condition appears due to a number of reasons
(Suryana and Nurmalina, 2000; Meinke and Boer, 2002): (i) the statistics are based
on calendar years rather than El Niño years, (ii) not all regions of the nation are
affected by drought simultaneously, (iii) shortage of water may force a farmer to
switch crops from rice to secondary crops, (iv) restricted water supply may reduce
the area planted under irrigation but yield of crops may increase due to higher solar
radiation, and (v) production may be affected in the year following an El Niño event
as farmers have less money to spend on fertilizers or insecticides.
Rice Maize
900 90
Completely damage
Completely damage
800 Lightly-heavily affected 80 Lightly-heavily affected
Drought Area (thousand ha)
Drought Area (thousand ha)
700 70
600 60
500 50
400 40
300 30
200 20
100 10
0 0
1990 1991 1992 1993 1994 1995 1996 1997 1990 1991 1992 1993 1994 1995 1996 1997
Soybean Peanut
35 Completely damage 25
Completely damage
Lightly-heavily affected
30 Lightly-heavily affected
Drought Area (thousand ha)
Drought Area (thousand ha)
20
25
20 15
15 10
10
5
5
0 0
1990 1991 1992 1993 1994 1995 1996 1997 1990 1991 1992 1993 1994 1995 1996 1997
Figure 6. Impact of El-Niño on rice and secondary crops (Drawn from Data provided by
Directorate of Plant Protection, Boer and Subbiah, 2005).
7Delay in onset of the rainy season during El-Niño years will also reduce the
production of wet season rice (January-April Production; Figure 8). It is suggested
that a 30-day monsoon delay will reduce January-April rice production in
West/Central Java by about 6.5% and in East Java/Bali 11.0%.
Data of historical impacts of El-Niño events on national rice production indicate that
the national rice production system is vulnerable to extreme climate events.
Whenever El-Niño occurred, the rice productions loss due to drought increased
significantly (Figure 9), and the total loss also tended to increase. On average, the
production loss due to drought in the period 1991-2000 was three times higher than
that, occurring in the period of 1980-1990 (Boer and Las, 2003). This seems to
indicate that the national rice production system becomes more vulnerable to
extreme climate events.
The occurrence of ENSO also has indirect effects on crops. There was an indication
that the brown plant hopper (‘wereng coklat’) population increased significantly in
La-Niña years probably due to higher rainfall amounts. Wereng attack in West Java,
the main rice growing area of Indonesia, increased significantly in years when La-
Niña occurs, i.e. 1998 and 2005 (Figure 10). In addition, types of major crop pest
and diseases have shifted recently. For example in the past pink rice stem borer
(Sesamia inferens) was only minor problem in Java (e.g. Indramayu, Magelang,
Semarang, Boyolali, Kulonprogo, and Ciamis) compare to yellow rice stem borer
(Scirpophaga incertulas), and white rice stem borer (Scirpophaga innnotata).
Nowadays this disease become dominant (Nastari Bogor and Klinik Tanaman IPB,
2007). According to Kalshoven (1981), regions with distinct dry seasons are
favorable for pink rice stem borer. Bacterial leaf blight (Xanthomonas oryzae pv.
Oryza) in the last three years is also dominant diseases for rice crop while before this
disease is not important so that research on this diseases is still limited. Saddler
(2000) stated that optimal temperature for this disease to grow in around 30oC.
Similar phenomena is also observed in non-rice crops. For example, twisting
disease caused by Fusarium oxysporum before 1997 is not important disease for red
onion crop, but now this becomes very important disease not only in lowland but
also in the highland areas. In the last two years, this diseases attack seriously red
onion crops in a number of onion production centre such as Brebes (Wiyono, 2007).
From laboratory research, this crop when being exposed to high temperature, it
become more is less resistant to this disease (Tondok, 2003).
The phenomenal example is the appearance of Gemini disease in chili in the last five
years in all main chili and potato production centre of Java (Bogor, Cianjur, Brebes,
Wonosobo, Magelang, Klaten, Boyolali, Kulonprogo, Blitar, dan Tulungagung;
Nastari Bogor dan Klinik Tanaman IPB, 2007). This disease caused by virus which
is transmitted to the crops by kutu kebul (Bemisia tabaci). Up to know, research on
this disease is still limited. However initial findings suggests that temperature is the
main triggering factor for this disease as indicated by the significant increase in
Bemisia tabaci population on tomato when temperature was increased from 17 to 30
°C (Bonaro et al.., 2007). The explosion of this virus under elevated temperature
has been predicted by Boland et al., (2004) in Canada. These above findings may
8not be enough to conclude that global warming is the main triggering factor for this
disease, however it is undeniable that global warming contributes partly to create
this condition.
Rice M aize
14.0 Harv est Area 53.0 4.0 12.0
Harv est Area
Production Production
13.0 47.5
Production (million tonnes)
3.5 10.0
Harvest Area (million ha)
Production (million tons)
Harvest Area (million ha)
12.0 42.0 3.0
8.0
11.0 36.5 2.5
6.0
10.0 31.0 2.0
9.0 25.5 1.5 4.0
8.0 20.0 1.0 2.0
Year Year
Soybean Peanut
2.4 2.0 0.8 0.8
Harvest Area
Harvest Area
2.0 1.6 Production
Harvest Area (million ha)
Production (million tons)
Harvest Area (million ha)
Production
Production (million tons)
0.7 0.6
1.6 1.2
0.6 0.4
1.2 0.8
0.8 0.4 0.5 0.2
0.4 0.0 0.4 0.0
1980
1982
1984
1986
1988
1990
1992
1994
1996
1998
2000
1980
1982
1984
1986
1988
1990
1992
1994
1996
Year Year
Figure 7. National food crops production in the period 1980-2001. Arrows indicate El-Niño
years (Drawn from BPS, Boer and Subbiah, 2005)
West/Central Java East Java/Bali
Figure 8. January-April rice production in relation to monsoon onset. Note: y axis, time-
detrended production, 1982/1983 to 2003/2004 (1,000 metric tons); x axis,
Number of days after August 1 when accumulated rainfall reaches to 200 mm.
Thus 120 means that onset of rainy season is around 1 December. Year labels
correspond to the year of monsoon onset; production (harvest) occurs in the
following year (January-April). Dashed lines represent the 30-day threshold.
Source: Naylor et al. (2007)
9Long dry seasons in El-Niño years affect significantly not only annual crops but also
perennial crops. Based on field observation, a long dry season in general destroys
young plants. On average, the percentage of young plants (age of less than 2 years)
die back due to the long dry season of the El_Niño year 1994 is presented in Table
2.
Table 2. Percentage of young plants killed due the the long dry season of the 1994 El Niño
year
crop type Percent Die Back
Tea about 22
Rubber Between 4 and 9
Cacao about 4
Cashew nut Between 1.5 and 11
Coffee about 4
Coconut Between 5 and 30
Source: Based on data provided by the Directorate General of Plantation, Ministry of Agriculture.
The impact of severe drought on some plantation crops such as coconut and palm oil
may not occur during years of drought events but it may be observed a few months
later. Hasril et al. (1998) found that the impact of long dry spell on the production
of palm oil is significant after 4-9 months (Figure 11).
101991 1992
1993 1994
1995 1996
1997
Figure 9. Drought index and rice production loss by district (Drawn from data provided by
Directorate of Plant Protection, Boer et al. 2002)
1190000
80000
70000
Attacked areas (Ha)
60000
50000
40000
30000
20000
10000
0
1988 1990 1992 1994 1996 1998 2000 2002 2004 2006
Year
NAD North Sumatra South Sumatra Lampung
West Java Central Java DI Yogyakarta East Java
Bali West Nusa Tenggara West kalimantan South kalimantan
South Sulawesi Banten
Figure 10. Variation of wereng attack during the period of 1989 to 2005 in Indonesia. Source:
Drawn from data provided by Directorate of Plant Protection (2007)
14000
Fresh fruit (kg/ha)
12000
10000
8000
6000
4000
El-Niño years were 82/92, 91/92, and 94/95
2000
0
7 1978
10 1980
13 1981
16 1983
19 1984
22 1986
25 1987
28 1989
31 1990
34 1992
37 1994
40 1995
Age (Semester and Year)
Figure 11. Yield of Palm Oil with age (Hasan et al., 1998)
3.4. Impact on Land and Forest Fire
The extent of land and forest fires in Indonesia is also closely related to ENSO
events. In El-Niño years, the total area of land and forest being burnt by fires
increased significantly and this lead to much of the increase in levels of atmospheric
CO2. For example in the 1991/92, 1994/95 and 1997/98 El-Niño years, the carbon
emission from fires measured in 97 monitoring stations across South East Asian
countries increased significantly (Schimel and Baker 2002). Wildfires in Indonesia
were responsible for much of the increase (Page et al. 2002). Most of the carbon
emission from fire in Indonesia during 1997/98 came from peat fire. Total area of
12fire-damaged forested peat land for whole Indonesia during this time might reach 6.8
million ha (Page et al. 2002).
Figure 12. CO2 emission from South East Asia in the period of 1991 to 2001. Dashed and
solid lines show different degrees of smoothing of the variability (Schimel and
Baker 2002).
Forest fires have a direct impact on the physical environment, namely on forest
ecosystems as they disrupts forest function, pollution of watershed areas and
reduction of biological diversity, while at the same time pollution of the atmosphere
occurs (MoE and UNDP, 1998). Air pollution, especially aerosols, produced by
fires reduces visibility, disrupting land, air and water traffic. Visibility of less than
one kilometer halts air traffic. In the case of 1997 fires, in some cities the visibility
was only about 10 m (MoE and UNDP, 1998). Diseases or health problems caused
by air pollution include acute respiratory infection (ARI), bronchial asthma,
bronchitis and eyes and skin irritation. The total number of health cases during the
1997 fires in 8 provinces (Riau, West Sumatra, Jambi, South Sumatra, West,
Central, South and East Kalimantan) reached about 9 million cases (MoE and
UNDP, 1998).
MoE and UNDP (1998) and WWF&EEPSEA (1998) reported that the total
economic loss nationally due to the 1997 fires amounted to 662 and 1056 million
USD (Table 2). Furthermore, OFDA/CRED (2007) stated that this fire was one of
the top 10 natural hazards occurred in the period of between 1907 and 2007 and
value of all damages and economic losses directly or indirectly related to the
1997/98 fires might reach 17,000 million USD, much higher than those reported by
the previous two studies.
13Table 3. Total economic loss due to fires nationally in the 1997 El-Niño year (in Million
USD)
Sectors MoE and UNDP (1998) WWF & EEPSEA (1998)
1 Agriculture 88.6 130.7
2 Forestry 508.2 640.6
3 Health cost 43.8 256.7
4 Transmigration 0.2 0.0
5 Transportation 13.6 4.9
6 Tourism 4.9 19.6
7 Fire cost control 3.2 3.3
TOTAL 662.4 1055.6
3.5. Impact on Coral Ecosystems
The increase in sea temperature during the 1997 El-Niño year has caused serious
problems for the coral ecosystems. Wetland International (Burke et al., 2002)
reported that the 1997 El-Niño has damaged about 18% of the coral ecosystems in
South East Asia. Coral bleaching was observed in many places such as in the
eastern part of Sumatra, Java, Bali, and Lombok. In ‘thousands islands’ (north of the
Jakarta coast), about 90-95% of the corals located 25 m below sea surface has been
bleached.
3.6. Impact on Health
Extreme weather related to ENSO may also contribute to the outbreak of human
diseases such as malaria, dengue, diarrhea, cholera and other vector borne diseases.
In Dhaka, Bangladesh the cholera cases correspond significantly to local maxima in
ENSO, and this climate phenomenon accounts for over 70% of disease variance
(Rodo et al., 2002). In Africa, malaria disease outbreak was triggered by the
occurrence of above normal rainfall (Moji et al., 2002). This finding has been used
as one of the indicators to warn the possibility of malaria outbreak. In Indonesia
Dengue cases are also found to increase significantly in La-Niña years (Figure 13)
when seasonal rainfall increased above normal. A significant increasing trend in the
number of dengue cases was also observed in Java. Based on data of dengue
incidence rate from 1992 to 2005, it was found that in many big cities, especially in
Java, the incidence rate of dengue increased consistently from year to year (Figure
14) peaking in La-Niña years.
14Incidence Rate per 100.000
Number of affected
Figure 13. Number of incidence rate of dengue histogram and of affected cities and districts
line in Indonesia (Source: Depkes RI dalam www.tempointeraktif.com). Note:
1973, 1988 and 1998 are La-Niña years.
Between -6 and -3 Between 9 and 12
Between -3 and 0 Between 12 and 15
Between 0 and 3 Between 15 and 18
Between 3 and 6 Between 18 and 21
Between 6 and 9 Between 21 and 24
Figure 14. Annual trend of dengue incidence rate in districts in Java (cases/100,000 people).
Source: (drawn from data provided by Depkes, 2007).
15IV. PAST AND FUTURE CLIMATE CHANGE
4.1. Past Global Changes in Climate and Sea Level
Rapid increase in greenhouse gases concentration in the atmosphere has been
pointed out as a main factor causing global warming and climate change. In the
period of 1950 to 1998, it was estimated that about 270 (+30) Gt of carbon has been
released to the atmosphere. About 40% of the carbon emission came from human
activities such as burning fossil fuels, industry activities and deforestation, and 60%
from natural processes. CO2 is partly absorbed again by ocean and terrestrial
ecosystems.
Carbon dioxide is the most important anthropogenic greenhouse gas. IPCC (2007)
reported that the global atmospheric concentration of carbon dioxide has increased
from a pre-industrial value of about 280 ppm to 379 ppm in 2005. The atmospheric
concentration of carbon dioxide in 2005 exceeds by far the natural range over the
last 650,000 years (180 to 300 ppm) as determined from ice cores. Since the
beginning of continuous direct atmospheric measurements (1960), it is clear that the
annual growth of carbon dioxide concentration in the atmosphere occurring between
1995 and 2005 (1.9 ppm per year) was larger than that occurring between 1960 and
2005 (1.4 ppm per year), although there is a year-to-year variability in growth rates.
The rapid increase of this gas has caused global temperature increase (Figure 15).
Figure 15. (a) Anomaly of mean global sea-land and (b) 2001-2005 mean surface
temperature relative to 1951–1980 measured at meteorological stations and ship
and satellite SST measurements (Hansen et al., 2006)
The associated increase in global temperature caused an increase in sea level rise
due to ice melting and thermal expansion of sea water (Figure 16). The global
warming may lead to changes in regional climate, like changes in precipitation
(amount of heavy rainfall) and in climate extremes such as number of hot days and
number of long dry spells. The effect of global warming will be superimposed on
decadal climate variability, such as that caused by the inter-decadal or Pacific
Decadal Oscillation, and on inter annual fluctuations caused by the ENSO and the
North Atlantic Oscillation (Salinger, 2005). All this may lead to a century of
increasing climate variability and change, expected to be unprecedented in the
history of human settlement and agrarian activities.
164.2. Past Changes in Climate, Hydrology, and Sea Level in Indonesia
Temperature. Based on trend analysis of maximum and minimum temperature data
of 1980-2002 for 33 stations, a significant increase in maximum and minimum
temperature was observed in most of the stations. The rate of change varied from
one station to another station (Figure 17). The highest rate of minimum temperate
changes was observed in Polonia-Medan (0.172oC per year) while that of maximum
temperature changes was observed in Denpasar (0.087oC per year). On average the
rate of changes in minimum and maximum temperature over the 33 stations was
0.047oC and 0.017oC per year respectively.
Figure 16. Observed changes in global average sea level rise from tide gauges (blue) and
satellite (red) data and Northern Hemisphere snow cover for March-April. All
changes are relative to corresponding averages for the period 1961-1990 (IPCC,
2007).
The locations of the stations that monitor the air temperature are mostly in urban
areas. The increase in population, industries and transportation activities in these
areas may contribute partly to the increase of the temperature. It is quite difficult to
quantify the single effect of the increase of the GHG concentration on site-specific
temperatures t. However, there is much evidence that global warming is occurring.
For example, much snow that covers the Jayawijaya Mount of Irian Jaya in the past
has disappeared already. Similar feature was also observed in other country such as
in melting of glaciers in the Upsala Mount of Argentina (Figure 18).
17(a)
(b)
Figure 17. Annual rate of maximum (a) and minimum temperature (b) changes over 33
stations in Indonesia (significant at 5% level; rate of changes < 0.04oC; between
0.04 and 0.07oC ; and > 0.07oC;. Source: Data provided by BMG and analysed
by Boer et al. (2007).
18Figure 18. Disappearance of snow cover at the Jaya Wijaya Mount at Irian Jaya, Indonesia
(left) and melting of glacier at Upsala Argentina (right)
Rainfall. Based on a record of historical annual rainfall data with a length of about
43 years, from 63 stations (period of record varied from the earliest year 1950 and
the latest 1974 until 1997), it was found that all stations show a decreasing trend of
annual rainfall depth during the last decades, except for stations in the Lesser Sunda
Islands and the eastern coast of Java and the northern part of Indonesia (e.g.
Sumatra) (Aldrian, 2007)1. The decrease varies among stations. It was found that in
the period of 1968 and 1997, the large significant decrease of trends were observed
in Bengkulu, Sumatra and Ketapang, Kalimantan, i.e. 71.79 and 29.71 mm/year
respectively (Figure 19). A similar study conducted by Boer et al. (2007) also
showed that there was a significant decreasing trend in both seasonal rainfalls (rainy
and dry seasons). Most of the wet season rainfall of stations located in the southern
part of Indonesia (South Sumatra, Java and Eastern Indonesia) tended to increase
(Figure 20a) while that of dry season rainfall tended to decrease (Figure 20b).
Whereas in the stations located in the northern part of Indonesia (e.g. Sumatra),
rainfall in both seasons showed a slight increase.
Furthermore, Aldrian and Djamil (2006) also studied the change of rainfall pattern in
the Brantas Catchment Area based on 40 daily rainfall stations from 1955 to 2002.
They found that number of extreme dry months that was increasing for the last five
decades, particularly in areas near to the coast. In coastal areas, the number of
extreme dry months increased to 4 months in the last ten years and in 2002 it
reached 8 months which was considered as the longest dry season for the whole five
decades (Figure 21). In the mountain areas, amount of dry months in about 1-2
1
Trend analysis was done using the Mann Kendall trend test (Gilbert, 1987) and the linear
regression of Sen’s estimate (Salmi et al., 2002).
19months for the last ten years with maximum number of 4 months (Figure 21). Thus
there was a decrease in monsoonal strength and the shifted balances between the wet
season and dry season during the last five decades. This study suggests that the
lowland areas are more susceptible to the climate change.
7000
6000
Bengkulu: Y=-71.8X + 5451 Formatted: Font: Times
Annual Rainfall (mm)
5000 Roman, 8 pt
4000
3000
2000
1000 Ketapang: Y=-29.7X + 4010 Formatted: Font: Times
0 Roman, 8 pt
1968
1970
1972
1974
1976
1978
1980
1982
1984
1986
1988
1990
1992
1994
1996
Figure 19. Significant decreasing annual rainfall trend in Bengkulu of Sumatra and Ketapang
of Kalimantan (Reconstructed from Aldrian, 2007)
The shifted balances between the wet and dry seasons will lead to the shifted onset
of seasons. Based on mean data of onset of the rainy and dry season in the period of
1961 to 1990 and that of 1991 and 2003, it can be indicated that the onset of the
seasons have changed in a number of regions of Sumatra and Java islands (Figure 22
and 23). In most of the Sumatra region, the onset of the wet season delayed between
1 and 2 dekads (one dakad equal to 10 days), while the onset of dry seasons
advanced between 1 and 6 dekads, except in some of areas in the eastern part of
Sumatra. A similar feature was also observed in Java.
Hydrology. Changes in stream flow are not only due to changes in rainfall but also
due to changes in land use and land cover and water use. Many studies suggest that
the fluctuations of stream flow will increase with the decrease in forest cover.
Recent studies indicated that the actual forest cover of Indonesia in 2000 was about
81.6 millions ha. With a deforestation rate of around 1.6 millions ha per year
(Kartodihardjo, 1999), almost three times the deforestation rate in the eighties
(600.000 ha/year), it is presumed that the forest cover in Indonesia in the year 2008
could be 68.8 millions ha only, or almost 53% of the forest cover of Indonesia in
1990 (Rosalina et al., 2003).
The high rate of deforestation has caused serious problems in many watersheds in
Indonesia Based on data from 52 rivers in Indonesia, it was found that the number of
rivers in which the minimum flow potentially would cause drought problems has
increased significantly. Similarly, the number of rivers in which the peak flow
potentially causes flooding also increased quite significantly (Figure 24). Based on
two year observations at 12 rivers in West Java, it was also found that peak flow in
the 12 rivers in 1999 has increased significantly compare to that of 1981 (Figure 25).
The increase in peak flow will increase flood volume. These findings suggest that
the risk of drought and flood will definitely increase under the changing climate, if
20no significant efforts are going to be undertaken to increase forest cover, particularly
in regions with high rainfall such as Sumatra and Java.
Between -21 and -24 mm/yr Between 0 and 3 mm/yr
Between -18 and -21 mm/yr Between 3 and 6 mm/yr Between 18 and 21 mm/yr
Between -15 and -18 mm/yr Between 21 and 27 mm/yr
Between 6 and 9 mm/yr
Between -9 and -12 mm/yr Between 9 and 12 mm/yr Between 27 and 30 mm/yr
Between -6 and -9 mm/yr Between 12 and 15 mm/yr Between 30 and 36 mm/yr
Between -3 and -6 mm/yr Between 15 and 18 mm/yr
Between 0 and -3 mm/yr
Figure 20. Annual changes of wet season (a) and dry season rainfall (b) over 30 stations
in Indonesia (significant at 5% level). Source: Data provided by BMG and
analysed by Boer et al. (2007)
21(a) Coastal Area (Mojokerto) Formatted: Font: Times
Roman, 9 pt
Dry Month
Number of
Formatted: Font: Times
Roman, 9 pt
(b) Mountain Area (Pujon)
Dry Month
Number of
Figure 21. Number of extreme dry month ((a) Wet season
No Change
Advanced 1-2
dekads
Advanced 3-4
dekads
(b) Dry season No Change
Advanced 1-2
dekads
Advanced 3-4
dekads
Figure 23. The changes in onset of wet season and dry season in Java Island. One dekad
equal to 10 days. Source (BMG, 2004)
(a) (b)
Percent of river with maximum
flow potentially caused drought
Percent of river with minimum
flow potentially caused flood
Year Year
Figure 24. Percentage of rivers which have minimum and peak flows that potentially cause
drought (a) and flood problems (b). Source: Loebies (2001).
140 2500 1981
Flood Volume (1000 m )
3
120 1981 1999
Peak Flow (m3/s).
2000
100 1999
80 1500
60 1000
40
500
20
0 0
0 25 50 75 100 125 150
C ng
g
g
r C an
s
C ng
pa
ua
o
ar
k
gu
un
un
iru
se
og
u
is Cilu
we eup
dl iwu
m
ar
Tu
pp iliw
Peak Flow (m 3 /s)
iliw
iliw
ab
ie
ib
la
is
C
C
l
tu
uk
s
C
M Ci
eu
Ka
e
is
er
C
C
id
Lo
U
Figure 25. The change in peak flow and its relationship with flood volume in 12 rivers in
West Java (Reanalyzed based on data from Pawitan, 2002)
23Based on stream flow data from 1990 to present, a decreasing trend in base flows
has been observed in a number of stations of major rivers in Indonesia such as the
Ular river (North Sumatra), Tondano River (North Sulawesi), Citarum river (West
Java), Brantas (East Java), Ciliwung-Katulampa (West Java), Barito-Muara Teweh
(Central Kalimantan), Larona-Warau (South Sulawesi). A significant decrease in
the base flow was observed in some of these rivers (Figure 26). These significant
decreases were caused partly by the increase in water use and the decrease in forest
cover in the upper part of the river basins, particularly in the Ciliwung River.
From long historical data of water inflow from local rivers to the three cascade dams
of the Citarum watershed (Cirata, Saguling and Jatiluhur), it was found that the
maximum, mean and minimum water inflow from the local rivers decreased
significantly (Figure 27). The rate of decrease is more pronounced for peak flow,
i.e. 6.5 m3 s-1 year-1. A similar decreasing pattern was also observed in rainfall.
Pawitan (2002) found that the annual rainfall in the upper Citarum stations
decreased at a rate of about 10 mm per year (based on rainfall data in the period of
1896-1994).
The quality of water in the Citarum watershed also decreased significantly.
Observations at station B.Tb.49 located at Tarum Barat Canal showed that a rapid
change in turbidity occurred after 1997 (Figure 28). A similar pattern was observed
in some other monitoring stations. The decrease in the water quality will increase
cost for processing the water.
2481
60
40
A
20
A
1
900101 25.days/mm 9301 9401 9501 9601 9701 9801 9901 0001 0101 YYYMM
A site 2120102 020120102 Ciliwung at Ciliwung-Katulampa Debit m3/det .734units/mm Origin 1
6930
6000
4 0 0A0
A
2000
0
770101 8001 8301 8601 8901 9201 9501 9 8 0 1Y Y M M
A s it e 3 2 7 0 0 0 1 0 3 0 2 7 0 0 0 1 S B A r it o a t S B a r it o - M T e w e h
610
500
400
300
200
A
100
A
0
760101 7701 7801 7901 8001 8101 8201 8301 8401 8501 YYMM
A site 4570006 040570006 S Larona at S Larona-Warau Debit m3/det
Figure 26. Decreasing trend in base flows (m3/s) of Ciliwung (a), Barito (b) and Larona (c)
rivers. Source: Puslitbang Air Bandung (2007).
25800 Max = -6.5492x + 13484
R2 = 0.4323
700 Mean = -3.6782x + 7534.4
R2 = 0.4608
Inflow from Local River (m3/s
600 Min = -0.5119x + 1066.7
R2 = 0.0244
500
400
300
200
100
0
1967 1971 1975 1979 1983 1987 1991 1995 1999 2003
Figure 27. Water inflow from local rivers to the three cascade dams of Citarum Watershed
(Cirata, Saguling and Jatiluhur). Source: Drawn from data provided by PLN
(2007)
1,000
900
800
700
Turbidity (NTU).
600
500
400
300
200
100
0
1993 1994 1995 1996 1997 1998 1999 2000 2001 2002 2003 2004
Figure 28. Water quality at Tarum Barat Canal used for drinking water supply at DKI Jakarta
(Observation station of B.Tb.49). Source: Drawn from Data provided by PJT2
(2007)
Sea Level Rise. Indonesia has installed a number of instruments to monitor sea level
(Figure 29). The existing Indonesia Sea Level Monitoring Network consists of 65
operational stations2. Increasing trends in MSL has been observed in a number of
stations. However the rate of increase varies with locations (Table 3). The relative
sea level rise will accelerate wide spread because of coastal erosion where the land
border has been subsiding.
2
More stations will be installed through an ongoing program called the establishment of Indonesia
Tsunami Early Warning System (IndTEWS), started from 2006 to end of 2008. The network will
consists of 120 stations of which 80 stations using real time data transmission and at least two quality sea
level recordings. Solar cell power supply for each station ensuring an availability of back up for
continuous measurement.
26Figure 29. Existing operational Sea Level Monitoring Stations in Indonesia
Table 4. Relative sea level rise in a number of observation stations
Stations Location Sea Level Rise Source
(mm/year)
Cilacap 1.30 Hadikusuma, 1993
Belawan 7.83 ITB, 1990
Jakarta 4.38 ITB, 1990
7.00 Based on data from 1984-20063
Semarang 9.37 ITB. 1990
5.00 Based on data from 1984-2006
Surabaya 1.00 Based on data from 1984-2006
Sumatra 5.47 ITB, 1990
Panjang, Lampung 4.15 P3O-LIPI, 1991
A phenomenon called ROB, inundation of coastal areas during spring tide, has been
observed in Demak since 1995. This phenomenon has affected more than 650 ha of
coastal areas in six villages, i.e. Sriwulan, Bedono, Timbul Seloka, Surodadi,
Babalan and Beran Wetan. It also damages infrastructures such as roads and
railways. During these bad conditions, those infrastructures are failed to function
and create problems for transportation and economy. Responding to the impacts, the
Ministry of Marine Affairs and Fishery together with the local government, has been
implementing a number of activities, i.e. rehabilitation of mangrove areas, coastal
sediment stabilization, and construction of pile-houses. Impact of this phenomenon
is enhanced as the land subsidence continues. Problems of land subsidence has
been observed in a number of cities mainly due to overexploitation of ground water.
3
The derived water levels are a combination of changes in the sea level and the vertical land motion at the
location of the gauge. Therefore, the trends derived are relative MSL trends and can be considered valid
only for a region near the gauge with uniform vertical land motion.
27You can also read