ITALY VOCATIONAL EDUCATION AND TRAINING IN EUROPE - VET IN EUROPE REPORTS I 2016 - Refernet
←
→
Page content transcription
If your browser does not render page correctly, please read the page content below
VOCATIONAL EDUCATION
AND TRAINING IN EUROPE

ITALY

           VET IN EUROPE REPORTS I 2016
Please cite this publication as:
 INAPP et al. (2016). Vocational education and training in Europe – Italy. Cedefop
 ReferNet VET in Europe reports; 2016.
 http://libserver.cedefop.europa.eu/vetelib/2016/2016_CR_IT.pdf

Authors:
Chapter 1: Claudio Franzosi; Emiliano Mandrone; Davide Premutico; Isabella
Pitoni
Chapter 2: Roberto Angotti; Andrea Carlini; Luisa Daniele; Francesca Penner
Davide Premutico; Valeria Scalmato; Claudia Spigola; Silvia Vaccaro
Chapter 3: Maria Grazia Mereu; Riccardo Mazzarella
Chapter 4: Isabella Pitoni
Contributors: Roberto Angottti; Concetta Fonzo; Elisabetta Perulli; Ismene
Tramontano
Validated by: Pietro Tagliatesta

Reviewed by Cedefop
© INAPP - Istituto Nazionale per l’Analisi delle Politiche Pubbliche, 2016
Reproduction is authorised, provided the source is acknowledged.
Italian version on http://www.inapp.org/

This VET in Europe report is part of a series prepared by Cedefop’s ReferNet
network. VET in Europe reports provide an overview of national vocational
education and training (VET) systems of the EU Member States, Iceland and
Norway. The reports help to understand VET’s main features and role within
countries’ overall education and training systems from a lifelong learning
perspective, and VET’s relevance to and interaction with the labour market.
VET in Europe reports follow a common Cedefop format. They are available at
http://www.cedefop.europa.eu/EN/Information-services/vet-in-europe-country-
reports.aspx.The opinions expressed here do not necessarily reflect those of
Cedefop. VET in Europe reports are cofinanced by the European Union and
ReferNet national partners.
ReferNet is a network of institutions across Europe representing the 28 Member
States, plus Iceland and Norway. The network provides Cedefop with information
and analysis on national vocational education and training. ReferNet also
disseminates information on European VET and Cedefop’s work to stakeholders
in the EU Member States, Iceland and Norway.
http://www.cedefop.europa.eu/en/events-and-projects/networks/refernet

    /cedefop                              @cedefop                              refernet
Table of Contents
List of figures and tables .................................................................................. 3
1. External factors influencing VET .............................................................. 4
1.1. Demographics ..................................................................................... 4
1.2. Economics and labour market trends ............................................... 4
1.2.1. Employment ................................................................................... 5
1.2.2. Unemployment ............................................................................... 6
1.2.3. Self-employment ............................................................................ 9
1.3. Participation in education and attainment ...................................... 10
1.4. Matching qualifications and jobs ..................................................... 12
1.4.1. An in-depth study of the educational mismatch ............................ 13
1.5. Labour market policies influencing VET ......................................... 14
2. Providing VET in a lifelong learning perspective ................................... 16
2.1. General education and vocational education and training ............ 16
2.2. VET governance ................................................................................ 18
2.3. VET at upper secondary level .......................................................... 19
2.3.1. Technical and vocational school programmes .............................. 19
2.3.2. Three- and four-year Regional Education and Vocational training
programmes (IeFP) ........................................................................................
..................................................................................................... 20
2.4. Post-secondary VET ......................................................................... 27
2.5. Post-higher education VET............................................................... 30
2.6. Apprenticeship-type schemes ......................................................... 30
2.7. CVET supporting policies and their financing system ................... 34
2.8. Training provided by employers ...................................................... 36
2.9. Adult education ................................................................................. 39
2.9.1. Adults demand for non-formal and informal learning .................... 40
2.10. Other forms of training .................................................................. 43
2.10.1. Non-formal learning...................................................................... 43
2.11. Teachers and trainers qualifications, roles and responsibilities 45
3. Shaping VET qualifications ..................................................................... 49
3.1. Improving the match between labour market need and VET
provision ...................................................................................................... 49
3.1.1. Excelsior Information System for employment and training .......... 49
3.1.2. Information system on professions ............................................... 50
3.2. Assessment, recognition of competences within formal learning
and validation of non-formal and informal learning .................................. 51
13.2.1. The new legal national framework of qualifications and its state of
implementing ..................................................................................................
..................................................................................................... 51
4. Promoting participation in VET ............................................................... 53
4.1. Financial and regulatory framework for CVET ................................ 53
4.2. Guidance and counselling structures and services ....................... 54
4.3. Challenges and policy developments .............................................. 55
List of acronyms and abbreviations .............................................................. 57
List of references ............................................................................................ 58
2List of figures and tables
Figures
1. Employment rate by gender ............................................................................ 5
2. Real GDP growth compared to the previous year ............................................ 6
3. Unemployment rate, including youth and those not in employment or education
(NEET) in EU28 and Italy in 2015 (%) ................................................................. 6
4. Unemployment rates by age in Italy, 2015 (%) ................................................ 7
5. Unemployment rates (15 to 64 years) by educational attainment level, 2015
(%) ...................................................................................................................... 8
6. Unemployment rates (15 to 64 years) by and educational attainment level, Italy
2006-15 (%) ........................................................................................................ 8
7. Self-employed and employees in 2011-15 (index) ........................................... 9
8. Early leavers from education and training in 2008, 2013 and 2015 (%) ......... 11
9. Tertiary education attainment in 2008, 2013 and 2015 (%) ............................ 12
10. Employment rates of young people (20 to 34 years) not in education and
training by educational attainment level (%) ...................................................... 12
11. VET in the education and training system in Italy ........................................ 18
12. People enrolled to IeFP (I-III year) in the last 4 years, by typology .............. 22
13. Distribution of centralised and delegated management of resources for the
‘right / duty’, according to territorial circumscriptions - 2014 (provided funding)(%)
.......................................................................................................................... 25
14. Committed resources for IeFP by Regions Ministries and Community
resources in 2014 (%) ....................................................................................... 25
15. Funded resources by Regions, Ministries and Community resources 2014(%)
.......................................................................................................................... 26
16. Training enterprises (%) by size class (Italy, 1993-2010)............................. 36
17. Training enterprises (%) by size class (Italy, 2012) ...................................... 37
18. Innovative and not innovative companies wishing to hire workers for
dimension class (%, 2013-2014) ....................................................................... 38
19. Participation rate in education and training (last 4 weeks – aged 25-64; Italy,
EU-28; 2007-2016) ............................................................................................ 41
20. Participation rate in education and training (last 4 weeks) by occupation (Italy,
2015-2016) ........................................................................................................ 43
Tables
1. List of qualifications and diplomas in IeFP VET three and four years
programmes ...................................................................................................... 21
2. Participation rate in education and training (last 4 weeks – aged 25-64, total
and employed) broken down for gender, age and geographical area (%, Italy
average 2015) ................................................................................................... 41
31. External factors influencing VET
1.1. Demographics
In January 2016, the population of Italy was 60.6 million, including 8.3% foreign
residents. Life expectancy decreased from 80.3 in 2014 to 80.1 years for men
and from 85 to 84.7 years for women.
The population is ageing with an average of 44.6 years, 0.2% higher than
in 2015. Age dependency ratio was 56% ( 1). In 2016, the share of population up
to age 24 was less than 25% ( 2). The working age (15-64) population shrinks and
is 64.3% of the total population, while the share of children (up to age 14) is
13.7% and of seniors (60+) 22%. In 2016, the share of youth (24 or less) was
below 25%.
Demographic trends have an impact on school population, which was
decreased between September 2014 and June 2015, especially at lower
secondary level (by 0.7%). In the same period, upper secondary school level
population has increased by 0.8%, including both Italian (+0.6%) and foreign
learners (+2.8%).
Since 2007, immigration has been a prevailing demographic growth
factor. In 2016, it has halved, while emigration has nearly tripled.
The share of foreign learners has increased by 20.9% between 2009/10
and 2014/15 (from 673 592 to 814 187) ( 3), compared to a 2.7% decrease of
Italian learners (from 8 283 493 to 8 058 397). The share of foreign female
learners was 48%.
In 2014/15, 55.3% of learners with foreign nationality were born in Italy
(84.8% in pre-primary education). In 2015, 7.3% of foreign learners declared to
have repeated one or more school years ( 4), especially those not born in Italy
(31%). Foreign learners often have lower marks in secondary education
programmes.
1.2. Economics and labour market trends
The gap between well-off and at-risk groups (women, children, immigrants and
minority communities) grows. The risk of poverty and social exclusion in the
country is higher than before the crisis. In 2015, the incidence of absolute
household poverty was 6.1%.
1
( ) [Population ages 0-15] + [Population ages 65-plus]) ÷ [Population ages 16-64]) × 100;
source : http://data.worldbank.org/indicator/SP.POP.DPND?locations=IT.
2
( ) For example, in France it was 30.4%.
3
( ) Foundation for initiatives and studies on multi ethnicity (2016) National Report 2014-15
on students with non-Italian citizenship.
4
( ) According to the 2015 survey on integration of the second generation by ISTAT.
41.2.1. Employment
The 2008 economic crisis resulted in lower employment. Since then, there was a
decline of permanent jobs, especially for young people, and increase in part time
and temporary jobs
In 2015, the employment rate of age group 20-64 was 60.5% (0.6
percentage points more than in 2014). It was not gender balanced. The
employment rate of age group 55-64 was 56.3 % (2 percentage points more than
in 2014, and 9.2 points more than 2007). The increase of the employment was
evident especially among temporary employees, with a share of 14% (0.5
percentage points more than in 2014). The share of part-time employees’ also
increased, especially among women. Also the share of full time jobs has
increased. The size of undeclared labour was 12.8% in 2013, mainly in specific
areas (mostly in southern regions) and production sectors characterised by a
relevant turnover also on a seasonal base (for example building, social care, and
tourism sectors).
Figure 1. Employment rate by gender
64.3 64.1 65.6
64.3 64.1 65.6
58.3 56.8 56.3
58.3 56.8 56.3
71.5 70.4 70.1 67.5 70.8 65.5 57.2 46.3 58.2 46.1 60.4 47.2
2006 2010 2015 2006 2010 2015
Males EU 28 Females EU 28
Males Italy Females Italy
Total European Union (28 countries) Total European Union (28 countries)
Total Italy Total Italy
NB: 15 to 64 years, all ISCED 2011 levels
Source: Eurostat, table lfsa_ergaed; extracted on 18.11.2016
Since 2006, the Italian employment rate remains below the EU average. It
is also gender imbalanced. In 2015-16, the employment rate in all age groups
increased except the 25-34 year-olds (-0.3%). Growth was particularly strong
among those over 50 (1.9 %).
Since 2015, an increase in employment signals the beginning of recovery
from the economic recession.
5Figure 2. Real GDP growth compared to the previous year
4
3.3
3 2.5 3
2.1
2 2.1 2.2
1.6 1.5 1.7 1.6
1 0.9 2
0.4 1.7 0.6 -0.5 0.7
0 0.2 0.1
-1 2004 2005 2006 2007 2008 2009 2010 2011 2012 2013 2014 2015
-2 -1.7
-3 -1.1 -2.8
-4
-4.4
-5
-5.5
-6
Italy EU (28 countries)
Source: Eurostat, table tec00115, extracted on 18.11.2016.
1.2.2. Unemployment
Figure 3. Unemployment rate, including youth and those not in employment
or education (NEET) in EU28 and Italy in 2015 (%)
Unemployment NEET Youth Unemployment (15-24)
60.0
50.0
40.0
30.0
20.0
10.0
0.0
Bulgaria
Latvia
Lithuania
Luxembourg
Sweden
Hungary
United Kingdom
Greece
Cyprus
Austria
Romania
Slovakia
Italy
Poland
Portugal
Czech Republic
Denmark
Netherlands
Finland
Belgium
Estonia
EU (28 countries)
Spain
France
Malta
Slovenia
Ireland
Croatia
Germany
ΝΒ: Break in series for NEET values in LU and HU
Source: Eurostat ([edat_lfse_20] and [lfsa_urgan]); extracted on 20.12.2016.
In Figure 3, the share of young people aged 15-29 not in employment and
education or training (NEET) was 25.7% in 2015. The share of youth
unemployment was 40.3% that is almost four times more that the total
unemployment rate in the country (11.9%).
6Figure 4. Unemployment rate by age in 2015 (%)
15-24 yrs 25-29 yrs 30-34 yrs Total
45.0 42.7
40.0 40.3
40.0 35.3
35.0
27.9 29.2
30.0
22.2 23.6 22.4
25.0
18.1
20.0 14.8 14.4 14.3 14.6 14.1
15.0 12.4
9.9 9.6
10.0 12.7
12.2 11.9
10.7
5.0 8.4 8.4
0.0
2010 2011 2012 2013 2014 2015
Source: Eurostat, [lfsa_urgan], extracted on 20.12.2016.
In 2015, the unemployment rate was decreased by 0.8pp (Figure 4)
compared the previous year. The decrease was more evident for the 15-24 age
group (2.4pp).
In 2014, six unemployed out of ten (60.7%) could not find a job longer
than one year. The non-participation rate, i.e. unemployed not searching for a
job, decreased for the first time since 2006 (0.4 pp less than in 2014). According
to ISTAT ( 5), education had a protective role against unemployment during the
crisis.
The average unemployment rate in the country 2016 was similar to the
EU28 average. The Italian rate of youth unemployment is constantly growing:
from 20% in 2007 to more than 42% in 2016.
Figure 5 demonstrates that the lower the education level is the higher
unemployment and vice versa. The latter is not true for Italy. High education
levels do not necessarily mean better employability.
5
( ) Source: ISTAT.Rapporto Annuale 2016: la situazione del Paese
7Figure 5. Unemployment rates (15 to 64 years) by educational attainment
level, 2015 (%)
40.0
35.0
30.0
25.0
20.0
15.0
10.0
5.0
0.0
Austria
Latvia
Romania
EU 28
Finland
France
Netherlands
Czech Republic
Poland
Denmark
Greece
Hungary
Slovenia
Spain
Bulgaria
Croatia
Cyprus
Ireland
Sweden
Italy
Lithuania
Luxembourg
Portugal
Slovakia
Belgium
Estonia
Malta
United Kingdom
Germany
Less than primary, primary and lower secondary education (levels 0-2)
Upper secondary and post-secondary non-tertiary education (levels 3 and 4)
Tertiary education (levels 5-8)
Source: Eurostat, lfsa_urgaed; extracted on 18.11.2016
Figure 6. Unemployment rates (15 to 64 years) by and educational
attainment level, Italy 2006-15 (%)
18.0 16.2
17.0
15.9
16.0 13.9
14.0 12.0
11.5 11.5
12.0 10.5 10.8
10.1
9.6
10.0 8.2 8.5
7.9 7.9
7.5 7.3
8.0 6.2 6.1
5.6
6.0 7.3
8.0
7.2
6.7
4.0 5.2 5.5 5.8 5.4
4.5 4.6
2.0
0.0
2006 2007 2008 2009 2010 2011 2012 2013 2014 2015
Less than primary, primary and lower secondary education (levels 0-2)
Upper secondary and post-secondary non-tertiary education (levels 3 and 4)
Tertiary education (levels 5-8)
Source: Eurostat, lfsa_urgaed; extracted on 18.11.2016
81.2.3. Self-employment
Self-employment is historically fragmented in Italy. It includes occupations
mentioned in various regulations, including regulated professions and
independent workers.
Figure 7. Self-employed and employees in 2011-15 (index)
101.0 100.3
100.0 100.0
100.0
99.1
100.0
99.0 98.5
99.3
98.0
97.0
97.3 97.2
96.0 96.8
95.0
94.0
2011 2012 2013 2014 2015
Employees Self-employees
Source: Isfol elaboration on EUROSTAT data
In 2015, self-employment was 24% of the total employment. It is more than in
EU on average (16%). The fragmented structure of self-employment confirmed its
weakness, particularly during the crisis period. In 2015, self-employment
decreased by 3.2pp, while the share of employees slightly increased compared
to 2011 (Figure 7).
Self-employees can be divided into three categories:
(a) professions for the exercise of which a compulsory membership in
associations is needed ;
(b) professions which are organised in professional associations, thus
disciplined by law anyway, but no compulsory membership in
associations is needed; and;
(c) professions that are ‘unregulated’ or not organised in any order or college,
usually, but not exclusively new professions whose possible aggregation
in groups is not contained in the list provided by the relevant law.
A professional can also be a person that is employed by a firm, is enrolled in
registers or professional orders, but is not self-employed with a VAT. For this
category of professionals, training support follows the policy provided by the law
for all other non-professional employees and has also access to refresher
courses provided by registers and orders.
The professionals mentioned in point (a) have to follow the rules dictated
by registers and orders, which usually request that they attend refresher courses
9and other training initiatives, often utilising the so-called ‘training credits’. The aim
is to reach a certain compulsory minimum credit score within a specific period of
years (usually within 3 years).
The latest amendments Law 4/2013 on measures for non-organised
professions has provided a regulatory framework for professions defined in point
(b).
The participation of self-employed persons in education and training is
related on professionals’ academic background and if their profession is
regulated by law. If their profession is regulated by law, the participation to
training activities in 2015 is above the average; on the other side, other ‘low
skilled’ categories of self-employed are significantly below the average rate. The
participation is also higher for professionals with academic background (with a
university degree) rather than the ones that had obtained diplomas after their
compulsory education.
The above mentioned law also recognises the role of professional
associations (as well as ‘aggregations’ of associations ( 6)), which, among other
tasks, organise specific training activities, thus ensuring a permanent education
process. Another fundamental aspect of the law covers the competence
certification process, based on a collaborative model between the Associations of
representation, the Uni ( 7) and ’Accredia (the national organisation aimed at
validating the assessment bodies). This model contributes to consumers’
protection; because they can chose only certified professionals.
1.3. Participation in education and attainment
More than half of young people (15-24 years old) are enrolled in higher education
in Italy. Eight percent of 24-65 year-olds participate in lifelong learning. In 2015,
the share of early leavers from education was 15.0% (Figure 8) (national target
2020 is 16%). In vocational training nearly half of the students are one year late
in their training, an indication that academic ‘weaker’ students choose vocational
training. Based on previous experience, this increases the likelihood of an early
exit – drop out completely in some cases. Progress has been made in many
areas but still Italy is in the last positions compared to the benchmark of 2020
and behind other more economically advanced countries.
6
( ) Both typologies are shown in a list at the Ministry of Economic Development. In August
2016 they have been recognised 132.
7
( ) UNI - Italian Organisation for Standardisation - is a private non-profit organisation
recognised by the State and by the European Union (list of national standard bodies in
accordance with Section 27 of European Regulation no. 1025/2012), that from nearly
100 years has been developing and publishing voluntary techniques - UNI laws - in all
industrial, commercial and service sectors.
10Figure 8. Early leavers from education and training in 2008, 2013 and 2015
(%)
19.6
16.8
14.7 14.7
11.9
11
EU (28 countries) Italy
2008 2013 2015
Source: Eurostat, table t2020_40; extracted on 18.11.2016
Italy implements policies linked to the Job Act reforms and the ‘Buona
Scuola law’ that integrate young VET learners in the labour market. They reduce
early school leaving through training (apprenticeships) and help validate learner’s
skills. These policies and new legislations are also aimed at enhancing upper
secondary qualifications. In fact the proportion of young people aged between 20
and 24 who obtained at least a high school diploma is lower than EU28 average
level: in 2015 they were 81.1% compared with 82.7% but with a diminishing gap
comparing to the data registered in 2008, when they were 76.6% compared to
78.6% and particularly in comparison to 2013, when the Italian figure was 78.1%
against the European market at 81.1%
Also tertiary education attainment has increased to 25.3% among the 30-
34 year-olds (Figure 9) (national target 2020 is 26%); which is still considerably
less than the EU average (38.7%).
11Figure 9. Tertiary education attainment in 2008, 2013 and 2015 (%)
37.1 38.7
31.1 2008
25.3 2013
22.5
19.2 2015
EU-28 Italy
Source: Eurostat, EU-LFS: Data code: t2020_41. Extraction date: 11.7.2016
1.4. Matching qualifications and jobs
In EU28, people with primary education have an employment rate of 53.5%; with
secondary education – 74.2%; those with tertiary education –84.4%. In Italy the
figures are 47.8, 61.5% and 67.2% respectively.
Figure 10. Employment rates of young people (20 to 34 years) not in
education and training by educational attainment level (%)
100.0
80.0
82.6
60.0 74.2 71.2
58.6
40.0
20.0
53.5
76.0
84.4
53.2
86.8
91.4
46.2
70.5
83.5
47.8
61.5
67.2
0.0
EU (28 countries) Germany France Italy
Less than primary, primary and lower secondary education (levels 0-2)
Upper secondary and post-secondary non-tertiary education (levels 3 and 4)
Tertiary education (levels 5-8)
All ISCED levels
Source: Eurostat, [edat_lfse_24] extraction date: 21.12.2016
As shown in Figure 10, employment rates for young people (20 to 34
years) in Italy are considerably below than EU average and the respective rates
in Germany and France; especially, when it comes to young employees with
tertiary education level.
12Although, various actions and reforms have helped learners to access
easier higher and tertiary education, this was not accompanied by a greater
absorption of the higher educated workforce in the production system. In many
cases the supply growth was not followed by a growth in demand for skilled
employment. Even though, the demand for qualified employment is modest and
the number of graduates is still very low compared to other European countries,
phenomena such as over-educated workers was not observed.
1.4.1. An in-depth study of the educational mismatch
The ISFOL-PLUS survey, realised in 2014, differs from other surveys due to the
absence of indirect respondents (proxy interviews) and for directly targeting the
respondents that fit the characteristics of the survey ( 8). This approach made it
possible to prepare and use a detailed questionnaire on the nature of
employment, education and household conditions, allowing – through dedicated
modules - the analysis of the actual situation of the labour market, as it is
perceived by respondents, with a particular attention to the difficulties
experienced by youth, women, and people over age 50.
The analysis of the dynamic aspects of such phenomena was supported
by the longitudinal design of the survey ( 9), which consists of a share of the
interviews that is repeated for the same subjects (panel), tracing with precision
the trajectories in the labour market over time. The best match between level of
education and professional employment is observed for women, who choose jobs
with higher security with guaranteed paid maternity leave.
The phenomenon of over-education varies by age, qualification and
gender. The educational mismatch decreases with age, suggesting that over
time, even if slowly and partially, an adjustment between human capital and work
eventually occurs. At age 40-49, more than 42% of employed individuals report
no factor of mismatch (36% at age 18-39), and the share increases to 47% for
those over 50. The only mismatch of over skilled is difficult to be absorbed over
time; in fact, there are no significant variations between different age groups. The
gender analysis shows that mismatch is higher for men. The analysis of
indicators of over-education per educational qualification highlights that, roughly
8
( ) The first consequence is that the characteristics of PLUS occupation are cleaned from
the component of non-prevailing employed (i.e. those individuals that are considered
as employed according to the official ISTAT definition having worked for at least one
hour over the last week, but with an economic activity not so substantial that they can
be considered as employed ‘tout court’) and include some other categories of
unemployed (o job-seekers) that, on the contrary, are not considered in the official
ISTAT definition (potential workforce). However, it is always possible to retrace the
labour force aggregates defined by ISTAT-EUROSTAT from PLUS data, by using ad
hoc queries.
(9)
Panel data on a two and three-year basis are available for those waves of ISFOL-PLUS
(2005- 2006-2008-2010-2011-2014) for which weights have been defined for the
longitudinal population.
13speaking an upper secondary school graduate is generally less overqualified
than a university graduate.
It seems evident that negative judgements on job satisfaction are
connected to a higher over-education, reinforcing the interpretation that a bad
matching fosters a growing work discomfort. The gap is a structural one: workers
with higher work dissatisfaction report 10 extra percentage points of over-
education the gap related to career prospects and economic treatment is less
severe.
Over-education seems to be structural and a relevant share of individuals
is mismatched even after many years in employment. Skills that are wasted often
generate work discomfort, while a missing educational qualification is often
superseded by the acquired professionalism.
Overall, the analysis confirms the presence of important determinants not
only from the supply side, as often underlined in most contributions on the matter,
but also from the demand side.
Further analysis shows that over-education is associated with a lower
return both in terms of labour income and job satisfaction.
1.5. Labour market policies influencing VET
The Italian welfare system has been substantially modified by the legislative
reforms implemented in the end of the 1990s, inspired by the European flexicurity
concept and aimed to reduce rigidity of the labour market policy. This first
generation of reforms (10) have allowed employers use short-term and part-time
contracts and to dismiss employees with greater flexibility. The reforms also
guarantee support services to workers (mobility and replacement opportunities).
The most recent reforms are based on the articulated implementing process of
the Jobs Act law (L.183/2014). The subsequent nine legislative decrees that are
setting the different issues covered by the Law greatly expand the reform course
opened by Law 92/2012 and draw a new framework of law work. In particular, the
legislative process under way intervenes in the field of labour market flexibility,
both inbound and outbound, the review of social safety nets in the event of
involuntary unemployment and in persistence of employment, provides new
services and active labour market policies, increases the protection of maternity
and the reconciliation of life and work.
One of the most relevant innovations compared with the previous reforms
are typologies of national job contracts. The market of labour policies introduced
by the new Job Act legal framework aim at simplifying and limiting the huge
number of the so called atypical or temporary employment contracts introduced
(10)
Minister Biagi reform law (L. 276/2003) about new form of more flexible and short
term employment contracts , Minister Fornero Leg. Decree ( LD 92/2012) about
retirement and market of labour reform
14by the previous reforms and seek to stimulate enterprises to favour the employee
work, through a system of increasing protections from temporary to permanent
recruitments. To be noticed that increasing of competences and training
experiences (also to be acquired through apprenticeship) are considered
fundamental along this pathway toward a more stable and better employment.
152. Providing VET in a lifelong learning perspective
2.1. General education and vocational education and training
All young people have the right/duty (diritto/dovere) (Law 53/2003, p. 7) to
pursue their education and training for at least 12 years before reaching age
18 and should not leave education and training without a qualification.
Compulsory education lasts 10 years, up to 16, and includes the first two
years of upper secondary general education or VET.
Young people complete lower secondary education at age 14. At this
stage, learners sit a state exam to acquire a certificate (EQF level 1)
which grants admission to the upper secondary level where young people
have the opportunity to choose between general education and VET.
At upper secondary level, young people may opt for:
(a) five-year programmes which include the two last years of compulsory
education and three years (under the right/duty of education and training)
in:
(i) high schools (licei). These provide general education
programmes at upper secondary level;
(ii) technical schools;
(iii) vocational schools.
High schools (licei) offer artistic, classical, linguistic, scientific, human
sciences, music and dance strands. Within the artistic strand, learners can
specialise in figurative arts, architecture and environment, design, audio visual
and multimedia, graphics or stage design in the second period.
The qualifications awarded after successful completion of high school,
technical and vocational school are at EQF level 4 and a state leaving exam at
the end of them gives access to higher education;
(b) Regional Education and Vocational training courses (IeFP) (3 or 4 years -
EQF 3 or 4 respectively)
(c) an apprenticeship-type scheme (EQF 3 or 4).
At post-secondary level, the Italian system features higher technical
training (IFTS, ITS) and short programmes or courses (post-leFP and others).
VET courses also exist at higher education level.
Tertiary education (ISCED levels 665, 667, 766, 767, 768, 864) is divided
into higher education programmes at the university and higher education
programmes at non-university institutions:
(a) universities: can be public or private and follow the three cycles of the
Bologna structure: bachelor (laurea); master (laurea
specialistica/magistrale); and specialisation or PhD programmes
(masters universitario di secondo livello, dottore di ricerca);
16(b) higher artistic and musical programmes (alta formazione artistica e
musicale) which are non-university programmes based on the three-
cycle structure.
Italian VET also offers adult education and Continuing Vocational Training
( CVT)
In Italy, the term vocational education and training is reserved for specific
programmes primarily under the remit of the regions and autonomous provinces
(such as leFP).
From a European perspective the term ‘education and training’ comprises
all types and levels of general and education and vocational education and
training (VET). Irrespective of the provider or governance scheme, VET can take
place at secondary, post-secondary or tertiary level in formal education and
training or non-formal settings including active labour market measures. VET
addresses young people and adults and can be school-based, company-based
or combine school- and company-based learning (apprenticeships). Therefore,
the term VET also covers the technical and vocational schools.
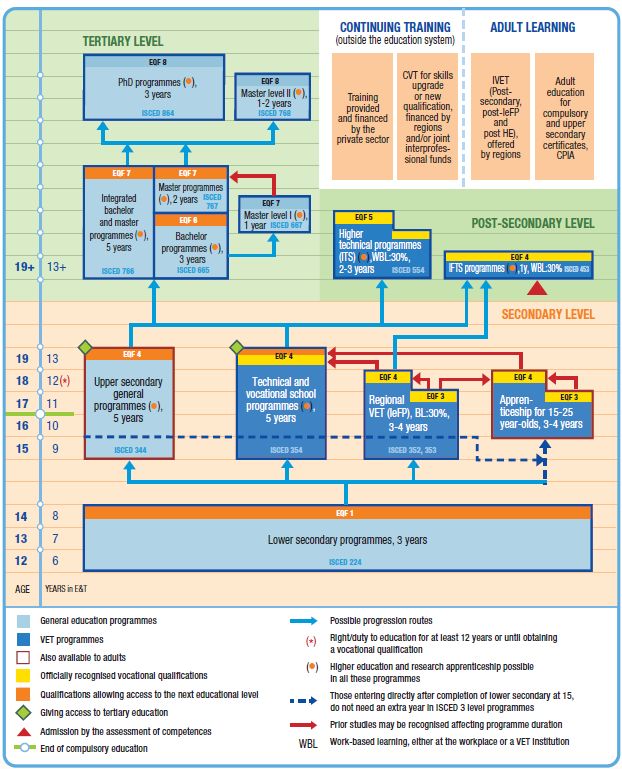
17Figure 11. VET in the education and training system in Italy
NB: ISCED-P 2011.
Source: Cedefop and ReferNet Italy.
2.2. VET governance
Responsibilities are shared among the different actors involved in planning and
organising VET as follows:
• the Ministry of Education, University and Research (MIUR) sets the
framework for VET in national school programmes (technical and
vocational schools) for higher technical training;
18• the Ministry of Labour and Social Policies (MLPS) sets the framework for
Regional Education and Vocational training courses (IeFP), while the
regions and autonomous provinces are in charge of planning,
organisation and provision;
• regions and autonomous provinces are also in charge of planning,
organisation and provision of ITS, IFTS, post IeFP, post-higher education,
and most of the apprenticeship-type schemes;
• goals of Continuing Vocational Training ( CVT) under the public system
are set by the labour ministry, while CVT activities are managed by
either regions and autonomous provinces or social partners;
• social partners play an important role in promoting company-level training
plans (single or group of companies) to be financed by the regions or by
the joint interprofessional funds;
• social partners have a general advisory role in VET policy, from which
VET provision is then defined;
2.3. VET at upper secondary level
2.3.1. Technical and vocational school programmes
In technical school programmes (istituti tecnici) learners can acquire
knowledge, skills and competences to carry out technical and administrative
tasks. These programmes start at the age of 14 and finish at 19. They offer an
upper secondary education diploma – Technical schools EQF 4 (such as:
tourism, graphics and communication, administration, finance and marketing)
In vocational school programmes (istituti professionali) learners acquire
specific theoretical and practical preparation enabling them to carry out
qualified tasks in production fields of national interest. These programmes
start at the age of 14 and finish at 19. They offer an upper secondary
education diploma – Vocational schools EQF 4 (such as: services for
agriculture and rural development, social and health services, etc.)
The certificate awarded mentions the branch and length of the studies,
the final marks, the points assigned through ‘school credit’, the points
assigned through training credits and the additional points given by the
examination board (if applicable), the subjects included in the curriculum and
the total number of teaching hours dedicated to each subject.
The certification models are drawn up by the Ministry of Education
(MIUR). Diplomas and certificates are written in four Community languages so
that they can be understood in the different Member States. In 2016 Europass
Certificate Supplements were produced by Ministry of Education together with
NEC Italy located in Isfol, and issued to all students together with the final
Diploma.
192.3.2. Three- and four-year Regional Education and Vocational training
programmes (IeFP)
The IeFP programmes (percorsi triennali e quadriennali di istruzione e
formazione professionale) are designed and organised by the regions.
Starting from age 15, students can study even by means of the
apprenticeship to achieve a qualification and a professional diploma, upon
attendance of a pre-established number of training hours.
The dual system experimentation is currently being launched (State-
Regions Agreement dated September 24th 2015) and it will give young people
the possibility to achieve a qualification and/or a professional diploma through
training courses characterised by a real alternation between training and work. In
particular, such courses could take the form of:
(a) an apprenticeship for achieving a qualification and a professional diploma
and the higher technical specialisation certificate;
(b) school - work alternation;
(c) simulated training enterprise.
Access to IeFP courses is possible only after completion of the
lower secondary school (former scuola media in Italian) and after passing the
related State exam.
Since experimental period in 2011, such courses have now become
official. They are now a regional matter and can be organised by the accredited
training agencies and starting from 2011/12, following the State-Regions
Agreement in Unified Conference of 16 December 2010 and the MIUR Decree n.
4 of January 18th 2011, they can also take place at the Professional Institutes
under the subsidiarity system, both as ‘supplementary’ and ‘complementary’
typology.
Under ‘supplementary subsidiarity’ in the third year, the students
attending 5-year courses can achieve one of the 22 professional qualifications
corresponding to the specialisation chosen.
In the case of courses under ‘complementary subsidiarity’, students can
achieve, in the same school institutions, 3-year professional qualifications and 4-
year diploma for IeFP courses. To this purpose, institutes create classes with the
same training standards and system regulation of IeFP courses.
The educational methodology used in IeFP courses is of active nature,
namely based on experience and work. The programme includes elements of
general knowledge, but focuses also on the specific professional areas chosen.
Upon completion of the 3-year IeFP courses, a qualification of
professional operator is granted (EQF Level 3); while at the end of the fourth year
a technician professional diploma is achieved (EQF Level 4).
20Regions issue qualifications and diplomas recognised at a national level,
as defined in the National Classification of Professional Roles. In the following
table the 22 qualifications and 21 diplomas are listed.
Table 1. List of qualifications and diplomas in IeFP VET three and four years
programmes
Vet Qualifications Vet Diplomas
1.Clothing Operator 1.Building Specialist
2.Shoe Operator 2.Electrical Specialist
3.Chemical production Operator 3.Electronic Specialist
4. Building Operator 4.Graphic Specialist
5.Electrical Operator 5. Artistic works Specialist
6. Electronic Operator 6.Wood Specialist
7.Graphic Operator 7. Motor vehicles repair Specialist
8.Specialist in running and maintaining
8.Thermohydraulic plants Operator
automated systems
9.Artistic works Operator 9.Industrial automation Specialist
10.Wood Operator 10.Beauty Treatment Specialist
11.Pleasure boats assembly and
11.Catering services Specialist
maintenance Operator
12.Motor vehicles repair Operator 12.Enterprise services Specialist
13.Mechanical Operator 13.Sales Specialist
14.Wellness Operator 14.Agriculture Specialist
15.Tourist-Sport entertainment and
15.Catering Operator
spare time services Specialist
16.Operator for tourist incoming and
16.Clothing Specialist
promotional services
17.Secretarial administrative 17.Hairstyle Specialist
Operator
18.Sales services Operator 18.Cooking Specialist
19.Logistics services and systems 19.Thermal plants Specialist
Operator
20.Incoming and Promotional Services
20.Food processing Operator
Specialist
21.Agricultural Operator 21.Food processing Specialist
22.Sea and fresh water Operator
Source: Regional State Accord July 27, 2011 Attachment 4: Reference figures for professional diplomas
referred to in the national directory of education and training offer
In Italy IeFP courses are regularly monitored. An annual survey
implemented by INAPP, in association with the Ministry of Labour and Social
Policies and the Ministry of Education, is the main instrument for the monitor
21activities. The results of the survey are included in a monitoring report describing
the progress of the system, which is produced by Isfol on behalf of the Ministry of
Labour. The last survey was made in 2015 and recorded the data for 2014/15.
The latest results effectively describe the general structure, the recent
dynamics of IeFP system as well as the classification of its users and the kind of
professional areas chosen. In particular, the results show stabilisation in the
number of people enrolled, after several years of increase.
As shown in Figure 12, in 2014-15, 316 599 persons were enrolled in
IeFP 3-year courses. The majority of them (166 605) were enrolled under
supplementary subsidiarity courses, 3 000 less compared to the previous period
(-1.8%). A positive trend was recorded for courses under complementary
subsidiarity (+5.76%, total 16 383) and those in training institutions (+2.15, total
133 611).
Figure 12. People enrolled to IeFP (I-III year) in the last 4 years, by typology
180000 169730 166605
160000
130797 133611
140000 125209 127992
120000
100000 118716
80000
60000 70861
40000
11450 15491 16383
20000 5851
0
2011-12 2012-13 2013-14 2014-15
Training institution Supplementary subsidiarity Complementary Subsidiarity
Source: Isfol, based on regional and provincial data, MLPS-MIUR survey
Taking into consideration the learners enrolled in the fourth year under
complementary subsidiarity (2 490 students) and in training Institutions (10 298)
students, the total amount of people enrolled in the IeFP system totals to 329
387, approximately 1 200 students more than the previous period (2013/14).
The fourth year is active in nine Regions/Autonomous Provinces
(Piemonte, Trento, Bolzano, Lombardy, Veneto, Friuli Venezia Giulia, Molise,
Calabria and Sicilia) while the 12 remaining ones still do not provide such training
possibility, either by choice or due to financial difficulties of the IeFP system. As
usual, Lombardy has the leading role, hosting 68% of the total students enrolled
at national level.
22Analysing data by gender distribution, in the whole IeFP system, no
relevant changes are recorded if compared with the previous year (61.3% males
vs 38.7% females),
As the typology of users is concerned, in 2014/15, the percentage of
those who have opted for IeFP as their first choice, increased both in centres and
in schools, while the number of those who make this choice following a previous
school or training failure decreased.
For example: in the accredited centres the share of 14-year old students
enrolled in the first year rose to 45.1% (+4.3%) out of the total number of enrolled
people, close to 50% in the courses under supplementary subsidiarity (+4.3) and
reaches 32.8% in the case of complementary subsidiarity (+2.2%). Nevertheless,
‘second opportunity’ choices are still numerous in the courses provided by
accredited centres and, even more, in the courses under complementary
subsidiarity.
In 2015 the share of students of foreign origin enrolled continued to be
significant (13.9%). The highest figures refer to the training institutes (17.3%) and
to supplementary subsidiarity (11.9%). In the contrary, in the case of
complementary subsidiarity, such value decreases, going below 5%. A particular
difference is recorded in the four years: in the case of accredited centres the
figure goes from 17.6% of the three-year period to 13.5%, while, in the case of
complementary subsidiarity, the percentage goes from 5.6% to 0.3% in the fourth
year, highlighting unequal opportunities in completing the courses between native
people and those of foreign origin.
If the professional area chosen is considered, the hotel and tourist sector
is still the favourite one in all the 3 types of courses provided, claiming almost
100 thousand people enrolled (approximately 34% of the total).
The vast majority of those enrolled in accredited centres prefer to
specialise as ‘wellness operator’ (more than 34 thousand out of the 37 thousand
people enrolled in total), with the female participants being the vast majority (90-
93%), depending on the different typologies.
In regards to the four-year courses, more than 900 people were enrolled
in the 6 diploma-courses offered. The first choice was, as usual, the ‘cooking
specialist’, followed by, the specialist in ‘beauty treatments’ and ‘hairstyle’. The
‘motor vehicles repair specialist’ recorded a positive trend during the last training
year, with 1 093 people enrolled, mainly in training institutes. Lastly the enterprise
services specialist and electronic specialist with, respectively, 944 and 938
enrolments.
In 2014-15, 71 308 people earned a qualification after three years of
training programme 45.6% of which were enrolled in accredited centres, 48.8%
in schools under supplementary subsidiarity, while the remaining 5.6% were
under complementary subsidiarity.
23The number of students achieving a diploma (our years programmes) has
reached 9 825, increasing approximately by 6% if compared to 2013-14. Almost
8 thousand of these have graduated (achieved the diploma) in the accredited
training institutes (80% of the total), with 1 907 graduating under complementary
subsidiarity.
In 2012-15, a further increase in the gap between the accredited centres
and the professional institutes has been recorded. The percentage of qualified
young people in training institutes, out of those enrolled in the training year 2012-
13, was 70.6%, rising by 5 percentage points compared with the previous year.
The success rate in the case of complementary subsidiarity courses records a
slight decline, reaching 60% (from 61.2% in 2014) and 54% in the case of
supplementary subsidiarity (from 56.9%).
It is clear that accredited centres tackle the problem of school leaving
better than structured interventions in schools, mainly thanks to the didactical
approach, work based learning and the connection with the labour market which
are typical of training institutes.
In addition to the methodological factor, a primary role is also played by
the trainers’ professionalism in the centres, which are experienced in working
with rehabilitation of people ‘at risk of social exclusion’. They are skilled enough
to motivate, guide and involve even the most demotivated students, namely
those having experienced a previous school failure.
Financing IeFP courses
The financial data have been provided by the regional institutions through the
annual monitoring on education and vocational training. The figure of financial
resources refers to 2014 (latest available data). The data analysis shows that,
overall, the committed resources were EUR 516 171 765, which indicate a 20%
decrease compared to last year financial commitment. The national data on total
funding amount to EUR 486 399 972 and they also encountered a decrease
compared to the previous year total national data (-17%).
Figure 13 shows macro-regions funding distribution and confirms a
national trend, already recorded the previous year, towards a greater
centralisation of resources at a regional level, with a variation concerning the
south of the country. In fact, if in 2013 there was an even distribution of funding
among regions and provinces, in 2014 the South opted instead for an exclusive
regional administration of resources.
Figure 14 and Figure 15 show the committed resources and funding are
disjointed from sources.
24Figure 13. Distribution of centralised and delegated management of
resources for the ‘right / duty’, according to territorial
circumscriptions - 2014 (provided funding) (%)
100
90
80 Funded
70 resources
60 Provincial
50 Funded
40 resources
30 Regional
20
10
0
Source: Isfol elaboration on regional and provincial data, MLPS-MIUR Survey
Figure 14. Committed resources for IeFP by Regions Ministries and
Community resources in 2014 (%)
National resources
MLPS
20%
National resources
MIUR
1% Regional/Provincia
l resources
49%
Community
resources
30%
Source: Isfol elaboration on regional and provincial data, MLPS-MIUR Survey
25Figure 15. Funded resources by Regions, Ministries and Community
resources 2014(%)
National resources
MLPS
18%
National resources
MIUR
3%
Regional/Provincia
l resources
54%
Community
resources
25%
Source: Isfol elaboration on regional and provincial data, MLPS-MIUR Survey
Most of resources come from regional/provincial sources, specifically
(53.6%). The resources allocated by the labour and education ministries were
decreased, while community resources were increased. In particular for what it
may concern funded resources, they have been registered lower percentages
coming from labour ministry and EU resources.
Therefore it emerges a significant financial effort coming from regional
institutions to compensate for the decrease of national economic resources
(almost entirely supported by the labour ministry) which constitute the 20% of the
necessary budget. This situation leads to a great difficulty, at a regional level, to
cover and satisfy the IeFP training requests by young people and their families.
Taking into consideration the macro-region division, it has been
underlined that in the North the majority of committed resources and funding
comes from local institutions. The Centre has a preponderance of committed
resources coming from MLPS, in contrary to funding derived by regional and
provincial sources. The South, both committed resources and funding
(respectively 58.1% and 50.7% come mainly from MLPS). The Islands, on the
other hand, mainly receive the committed resources from EU funds, whereas
funding comes from local government. At a national level, compared to the
previous survey, there was an increase in regional, provincial resources (+9.2%)
and the EU ones (+9.3%) and a decrease for the funding coming from the labour
(-7.1%) and the education (-11.4%) ministries.
It has been confirmed that the majority of committed resources and
funding coming from Regions and Autonomous Provinces are for training
activities conducted at the accredited centres. On a general point of view, there
26has been a further decrease of resources allocated to schools in favour of those
allocated to accredited centres.
2.4. Post-secondary VET
The post-secondary VET programmes were reorganised in 2008 (DPCM
25.1.2008) and mainly aim at developing professional specialisations at post-
secondary level to meet the requirements of the labour market in the public and
private sectors. There are two different options:
• higher technical education and training programmes (istruzione e
formazione tecnica superiore, IFTS);
• programmes at the higher technical institutes (istituti tecnici superiori,
ITS).
They are organised by four educational and vocational stakeholders: schools,
vocational institutions, universities and companies)
The specific course planning is coordinated by the regions and
autonomous provinces in the context of the territorial plans adopted every three
years and their provision varies across the regions. The IFTS and ITS
programmes provide all qualifications available at national and EU level.
The Higher Technical pathways (IFTS)
IFTS, established in 1999 and then revised to the current configuration
defined by the Interministerial Decree of 2013, are higher technical training
courses, regulated as follows: 800-1000 hours of courses (of which at least 30%
to be spent in the form of internship at a company), at the end of which one
obtains a higher technical specialisation certificate - the IFTS with national
validity and equal to EQF level 4.
IFTS Programming is defined by regions and the autonomous provinces
terms of provision, curricula, internship and job placement, within specific
planning documents called Three-Year Plans. Three-Year Plans are the
instrument through which regions and Public Administration define their strategy
in terms of post-secondary training, therefore they do not relate exclusively to
technical training but also ITS and training centres. Local governments are
therefore asked to have a full knowledge of their territory and, through an
integrated approach, to incorporate both local firm requests and training needs
expressed by the territory.
Regional programs are defined by the IFTS National Repertory, which is a
catalogue of 20 technical specialisations, related to specific professional areas
(mechanics, IT, tourism). People can access to these courses holding or not a
diploma but the latter ones can do it only following a specific assessment of
candidate’s skills done by its teachers. IFTS are to be provided by various
subjects, among which they have to be necessarily present a school, a university,
an accredited training institution and a company that aggregate into ATI or ATS
27(11)
. The presence of the companies and the high number of internship hours are
the precondition key to an education closely related to local production system
dynamics.
The Higher Technical Training Institutes Pathways (ITS)
Higher Technical Education is the post-secondary training offer parallel to
academic paths.
The chain was established by the Prime Ministerial Decree of 25 January
2008 and, as for the IFTS, revised through the aforementioned Inter-Ministerial
Decree of 2013.
The Higher Technical Institutes (ITS) are classified as ‘high technological
specialisation schools’ that, similar to IFTS, promote a high specialised education
in order to offer students attractive technical skills for the labour market. In line
with this, ITS programming approach is defined by regional administrations
according to their productive and economic characteristics.
As it regards course characteristics, they last 4 semesters, in other words
1800/2000 hours of which at least 30% have to be spent in a company as a form
of training and 50% of teachers must come from business and profession world.
Successful completion of the course leads to a Higher Technical Diploma with an
indication of the technological area and the national reference figure, related to
EQF level 5.
Technological areas identified for ITS, are:
• Energy efficiency
• Sustainable mobility
• New technologies of life
• New technologies for Made in Italy (mechanical systems,
fashion, food, home, business services)
• Innovative technologies for art and cultural activities
• ICT.
A strong element of distinctiveness compared to IFTS is given by the
nature of the party issuing the paths: although IFTS vet providers are a
partnership between several entities (schools, training institutions, enterprises,
universities, research centres and local authorities), for ITS this partnership must
be structured according to Foundation participation model.
The motivation of such a governance model is the fact that Foundation
ensures greater stability and recognition of the subject by the institutions and
territorial actors, as well as by potential students.
The two channels share the same cultural approach based on the
centrality of technical and technological culture; the connection with the economy
and productivity context of the area and the ability to combine in-classroom
classical training with direct experience in companies. However, there are even
(11)
Temporary Association of Companies (ATI); Temporary Purpose Association (ATS)
28You can also read