Campground Industry 2019 Trends - COVID-19 Pandemic Update - National Park Service
←
→
Page content transcription
If your browser does not render page correctly, please read the page content below
Campground Industry 2019 Trends –
    COVID-19 Pandemic Update
CBRE | Campground Industry 2019 Trends Report | COVID–19 Pandemic Update December 2020

                                             Table of Contents
Introduction.............................................................................................................................. 1
Campground Industry Overview................................................................................................... 6
Trends in Consumer Spending Behavior .......................................................................................32
What is a Campground?.............................................................................................................38
Visitation and Tourism Statistics..................................................................................................46
Current State of the NPS Campgrounds ........................................................................................51
Industry Standards - Reservation Systems and Campground Policies ................................................62
Other Public Agency Best Practices for Contracting with the Private Sector .......................................67
Recommendations and Conclusions.............................................................................................69
COVID-19 Pandemic Update December 2020 Executive Summary....................................................77

                                                                                                                             i|P a g e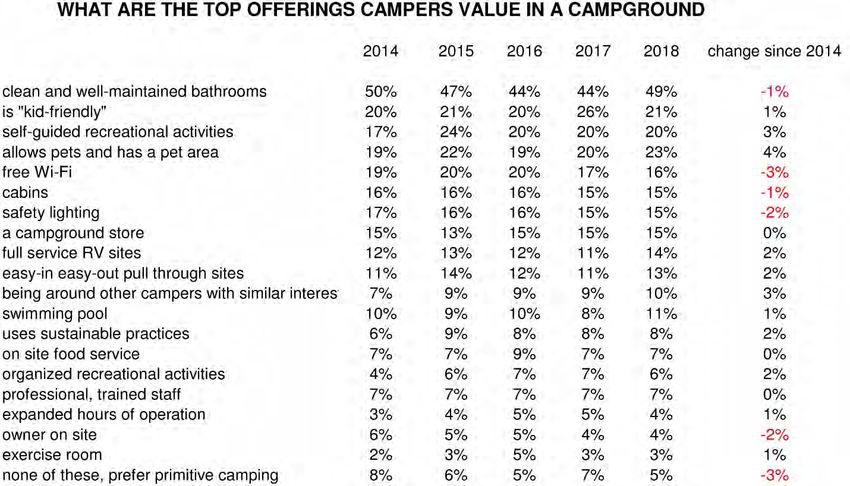
CBRE | Campground Industry 2019 Trends Report | COVID–19 Pandemic Update December 2020

Introduction
CBRE Inc. (CBRE) was engaged by the National Park Service (NPS or Service) in September 2019
to research the campground industry, to analyze data and findings, and to proffer a
campground modernization and rehabilitation strategy to support the Service’s Second Century
of Campgrounds. As such, CBRE teamed with a campground subject matter expert to execute
this four-phased project.

   •   Phase One consists of this industry analysis report with the goal of identifying and
       conveying the state of the industry along with current trends in order to assist the
       Service in anticipating developing and future expectations for camping services.
   •   Phase Two involves planning for and conducting site visits to three pilot parks’
       campgrounds.
   •   Phase Three entails:
          o Developing an analysis framework that aligns with the Service’s Facility
              Investment Strategy (FIS). This framework, which will include creating new tools
              and templates, will be utilized at the park-level to develop a business case to
              assist in decision-making of whether a campground should be modernized,
              otherwise rehabbed, or remain status quo.
          o Piloting this framework and completing business case analyses for select
              campgrounds in the pilot parks.
   •   Phase Four includes:
          o Building a generic campground financial model for the Service to analyze
              campground operations under both NPS- and concessioner-operated scenarios.
          o Performing financial analyses for select campgrounds in the pilot parks.

In pursuit of the Phase One Industry Report, the CBRE Team conducted detailed secondary
research as well as primary research (i.e., direct interviews) with multiple representatives and
officers from public land management agencies and trade associations in addition to
concessionaires who have hundreds of contracts with decades of service for varied public land
management agencies.

Overall, the campground industry is strong. Long-term demand appears robust, and growth is
driven primarily through the increase in annual camping households and their higher frequency
to camp.

Life stages and life events are increasingly influencing campers’ decisions regarding frequency
and where to camp. Events such as marriage, beginning a family, retirement, and other factors
impact how people camp and what types of accommodations, services, experiences, and
amenities they seek and/or expect.

                                                                                       1|Pa g e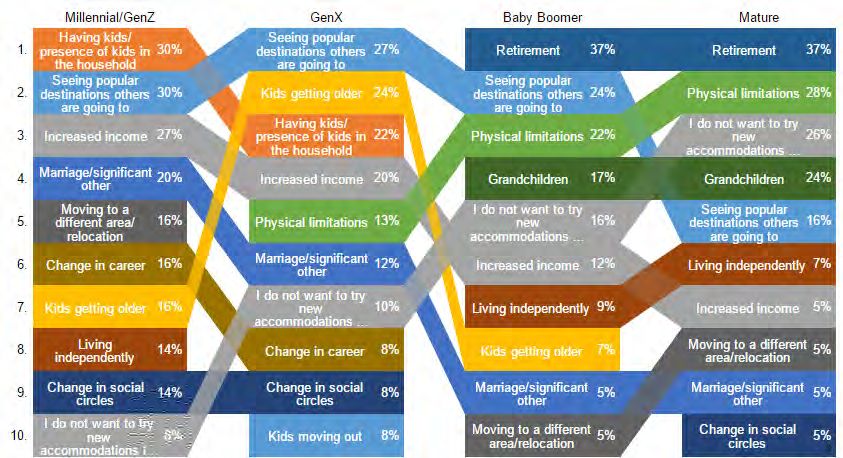
CBRE | Campground Industry 2019 Trends Report | COVID–19 Pandemic Update December 2020

Interestingly, the campground industry can be distilled down into two segments – generation
and ethnicity. These two segments provide some of the most relevant data to understanding
and predicting camper behavior.
For this project, camping is defined as an outdoor activity involving overnight stays away from
home in a shelter, such as a tent, cabin, recreational vehicle (RV), or other temporary
accommodation. Typically, campers leave developed areas to spend time outdoors. To be
regarded as "camping", a minimum of one night is spent outdoors thus distinguishing it from
day-tripping, picnicking, and other similarly short-term recreational activities. Also, campers like
to enjoy a wide variety of activities in and around campsites – many of whom select their
camping destinations based on available recreational options.

As expected, RV camping typically requires campgrounds with more infrastructure than is
needed for rustic camping. Recreational vehicle camping utilization has been steady in recent
years with approximately one in four campers opting to use a RV for their primary lodging.

The campground industry is best segmented by generation to more fully understand trends and
behavior. The generations are defined as: 1

      •   Generation Z – Born after 1997;
      •   Millennials – Born between 1981 and 1996;
      •   Generation X – Born between 1965 and 1980;
      •   Baby Boomers – Born between 1946 and 1964; and,
      •   Mature – Born between 1928 and 1945.
Moreover, as younger campers continue to be introduced to camping, the industry is poised to
see some real changes. Glamping, a popular form of camping, not only attracts new campers
but also attracts Millennial campers who are looking for new experiences. This new hybrid
suggests the current distribution of overnight accommodations may shift with an increase in
“cabin” and “other” and decrease in “rustic tent” in the foreseeable future.

Along with the changes being driven by younger campers, social factors and technology are
driving changes in the importance of some campground amenities. One consistent trend is a
growing desire to have an experience that is “close to nature”, although this definition may vary
from camper to camper.

Of critical importance is the mission of the National Park Service as stated in the original
authorizing legislation: “…preserve unimpaired the natural and cultural resources and values of
the national park system for the enjoyment, education, and inspiration of this and future
generations.” Our national parks have long been a place for people to escape the real world
and get lost in the majesty of nature. These natural resources are the “magnet” that attract
campers.

1
    Pew Research Center

                                                                                         2|Pa g e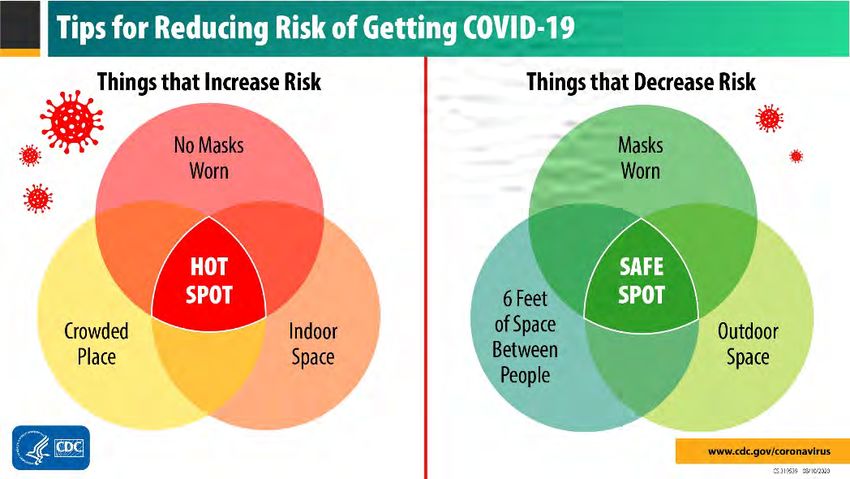
CBRE | Campground Industry 2019 Trends Report | COVID–19 Pandemic Update December 2020

COVID-19 Update

From January 2020, a novel coronavirus disease 2019-nCoV (COVID-19) evolved from an
isolated disease in a region of China into a global pandemic that challenged hospital systems
and dragged the global economy into a recession. The Centers for Disease Control and
Prevention (CDC) on January 21, 2020, confirmed the first case of COVID-19 in the United States
(US) in Washington state.

In September 2020, CBRE was engaged by the NPS to update this report (issued January 9,
2020) due to the COVID-19 impact on the campground industry as this pandemic significantly
affected the travel and tourism industry. The Service commissioned CBRE to revise its
campground industry analysis report to include the probable impact of COVID-19 on the
current campground market and analysis on future demand and changes to visitor expectations
based on current information available.

In pursuit of the COVID-19 report update, the CBRE Team identified and analyzed relevant
industry published studies, data-mined available surveys regarding anticipated consumer
behavior for current and post-pandemic planned activities, examined varied formats of industry
press, and reviewed general economic reports issued since the pandemic began. Additionally,
the CBRE Team re-interviewed a subset of those industry leading operators, concessionaires,
associations, and public land management agency representatives canvassed for the January
2020 report.

                                                                                    3|Pa g e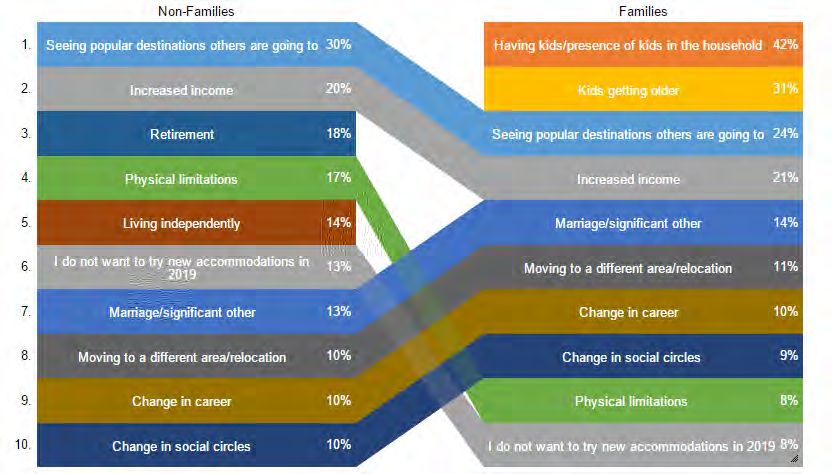
CBRE | Campground Industry 2019 Trends Report | COVID–19 Pandemic Update December 2020

The CDC recommends the following strategies to mitigate the risk of contracting COVID-19:

   •   Maintain at least six feet of space between persons;
   •   Outdoor spaces as indoor spaces with less ventilation and constraints make it
       challenging to keep people appropriately spaced apart; and,
   •   Mask wearing because interacting without mask wearing increases a person’s risk.

Exhibit 1 – Tips for Reducing Risk of Getting COVID-19

Given this guidance, the campground industry appears to be benefitting significantly as the
“Safe Spot” in the intersection among the three things that decrease risk of getting COVID-19
are easily achieved in a campground environment.

After suffering a challenging late winter and spring, the US campground industry rebounded
generally with a strong summer performance that extended past its traditional end of season
(i.e., Labor Day) as people perceived recreating outdoors as safer and healthier than other
travel or leisure activities.

                                                                                     4|Pa g e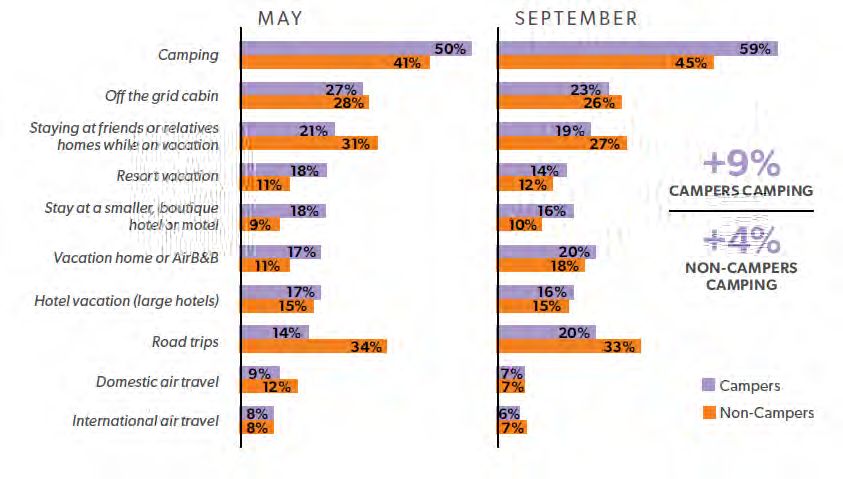
CBRE | Campground Industry 2019 Trends Report | COVID–19 Pandemic Update December 2020

Government regulations, health advisories, and epidemiological forecasts regarding the spread
and containment of the virus should be considered as the next 12-24 months are uncertain.
However, there appears to be a blend of cautious optimism with pragmatic concerns by the
increase in regional camping households and their higher frequency to camp along with first
timers and the re-engagement of past campers with their perceived continued participation.

Again, of critical importance is the mission of the National Park Service as stated in the original
authorizing legislation: “…preserve unimpaired the natural and cultural resources and values of
the national park system for the enjoyment, education, and inspiration of this and future
generations.” Our national parks have long been a place for people to escape the real world
and get lost in the majesty of nature. These natural resources are the “magnet” that attract
campers.

                                                                                         5|Pa g e
CBRE | Campground Industry 2019 Trends Report | COVID–19 Pandemic Update December 2020

Campground Industry Overview
Overall, the campground industry is strong and long-term demand appears robust. Growth
realized is driven primarily through the increase in annual camping households coupled with
their higher frequency to camp. This growth is expected to continue as exiting campers (e.g.,
Mature and Baby Boomer Generations) are replaced by new campers (e.g., Millennials and
Generations X + Z).

Campers come from diverse backgrounds and varied ethnicities. Interestingly, the demographic
breakdown of campers is similar to the population of the US with one notable exception. Asian-
American campers represent approximately three times more than their proportion of the US
population.

Campers’ decisions regarding frequency and where to camp are becoming increasingly
influenced by their life stages and life events. 2 Events such as marriage, starting a family,
retirement, and other factors impact how people camp and what types of potentially new
accommodations, services, experiences, and amenities they try and/or expect. One issue
frequently encountered by campers at high demand parks and areas is a lack of site availability
at both national park campgrounds and private campgrounds when they do not plan ahead.

2Non-North American campers are not included in any known, publicly available and reliable survey data;
however, anecdotally they have similar behaviors and preferences to North American campers.

                                                                                                   6|Pa g e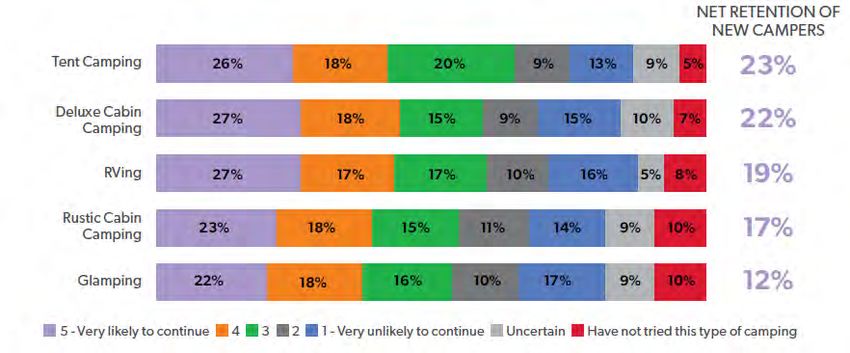
CBRE | Campground Industry 2019 Trends Report | COVID–19 Pandemic Update December 2020

  National Camping Market Trends

  The camping industry is part of a larger segment of the economy known as Outdoor Recreation,
  which includes auxiliary activities that many campers enjoy. In 2018, this segment generated
  roundly $890 billion in economic activity and is detailed 3 in Exhibit 2.

  Exhibit 2 – Activity Revenue 2018
                        Gear, Accessories, and Vehicles                   Trip Related           Total
Camping                         $31,271,155,486                         $135,591,624,999   $166,862,780,485
Fishing                         11,867,666,850                           23,908,160,290     35,775,827,140
Hunting                         16,059,527,274                           11,318,772,808     27,378,300,082
Motorcycle Riding               16,726,560,701                           47,428,610,964     64,155,171,665
Off Roading                     15,520,574,134                           35,996,107,969     51,516,682,103
Snow Sports                     12,530,315,740                           60,190,242,316     72,720,558,056
Trail Sports                    25,342,546,672                           176,144,141,213    201,486,687,885
Water Sports                    29,059,965,205                           110,911,844,967    139,971,810,172
Wheel Sports                    13,857,894,195                           82,864,146,456     96,722,040,651
Wildlife Watching               12,272,757,581                           17,947,854,866     30,220,612,447
Total                          184,508,963,838                          702,301,506,848    886,810,470,686
  Source: Outdoor Industry of America

  National trends in the camping industry are important to understand when evaluating current
  performance and anticipating future performance. The camping industry may be grouped into
  two – generation and ethnicity. These two factors provide some of the most relevant data to
  understanding and predicting camper behavior. Additionally, understanding the preferences of
  these groups allows for the anticipating of future camping needs.

  Historically, most research into the campground or camping market is funded by the private
  sector. The Outdoor Recreation Foundation has been issuing research reports since 2004. The
  earliest of these were broad overviews of the entire outdoor recreation industry. However, as
  funding for these projects became more challenging to acquire, the reports narrowed their
  focus to what equipment people were purchasing rather than where, how, and why people
  were camping. Other research has been performed by the Recreational Vehicle Industry
  Association (RVIA), but that research focused on the marketing and growth of the recreational
  vehicle manufacturing portion of the industry. The American Recreation Coalition (ARC) has
  released some broad-based industry reports. In 2015, Kampgrounds of America (KOA) funded a
  comprehensive, statistical survey of the camping industry produced by Cairn Consulting Group
  (Cairn) and released a public report containing a high-level summary; KOA continues to fund an
  annual update while building its research database with the most recently released report
  being The 2019 North American Camping Report 5-Year Trends. The CBRE Team acquired,
  examined, and analyzed the detailed, in-depth Cairn data 4 as part of our research. It is

  3   Outdoor Industry of America 2018 Recreation Economy Report
  4
      Survey data consists of random, cross-section of all campers in North America

                                                                                                7|Pa g e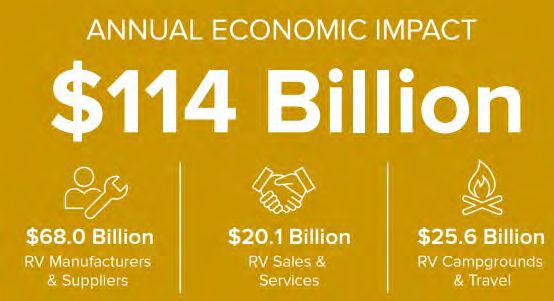
CBRE | Campground Industry 2019 Trends Report | COVID–19 Pandemic Update December 2020

fortuitous that for the first time, the 2019 Cairn survey included a question that identified those
respondents who camped in a national park the previous year.

As illustrated in Exhibit 3, the frequency to camp more than one time per year increased total
multiple annual camper nights by more than 8.2 million.

Exhibit 3 - Annual Camper Nights by Year and Frequency of Camping

         40,000,000

         35,000,000

         30,000,000

         25,000,000

         20,000,000

         15,000,000

         10,000,000

          5,000,000

                 -
                             2014        2015         2016         2017         2018
        3+ Times/Year   10,252,650     11,163,000   13,991,073   17,145,000   17,652,600
        2 Times/Year    16,019,770     17,442,184   17,929,200   16,256,000   16,868,040
        1 Time/Year     5,767,117      6,279,185    5,196,325    5,157,000    4,707,360

Source: Outdoor Industry Association

New camper households primarily drove this growth, chiefly from the influx of younger and
multicultural campers. From 2014 to 2018, there has been a 22 percent increase in annual
camper households. 5

5
    Cairn Consulting Group

                                                                                           8|Pa g e
CBRE | Campground Industry 2019 Trends Report | COVID–19 Pandemic Update December 2020
This influx of younger and ethnically diverse campers has a stronger sense of enthusiasm
associated with camping when compared to that of other campers. This enthusiasm manifested
itself in new campers taking more camping trips and camping nights annually. As seen in Exhibit
3, since 2014 the percentage of campers who camp three or more times annually has increased
by 72 percent.
Exhibit 4 - Growth in Camping Frequency From 2014
Camp 3+ Times/Year
80%
72%
70% 64%
60%
50%
40% 36%
30%
20%
9%
10%
0%
2014 to 2015 2014 to 2016 2014 to 2017 2014 to 2018
Source: Cairn Consulting
9|Pa g eCBRE | Campground Industry 2019 Trends Report | COVID–19 Pandemic Update December 2020
New campers are, in general, somewhat uncertain of how their camping trips might change in
the future. From 2015 to 2018, the retention of campers from year to year grew from 70
percent to 78 percent, which is promising. However, 2019 preliminary numbers show a decline
in retention from 2018. Because of general uncertainty about life changes and other plans,
approximately 17 percent of campers are uncertain about their future camping plans in
2019.This level of uncertainty makes it challenging to speculate if the retention rate is
decreasing, holding steady, or continuing to grow.
Exhibit 5 - Retention Rate Among Campers
80%
78%
78%
76%
74% 73%
72%
70%
70% 69%
68%
66%
64%
2015 to 2016 2016 to 2017 2017 to 2018 2018 to 2019
Source: Cairn Consulting
As stated earlier, the most aggressive camping industry growth segment is younger campers,
which makes understanding their behavior critical. Children are an important part of Millennial
families experiences’, and while a majority report that it was their parents who introduced
them to camping, one out of five say that they were introduced to camping because it was a
great way to travel with kids. They are more likely to self-identify as life-long campers.
10 | P a g eCBRE | Campground Industry 2019 Trends Report | COVID–19 Pandemic Update December 2020
In other words, those who start camping early in life tend to continue camping the rest of their
lives. 6 Understanding the new camper of today should provide insight into the seasoned
camper of tomorrow. Indeed, younger campers are more likely to consider themselves lifelong
campers than other generations. By definition, lifelong campers are expected to continue
camping their entire lives while providing the industry with stable demand. If the trend of
identifying as lifelong campers seen in the Millennial and Generation X (GenX) generations
continue for Generation Z (GenZ), and subsequent generations, overall demand should
continue to experience stability.
Exhibit 6 - Campers Identity as Lifelong or Casual Campers
100%
90%
80%
70%
60%
50%
40%
30%
20%
10%
0%
2016 2017 2018 2016 2017 2018 2016 2017 2018 2016 2017 2018
Millenial GenX Baby Boomer Mature
Lifelong Camper 31% 26% 32% 30% 30% 38% 26% 27% 29% 20% 17% 25%
Occasional Camper (off and on through
51% 51% 47% 55% 53% 50% 65% 58% 61% 68% 73% 66%
life)
New Camper (1-3 years) 11% 14% 13% 10% 11% 8% 5% 8% 5% 7% 6% 3%
First Time Camper 7% 9% 8% 5% 7% 4% 3% 7% 5% 5% 4% 5%
Source: Cairn Consulting
6
Cairn Consulting Group
11 | P a g eCBRE | Campground Industry 2019 Trends Report | COVID–19 Pandemic Update December 2020
Campers utilize a variety of different accommodation types while camping. Tenting is the most
popular option followed by recreation vehicles, cabins, and other accommodations.
Exhibit 7 - 2017 Camping Accommodation Distribution
RV
24%
Cabin
16%
Bivy
1%
Tent
59%
Source: Outdoor Industry Association
The notable differences of distribution among accommodation types between new campers
and regular campers is that of tenting, cabins, and other accommodations. New campers utilize
cabins and other accommodations at higher rates than do regular campers. Cabins in this report
refer to any accommodation other than a tent or RV used on a campground or in a RV park,
including all types of cabins and even yurts, glamping tents, and tree houses. This usage is due
to several factors, such as new campers likely have not invested in all the required equipment,
or they want to acclimate slowly to camping by utilizing a cabin/other accommodation first.
Tent Camping, the most popular form of camping, consists of utilizing a shelter made of sheets
of fabric draped over a frame or supported by a rope. In front country campgrounds, most tent
campers arrive by car and set-up a tent at the campsite while parked next to it.
RV Camping consists of camping in a motor vehicle or trailer designed to be a living quarters.
There are several types including motorhomes, campervans, caravans (aka travel trailers and
camper trailers), fifth wheel trailers, popup campers, and truck campers. RV campers typically
look for campgrounds that have water, electrical, and/or sewer connections as on-board
resources are limited.
Cabin camping consists of staying in a structure constructed out of any number of materials
(e.g., wood). The level of amenities found in a cabin vary greatly from simple, one-room
wooden cabins with no utilities to full modern cottages.
12 | P a g eCBRE | Campground Industry 2019 Trends Report | COVID–19 Pandemic Update December 2020
Bivy campers are typically seen at backcountry campsites but are occasionally seen at front-
country campsites. Bivy is short for bivouac shelter, which is essentially a sack that the campers
sleep-in out in the open. These sites are typically utilized in the military and by mountaineers.
Exhibit 8 - Primary Accommodation Type for New Campers
100%
90%
80%
70%
60%
50%
40%
30%
20%
10%
0%
2015 2016 2017 2018
Tents 48% 43% 53% 41%
RV's 18% 26% 19% 23%
Cabins 31% 27% 25% 34%
Other 3% 4% 3% 2%
Source: Cairn Consulting
13 | P a g eCBRE | Campground Industry 2019 Trends Report | COVID–19 Pandemic Update December 2020
Group Camping
When evaluating group camping, it is important to distinguish between two main group types.
One group type is organizational (e.g., Scouts of America), and the other group type is
comprised chiefly of families and/or close friends. With regard to the latter, it is common for
these campers to utilize a variety of accommodations, which has necessitated the development
of flexible sites at private campgrounds allowing operators to mix and match sites. The
following data pertain to this second type of group camper.
The younger generations, Millennials and GenXers, are more likely to camp with a larger group
than other generations.
Exhibit 9 – Average Camping Group Size by Generation
8.0
7.0
6.0
Average Group Size
5.0
4.0
3.0
2.0
1.0
0.0
Millennials GenX Baby Boomers Mature
2017 5.9 7.0 4.9 4.4
2018 6.0 6.1 5.1 5.0
Source: Cairn Consulting
14 | P a g eCBRE | Campground Industry 2019 Trends Report | COVID–19 Pandemic Update December 2020
When segmented by ethnicity, the data show Hispanics camped with the largest average group
size in 2018. Additionally, the average group size for both African American and Asian campers
decreased from 2017 to 2018.
Exhibit 10 – Average Camping Group Size by Ethnicity
9.0
8.0
7.0
6.0
Average Group Size
5.0
4.0
3.0
2.0
1.0
0.0
White Hispanic African American/Black Asian/Pacific Islander
2017 5.5 7.5 6.5 8.4
2018 5.7 7.5 4.9 6.3
Source: Cairn Consulting
The Impact of RVs on Campgrounds
The Recreational Vehicle industry is a key piece of the campground industry as many campers
do so with their own or rented RVs. This segment generates approximately $114 billion
annually in economic impact, as reported by the RVIA. Approximately 25 million Americans go
RVing annually. 7
RV Camping
Recreational Vehicle camping typically requires campgrounds with more infrastructure than is
needed for rustic camping. RV camping utilization has been strong in recent years, and
approximately one in four campers uses a RV as their primary lodging. The current trend is RV
ownership versus borrowing or renting a rig. This is significant because RV owners are likely to
take more trips with their rigs and participate in RVing longer in life.
7
RVIA
15 | P a g eCBRE | Campground Industry 2019 Trends Report | COVID–19 Pandemic Update December 2020
Exhibit 11 - RV Ownership
80%
70%
60%
50%
40%
30%
20%
10%
0%
Overall Millennials Gen X Baby Boomers Mature
2017 56% 52% 55% 61% 68%
2018 61% 51% 68% 67% 72%
Source: Cairn Consulting
Exhibit 11 shows the change in the percent of RV ownership for those campers who participate
in RVing. For example, the RV ownership rate increased overall from 56 percent to 61 percent.
As illustrated in Exhibit 12, NPS campgrounds appear to be under-capturing this demand
segment. It is important to note that many of the modern RVs are much heavier and longer
than their predecessors and require significant infrastructure and increased energy support.
Exhibit 12 – Total RV Shipments vs. Total RV Overnight Stays at National Parks
Source: RVIA
16 | P a g eCBRE | Campground Industry 2019 Trends Report | COVID–19 Pandemic Update December 2020
Despite the growth in the RV industry since the 1980s, the overall number of overnight stays for
RV users at National Parks is a long-term downward trend. This trend may be reversed with
curing deferred maintenance and implementing other worthwhile infrastructure
improvements. The CBRE Team believes that the improvements important to implement are
those that support RVs without significantly impacting negatively the aesthetics of NPS
campgrounds. Initiatives such as reinforcing existing roads, redesigning campgrounds allowing
for wider roads and pull-throughs, longer pads, and buried electrical cables, water and/or
sewer lines should support modern RVs while keeping the existing feel of campgrounds.
There are also nationally recognized codes for RV campgrounds that are recommended to be
adopted by the NPS and are discussed in a subsequent section.
National Economic and Demographic Trends
By drilling down into the various camping industry’s demand segments, we can start to
appreciate what is driving recent growth. Industry best practices indicate that segmenting
campers by their generation provides significant insight into behaviors and the preferences that
motivate them.
As stated earlier, life stages and life events have the largest impact on campers’ behavior. For
example, whether children will be a part of the camping trip is a great influence on the type and
location of campground that campers select.
17 | P a g eCBRE | Campground Industry 2019 Trends Report | COVID–19 Pandemic Update December 2020
Exhibit 13 - Ranking of Life Events That Impact Camping 2018
Source: Cairn Consulting
Economic factors are driving Millennials’ experiences. GenX campers are likely to mention that
their children getting older has an impact on their camping experiences. Boomers and Mature
campers state retirement is the impetus for new experiences. Among families, having children
and children getting older are most likely to impact their experiences, while seeking new
destinations has the greatest impact on non-family campers.
The trend of Millennials seeking popular destinations may be tied to their exposure to these
places on social media from their friend’s trips. This exposure can do two things. People who
have not camped before will be incentivized to try these new experiences and post them to
social media for fear of missing out, and it can eliminate the fear of the unknown of these
destinations as they have become more familiar through social media exposure.
Understanding Family Camper Preferences
Millennial families are an important demand sub-segment to understand because they
represent the future of camping. They are teaching their children a love for the outdoors who,
in turn, will hopefully become campers as well in the tradition of their parents. Those who start
camping early in life tend to continue camping for the rest of their lives.
18 | P a g eCBRE | Campground Industry 2019 Trends Report | COVID–19 Pandemic Update December 2020
Millennial families form the most avid group of Millennial campers and are most likely to
identify themselves as new to camping in 2018. They report taking more trips and spending
more nights camping and are substantially more likely to camp more often in the future.
Exhibit 14 - Camping Trips and Camping Nights 2018
70%
60%
50%
40%
30%
20%
10%
0%
Couple w ith
Single, No Kids Couple, No Kids Single Parent
Kids
3+ Trips/Year 21% 34% 26% 39%
< 7 Nights/Year 40% 57% 49% 63%
Source: Cairn Consulting
Year-to-Year, families are more likely to seek campgrounds based on the atmosphere,
especially locations, that have “kid-friendly” on-site recreation. Children are an important part
of their experiences, and while a majority report that it was their parents who introduced them
to camping, one out of five state they were introduced to camping because it is a great way to
travel with kids; they are more likely to self-identify as life-long campers.
Campers’ decisions are driven by many factors that influence where and how they camp. For
families, children are most likely to impact their experiences. For non-family campers, the
desire to seek new destinations has the greatest impact. The following exhibit compares the
importance of various life events and their impact on camping decisions.
19 | P a g eCBRE | Campground Industry 2019 Trends Report | COVID–19 Pandemic Update December 2020
Exhibit 15 - Rank of Life Events that Impact Camping 2018
Source: Cairn Consulting
Camping is seen by most campers as a way to escape and relax from the stresses of everyday
life. Campers have a wide variety of objectives from just enjoying the campground atmosphere
to engaging in physical activities like hiking or swimming. A subsequent section of this report
explores in more detail the top camper objectives enjoy while camping.
Ethnic and Cultural Preferences
Another important demand segment identified by industry best practices is the ethnic
background of campers. Cultural influences greatly impact the decisions and preferences of
people, so it is important to understand how culture influences the behavior of various groups.
In 2017 and 2018, approximately half of the newest campers originated from non-white ethnic
groups. White and African American campers made up a similar proportion of new campers as
they do in census data. In contrast, Asian and Hispanic campers are overrepresented in their
numbers as new campers compared to the census data. Hispanic campers exceeded what
would be expected in the overall population (22 percent versus 16 percent for census figures),
and Asian campers are still represented at a rate three times of what would be expected (14
percent versus five percent for census figures).
20 | P a g eCBRE | Campground Industry 2019 Trends Report | COVID–19 Pandemic Update December 2020
Exhibit 16 - New Camper Demographic Profile vs Census Demographic Profile of the US
100%
90%
80%
70%
60%
50%
40%
30%
20%
10%
0%
Census 2017 New Campers 2018 New Campers
Other 3% 2% 1%
Asian 5% 17% 14%
Hispanic 16% 17% 22%
African American 12% 14% 14%
White 64% 51% 49%
Source: Cairn Consulting
Although Asian and Hispanic new campers may have over representation as compared to the
census data, white campers have the largest percentage of all campers for lifelong camper.
Exhibit 17 - Camper Type by Ethnicity
100%
90%
80%
70%
60%
50%
40%
30%
20%
10%
0%
2015 2016 2017 2018 2015 2016 2017 2018 2015 2016 2017 2018 2015 2016 2017 2018
White Hispanic Afican American Asian
First Time Camper 4% 4% 5% 4% 8% 8% 12% 12% 11% 9% 14% 8% 11% 11% 17% 10%
New Camper (1-3 years) 7% 8% 8% 7% 15% 15% 17% 17% 12% 23% 13% 14% 25% 29% 28% 18%
Occasional Camper (off and on through
59% 55% 56% 53% 56% 52% 50% 46% 53% 48% 50% 45% 50% 46% 45% 52%
life)
Lifelong Camper 30% 33% 30% 36% 21% 25% 21% 25% 23% 21% 22% 34% 15% 13% 10% 21%
Source: Cairn Consulting
21 | P a g eCBRE | Campground Industry 2019 Trends Report | COVID–19 Pandemic Update December 2020
African American Campers
The African American demand segment is important to understand because it is the youngest
demographic of the camper segments, with 64 percent Millennial representation. One-third
identify as lifelong campers; two-thirds camp in tents, a rate similar to Asian Americans yet
below both white and Hispanic campers.
Generally, African American campers reportedly highly value campground atmosphere when
selecting a campground. Almost half (48 percent) say that Wi-Fi is not important, which is much
higher when compared to both Hispanic (37 percent) and Asian American (35 percent) campers.
African American campers who camp in a RV are least likely to own the RV (33 percent)
compared to 62 percent overall. 8
Compared to other campers, African American campers are most likely to state that camping
allows them to blow off steam (64 percent versus 54 percent) but are equally likely to identify
the benefits of camping such as stress reduction, clearing their minds, and escaping everyday
life. 9
And, overall, the African American camper market could represent a growing camper segment
by not only being the youngest camper group (as noted previously) but appear to be using
camping as a way to get their children outdoors.
Hispanic Campers
Since 2014, representation among Hispanics has increased by five percentage points in camping
participation. Hispanic households represent 11 percent of all camping households, the largest
non-white group of campers. Twenty two percent of new campers in 2018 were Hispanic. This
segment represents the fastest growing based on ethnicity (up from six percent in 2014 to 11
percent in 2018). 10
While Hispanic campers are just as dedicated in their camping as other groups of campers, they
represent a much more optimistic group reporting a higher likelihood to increase their camper
nights (64 percent) and camping trips (50 percent) in the coming year. 11
Hispanic campers are also trying different types of camping. Their decisions on how and where
to camp are being largely influenced by the cultural norms of the group. Over the past four
years, usage of tents decreased while usage of cabins, whether primitive or luxury, 12 increased
by 10 percentage points. 13
8
Ibid
9 Ibid
10Ibid
11 Ibid
12 Data unavailable to quantify number of cabin subsets
13 Cairn Consulting Group
22 | P a g eCBRE | Campground Industry 2019 Trends Report | COVID–19 Pandemic Update December 2020
Hispanic campers are also most likely to have tried some type of new accommodation in 2018
(66 percent) and are significantly more likely than other campers to have tried a towable RV
(aka fifth wheel) in 2018 (21 percent). Reinforcing the idea that Hispanic campers are seeking
new ways of camping and types of camping experiences, they are most likely to want to try an
RVing experience (58 percent) or to experience “van life” (22 percent). About one-fourth of
Hispanic campers stay in RVs, yet about half do not own the RV they use most, resulting in
Hispanic households highly likely (69 percent) to consider renting an RV from a peer-to-peer
listing. Hispanics are highly social campers. They are the most likely to camp with multiple
generations of family members (74 percent), most likely to camp with larger groups of campers
(eight campers on average) when compared to other campers and are more likely than other
campers to say that a group outing sparked their interest in camping (25 percent versus 15
percent overall). 14
Recreation and activities are important to Hispanic campers, with fully half (50 percent versus
40 percent among other campers) stating that on-site recreation is important and are most
likely to agree that they like campgrounds with organized activities (44 percent versus 32
percent overall). Hispanics are the group of campers most likely to leave the campground to go
shopping (43 percent versus 32 percent among other campers) and enjoy the area nightlife (24
percent versus 15 percent overall).14
Asian American Campers
Asian American campers represented approximately seven percent of the overall campers
which is up from one percent in 2012. They are the smallest ethnic group, other than “other”
but unlike African American and Hispanic groups they are represented higher than their census
figures. 14 percent of new campers in 20418 were Asian Americans, tied with African
Americans. This was down from 2017 but up from the 2015 figures.
Asian American campers are most likely to say that a variety of sources influence their
decisions; the influence of both social media and travel bloggers is directly related to the age of
the camper. Younger campers tend to use social media where older generations prefer the
travel blogs or guides and handbooks. They are the group most likely to express a desire to try
glamping and their relatively high use rates of social media likely has an impact on this
outcome.
Asian American campers are significantly more likely to say that their desire to try new lodging
allows them to travel in comfort and travel further distances. They are most likely, out of the
other ethnic groups, to travel 100 miles or further from home for a camping trip. However,
despite their expressed desire for glamping and trying new accommodations they and African
14
Ibid
23 | P a g eCBRE | Campground Industry 2019 Trends Report | COVID–19 Pandemic Update December 2020
American campers stay at National Parks at the highest rates. This suggests that the desires for
glamping and a variety of accommodation types is being satisfied with existing offerings.
COVID-19 Update
For many in the campground industry, the early news of COVID-19 caused grave concern.
Campground owners and managers, which include both public and private sector, began to
consider the impacts of this pandemic and how they would manage risk. For instance, would
they open their campgrounds this calendar year? If so, when and at what guest-level
capacities? How would these venues be staffed? What operational modifications or changes
would need to be implemented (e.g., enhanced sanitation programs, effective communication
processes with local public health agencies, employee health checks, contactless camper check-
in)?
Similarly, associations and organizations associated with the campground industry sought to
learn more and develop/offer tools as well as to support their constituents in this extremely
difficult environment. Although examples are quite numerous, some include:
• KOA issued an enhanced cleaning and disinfecting procedures manual for its franchisees
as well as published two special reports (May and October 2020).
• National Association of RV Parks and Campgrounds (ARVC) launched a comprehensive
toolkit. 15
• Outdoor Recreation Roundtable (ORR) created and delivered many Outdoor Recreation
Industry and Coronavirus resources.
• Numerous government agencies presented comprehensive public health guidance
specifically focused on campgrounds (e.g., California Department of Public Health and
Minnesota Department of Natural Resources).
Likewise, these parties and others have studied and/or reported the operational and financial
progress of the industry since COVID-19 entered the US.
National
After suffering a challenging late winter and spring, the US campground industry rebounded
generally with strong summer performance that extended past its traditional end of season
(i.e., Labor Day) as people perceived recreating outdoors as safer and healthier than other
travel or leisure activities. Looking forward, there is an apprehensive optimism given the
15Content was an industry-wide collaborative effort with Kampgrounds of America (KOA), the Outdoor Recreation
Roundtable (ORR), the Canadian RV Association (CRVA), Marshall & Sterling Insurance, state associations and many
other industry partners https://www.arvc.org/Blog/1084/Coronavirus-What-You-Can-Do-to-Protect-Yourself,-
Your-Employees-and-Campers
24 | P a g eCBRE | Campground Industry 2019 Trends Report | COVID–19 Pandemic Update December 2020
increase in regional camping households and their higher frequency to camp along with first
timers and the re-engagement of past campers with their perceived continued participation.
According to the ORR, the outdoor recreation industry is a significant component of the US
economy. Prior to the pandemic, this industry comprised 2.2 percent of Gross Domestic
Product (GDP) and supported roundly 5.2 million jobs. While outdoor businesses have been
affected negatively by the pandemic and government lockdowns, guidance of safer behavior
(e.g., Exhibit 1) appear to have reenergized people’s recreating outdoors. The ORR reported
that less than 50 percent of Americans enjoyed an outdoor experience in 2019, but its May
2020 survey reported that 81 percent of Americans spent time outside during the pandemic,
with 32.5 percent turning to outdoor recreation for the first time.
On July 31, 2020, National Geographic declared: “Suddenly, camping is all the rage.” This article
cited multiple examples of why this statement was true. For instance, The Dyrt camping trip
planning website reported its 2020 summer site traffic up 400 percent year-over-year and that
20 percent of KOA’s guests were first-time campers. Further, author Aryana Azari speculated
these companies, and inferred others, benefitted financially or by heightened interest with
Americans desire to social distance, to leave their homes, and to enjoy a safe summer. Outdoor
recreation, to include camping, was a viable alternative. 16
Based on its August 2020 survey, ORR reported the results of 23 participating national outdoor
recreation trade associations, which represented more than 25,000 businesses with nearly 2.5
million employees. Of these, 22 percent of businesses in August reported an increase in sales as
compared to a year ago.
Tentrr, a booking platform that lists more than 800 campsites in the US, reported it experienced
900 percent growth this quarter compared to last quarter, and 400 percent growth compared
to the same period in the prior year. According to Chief Executive Officer Anand Subramanian,
the largest increase for site demand was within a two-hour driving radius of cities. 17
For the week of August 10, 2020, the average weekly revenue at open campgrounds and RV
parks located in gateway towns adjacent to national parks realized a 49 percent increase year-
over-year as compared to their cross-state and national peers. 18
In September 2020, the Outdoor Industry Association (OIA) stated that data confirmed an
increase in outdoor activities due to COVID-19 from April through June of 2020. This period as
compared to the same period in 2019, unweighted participation rates for day hiking rose more
than any other activity measured, up 8.4 percent. For urban participants, day hiking, bird
16
https://www.nationalgeographic.com/travel/2020/08/how-to-go-camping-during-covid/#close
17 https://www.theguardian.com/us-news/2020/jul/11/camping-glamping-coronavirus-americans
18 Data compiled and analyzed by Wombly (https://www.womply.com/). Its conclusions were based on analysis of
credit and debit card transaction data at 1,500 local businesses near national parks including Acadia, Arches,
Badlands, Bryce Canyon, Capitol Reef, Carlsbad Caverns, Crater Lake, Glacier, Grand Canyon, Great Smoky
Mountain, Joshua Tree, Mesa Verde, Olympic, Redwood, Rocky Mountain, Yellowstone, Yosemite, and Zion.
25 | P a g eCBRE | Campground Industry 2019 Trends Report | COVID–19 Pandemic Update December 2020
watching, and camping participation all rose noticeably since the March 2020 government
mandated restrictions. 19
According to the KOA North American Camping Report Fall 2020 Update, 20 camping activity
beat expectations. Highlights include:
• Campers and non-campers rank camping as the safest form of travel. When asked to
compare camping to other forms of travel, 56 percent of leisure travelers, 63 percent of
campers, and 49 percent of prospective campers felt camping was a safer alternative.
• The following exhibit illustrates the perceived safety of camping.
Exhibit 18 – Rankings of the Safest Forms of Travel
Source: Cairn Consulting
• Although 17 percent of leisure travelers planned to take a camping trip (May 2020
survey), 21 percent (an increase of four percent) took a camping trip between May and
September 2020 once government travel restrictions were lifted (September 2020
survey).
19 These data plan to be rolled into a full-year participation study published by the OIA in 2021. The annual study
plans to start with a nationally representative panel of over one million Americans and feature responses from
over 8,000 people ages 6 and older. The study currently includes 122 separate sports, fitness and recreational
activities.
20 Survey conducted 4-9 September 2020 by Cairn Consulting Group, report issued October 1, 2020.
26 | P a g eCBRE | Campground Industry 2019 Trends Report | COVID–19 Pandemic Update December 2020
• 42 percent responded they will still take planned camping trips during the remainder of
this year (2020).
• Camping continues to be a family activity by survey respondents who indicated they
have children in their household: 82 percent of first time campers and 70 percent of
campers who restarted camping this year (2020).
• More than half of all campers (51 percent) say that they are now more likely to
purchase an RV.
o Of these campers, Gen Xers (62 percent) are the most inclined to consider
purchasing an RV.
o Among prospective RV campers, 34 percent would buy an RV to go on a
camping trip while 32 percent would plan to rent one.
• New and re-engaged campers represent a much younger demographic, primarily
Millennials who comprise 40 percent of all campers and 55 percent of new campers
who indicated taking their first camping trip since the start of the pandemic.
Recent data regarding RVs portend a rebound with a guardedly optimistic outlook for the
campground industry.
• In the Fall 2020 RVIA quarterly RV RoadSigns newsletter, a surge in RV shipments is
anticipated through 2021. The 507,200 units projected for 2021 would represent the
best annual total on measurable record for the RV industry, eclipsing the 504,600 units
shipped in 2017.
• RV shipments were up by 54 percent in July 2020, the highest July shipment numbers in
four decades, as reported in the RVIA's monthly survey of manufacturers.
• According to the RVIA News & Insights report, web traffic to the Go RVing website
reached record highs in August (2020) and surpassed all historical data since tracking
started (2012).
• Cruise America, which sells and rents RVs and is the nation's largest RV rental company
with 132 locations and approximately 300 employees during peak season in the US and
Canada, 21 reported its US business is “booming”. Moreover, the company relayed
notable growth among families in addition to 21- to 29-year-old consumers. 22
21 https://www.cruiseamerica.com/about/our-history
22
https://www.theguardian.com/us-news/2020/jul/11/camping-glamping-coronavirus-americans
27 | P a g eCBRE | Campground Industry 2019 Trends Report | COVID–19 Pandemic Update December 2020
• The RV rental marketplace also experienced a big surge. Peer-to-peer RV rental
companies report the following:
o RVshare began operating its platform in 2013 and reached its one million days
booked in July 2019. Thirteen months later, it doubled this number to two
million days booked. 23
o Outdoorsy experienced strong growth as demonstrated in June 2020, when the
company reported its highest number of bookings in a single day, reflecting a
240 percent year‐over‐year increase.
Utilization and Frequency
During this pandemic, virtual working and remote learning (aka road schooling) contributed
significantly to the utilization of campgrounds. With approximately one in four Americans still
working entirely from home (as of August 2020) 24 coupled with many primary and secondary
schools across the US closed for the fall (2020) semester, the spring (2021) semester’s
requirement for in-person working or schooling is uncertain. Hence, utilization of campgrounds
should continue to be positive.
Adults and families caused campgrounds’ (i) weekday utilization and (ii) length of stay to
increase year-over-year. Numerous sources interviewed by CBRE cited length of stay nearly
doubled and summer season occupancy was up 10-20 percent year-over-year at their
campgrounds. Reportedly, this confluence of events helped the campgrounds to not only make
up for lost camper nights and revenue from the spring but also caused significantly high
occupancies through the summer months and into the fall of 2020.
Of new campers, it is estimated approximately 18 percent will continue camping in 2021.
(Those new campers who self-identified as tent or cabin campers appear to have the highest
likelihood of continuing to camp in 2021.) 25
23 https://www.rvnews.com/rv-rental-marketplace-reports-big-recent-surge/
24 https://www.washingtonpost.com/lifestyle/2020/10/05/roadschooling-rv-families-covid/
25 Survey conducted 4-9 September 2020 by Cairn Consulting Group, report issued October 1, 2020.
28 | P a g eCBRE | Campground Industry 2019 Trends Report | COVID–19 Pandemic Update December 2020
Exhibit 19 – New Campers to Continue Camping in 2021
Source: Cairn Consulting
Of these new campers, 44 percent of both RV and tent campers and 40 percent of new
glampers indicated they are likely to continue camping into 2021. 26
Mike Gast, Vice President of Communications at KOA, stated several of their campgrounds
reached capacity. In addition, he said more than 20 percent of campers were first timers, which
suggests increased demand for 2021. 27
For the future, market participants and observers expect the industry to begin to return to a
state of normalcy but anticipate this will take a couple of years.
Type of Accommodation
As was true before COVID-19, campers utilized a variety of different accommodation types
while camping. Tenting continued to be a very popular option, but RV and cabin utilization
surged. Reportedly, many first timers also glamped.
However, group camping was essentially non-existent as CDC guidelines made this an
unacceptable offering. Once government restrictions are lifted and group activities are again
perceived to be safe, these campsites should come back online. Similarly, utilization may likely
depend on perceived safety.
Investment
The campground industry’s resilience to the Great Recession (December 2007 to June 2009)
and current COVID-19 Recession suggests an attractive investment potential to equity
investors, including select Real Estate Investment Trusts (REITs).
26 Ibid
27
https://www.theguardian.com/us-news/2020/jul/11/camping-glamping-coronavirus-americans
29 | P a g eCBRE | Campground Industry 2019 Trends Report | COVID–19 Pandemic Update December 2020
For instance, the RV News reported a record-breaking deal that closed on September 22, 2020,
for an Arizona RV resort in Apache Junction with 1,119 sites. It sold for $88 million, which is
nearly $80,000 per site. 28
Michael Escobedo, an associate at Marcus & Millichap, said he tracked 15 transactions of RV
resorts across Arizona that sold this year (through mid-September 2020) with the average price
per pad of nearly $30,000. Most of these RV resorts sold in the $1 million to $2 million range. 29
Equity LifeStyle Properties (ELS), a REIT with nearly 200 RV resorts and campgrounds plus more
than 200 manufactured housing communities across the US reported positive third quarter
2020 earnings. For instance, the nine months ended September 30, 2020, total revenues
increased 5.3 percent. Labor Day weekend RV transient revenue growth was 16.8 percent year-
over-year. Recently, ELS completed multiple acquisitions: October – two RV Parks for $36
million and two development properties for RVs for $16.3 million; September and October –
five land parcels to expand owned communities for $6.4 million. All acquisitions were funded
with available cash.
SUN Communities (SUI), a REIT that owns and operates or has an interest in 432 RV and
manufactured housing communities located in 32 states throughout the US and Ontario,
Canada reported positive third quarter 2020 earnings. For instance, the nine months ended
September 30, 2020, total revenues increased 5.4 percent. RV resorts were exceptionally
strong, as campers elected drive-to vacation options and took advantage of SUI’s vacation
destinations featuring lakes, mountains, and beaches. In July and September, SUI acquired four
RV communities for $140.5 million, consisting of 1,331 sites and the potential to develop
another 109 sites.
For those interviewed by CBRE, many stated secured debt was easier to acquire today than 15
years ago.
Capital Projects
For those interviewed by CBRE, the majority stated that in early 2020, they elected to cancel
most of quarter two and quarter three projects. Yet, the strength of quarter three’s cashflows
bolstered confidence to begin new projects in earnest the following quarter and into 2021.
Some campground owners accelerated scheduled 2021 projects to quarter four 2020 or earlier
to the 2021 preseason.
One respondent stated none of their projects were delayed. Instead, they increased scope to
upgrade electrical capacity, add sewer for full hookups, and build more comfort stations.
28 https://www.rvnews.com/arizona-rv-park-sold-for-record-breaking-88m/
29
https://woodallscm.com/rv-park-in-apache-junction-ariz-sells-for-record-88m/
30 | P a g eCBRE | Campground Industry 2019 Trends Report | COVID–19 Pandemic Update December 2020
Returns on Investments (ROI)
No CBRE interview respondents would quantify their preferred hurdle rate, though none stated
these rates changed significantly since the pandemic began. Respondents were optimistic given
increased RV sales and rentals, the number of first timers and those re-engaging in camping,
and COVID-19 guidance recommending outdoors as a healthier and less risky activity.
31 | P a g eCBRE | Campground Industry 2019 Trends Report | COVID–19 Pandemic Update December 2020
Trends in Consumer Spending Behavior
Determining accurate national trends in consumer spending for the campground industry is not
possible as the industry is comprised of many small, independent operators who do not report
data (unlike the hotel industry that is more transparent). As such, there is no one central
industry organization that collects and analyzes overall industry performance.
The total economic impact of the camping industry can be measured more easily. In 2018, the
Outdoor Industry Association reported that the camping segment of the Outdoor Recreation
Economy realized over $31 billion of gear, accessory, and vehicle sales and over $135 billion in
direct trip-related spending. This resulted in an overall economic impact of nearly $167 billion.
In June 2019, RVIA reported that the RV segment of the Outdoor Recreation Economy realized a
$25.6 billion economic impact.
Exhibit 20 - Recreational Vehicle Economic Impact
Source: RVIA
Although national campground industry consumer spending is not available, anecdotal
information gathered from numerous operator interviews may give insight.
The typical daily rates for campsites range from a low of approximately $20 for primitive tent
sites to approximately $100 for full hook-up, premium pads. This price range may grow or
shrink depending on the geographic area of the campground, the size of the pad, and available
connections.
Some examples of the differences in pricing are, for example, the typical rates at United States
Forest Service (USFS) campgrounds. Fees for campgrounds (not park entrance fees) vary from
32 | P a g eCBRE | Campground Industry 2019 Trends Report | COVID–19 Pandemic Update December 2020
free to $30 per day for individual sites (double and group sites cost more). Typical add-on fees
run from $5 to $12 per day for pets, second vehicle, extra guests, boat launch, etc.
Camping and day use permits are the backbone of the campground industry. However,
depending on where the campground is located, retail and rental fees can sometimes generate
a substantial portion of an individual campground’s total revenue.
An interesting example of an existing lakeside concession-operated campground, on quasi-
government land and completely renovated circa 2010, with approximately 140 short- and
long-term RV sites plus approximately five camping cabins realized the following sales in 2018:
• $900,000 – Gross Sales
o $300,000 – Extended Stay (half of the sites)
o $400,000 – Short term (half of the sites)
o $20,000 to $30,000 – Day use fees 30
o $70,000 to $80,000 – Retail and firewood
o $80,000 to $90,000 – Equipment rental, boat launch
In most typical campgrounds, the campsite or RV pad rental will be the revenue driver – not
retail or equipment rental sales. On average, camp stores will account for approximately eight
to 10 percent of gross revenue. Other revenue departments’ contribution to the top line will
vary to a greater degree due to the campground’s location and how aggressively operators
pursue these revenue streams.
Below is an example revenue and expense statement from a typical USFS concessionaire-
operated campground.
30The concessionaire recognized the full amount and paid the owner (quasi-government agency) a portion of this
fee in its contractual lease payment (franchise fee in NPS terminology)
33 | P a g eYou can also read