RECREATIONAL VEHICLE CAMPING IN ALBERTA: A DEMAND AND SUPPLY SIDE PERSPECTIVE - THE PRAXIS GROUP
←
→
Page content transcription
If your browser does not render page correctly, please read the page content below
THE
             RECREATIONAL VEHICLE CAMPING IN ALBERTA:
PRAXIS
GROUP ™      A DEMAND AND SUPPLY SIDE PERSPECTIVE

                             Prepared for:
    Tourism Business Development, Research and Investment Branch
                 Alberta Tourism, Parks and Recreation
                              March 2009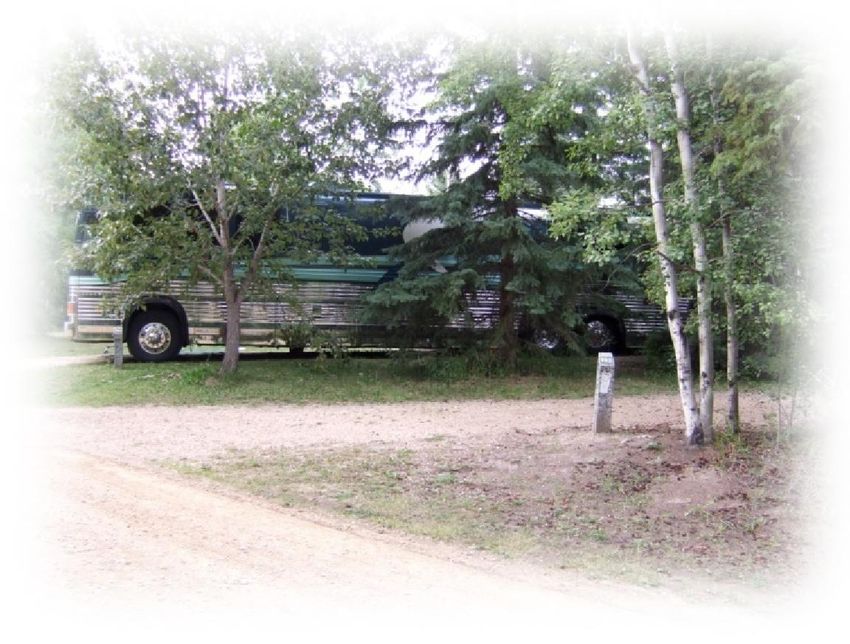
Recreational Vehicle Camping in Alberta: A Demand and Supply Side Perspective                                                           1

Table of Contents
   Table of Figures................................................................................................................................................. 3

ACKNOWLEDGEMENTS ...........................................................................................................4

EXECUTIVE SUMMARY ............................................................................................................5

1.0 STUDY BACKGROUND AND PURPOSE ............................................................................7

   1.1 Background.................................................................................................................................................. 7

   1.2 Methods ....................................................................................................................................................... 8

2.0 ALBERTA’S CAMPGROUNDS ..........................................................................................10

   2.1 Campground Characteristics by Tourist Destination Region ........................................................................ 18

   2.2 Assessment of Camping Supply.................................................................................................................. 20

3.0 PROFILE OF ALBERTA RV CAMPERS ...........................................................................21

   3.1 Camping Equipment Used .......................................................................................................................... 21

   3.2 Camping Destinations ................................................................................................................................ 23

   3.3 Demographic Profiles of Recreational Vehicle Campers ............................................................................. 24

   3.4 Camping Patterns ....................................................................................................................................... 25

   3.5 Services and Amenities Sought by RV Campers ......................................................................................... 26

   3.6 Best and Worst Features of Campgrounds.................................................................................................. 30

   3.7 Preference for Campground by Operator Type ............................................................................................ 32

   3.8 Campground Occupancy ............................................................................................................................ 33

   3.9 Assessment of Camping Demand ............................................................................................................... 35

                       The Praxis Group™, Building B1, Room 242, 2451 Dieppe Avenue SW Calgary, AB T3E 7K1
Recreational Vehicle Camping in Alberta: A Demand and Supply Side Perspective                                                      2

4.0 ASSESSMENT OF COMPETITION ....................................................................................36

   4.1 Camping in Saskatchewan .......................................................................................................................... 38

   4.2 Camping in British Columbia ..................................................................................................................... 39

5.0 TRENDS AFFECTING ALBERTA’S RV CAMPING INDUSTRY .......................................41

   5.1 Current Outlook for Travel ......................................................................................................................... 41

   5.2 Impact of Current Economic Conditions on the RV market ......................................................................... 43

   5.3 Trend in RV Sales ...................................................................................................................................... 45

   5.4 Trends in Camping Within Alberta ............................................................................................................. 48

   5.5 Trends and Innovations in RV Camping ..................................................................................................... 49

   5.5 Economic Impact ....................................................................................................................................... 56

6.0 ALBERTA’S RV CAMPGROUND INDUSTRY – STRENGTHS, WEAKNESSES,
OPPORTUNITIES AND THREATS ..........................................................................................57

   6.1 Strengths of Alberta’s Campground Product ............................................................................................... 57

   6.2 Weaknesses in Alberta’s Camping Industry ................................................................................................ 57

   6.3 Opportunities for Alberta’s Camping Industry ............................................................................................ 58

   6.4 Threats to Alberta’s Camping Industry ....................................................................................................... 61

7.0 CONCLUSIONS AND RECOMMENDATIONS ...................................................................63

APPENDIX A: MINIMUM STANDARDS FOR ALHA CAMPGROUNDS ..................................65

APPENDIX B: EXPERT INTERVIEWS .....................................................................................66

BIBLIOGRAPHY ......................................................................................................................67

                      The Praxis Group™, Building B1, Room 242, 2451 Dieppe Avenue SW Calgary, AB T3E 7K1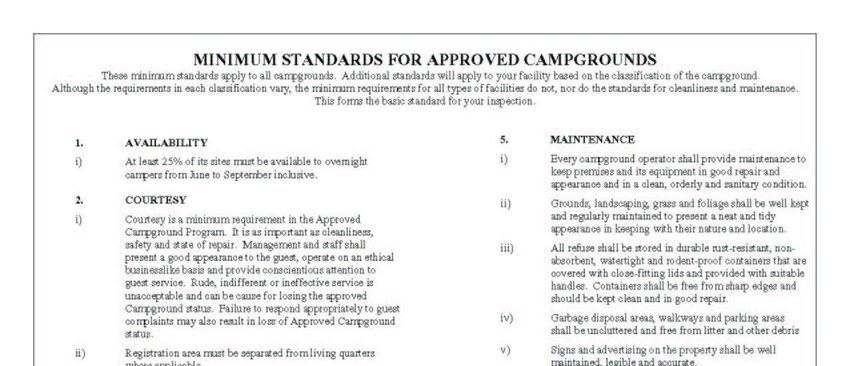
Recreational Vehicle Camping in Alberta: A Demand and Supply Side Perspective                                      3

Table of Figures
Figure 1 Campground Administration (% of campsites) .......................................................................... 11
Figure 2 Campsites with Power.............................................................................................................. 12
Figure 3 Campsites with Water .............................................................................................................. 12
Figure 4 Amenities by Operator (campgrounds)..................................................................................... 13
Figure 5 Firewood in Alberta’s Campgrounds* ....................................................................................... 15
Figure 6 Campsites by Tourist Destination Region.................................................................................. 18
Figure 7 Tourist Destination Regions...................................................................................................... 18
Figure 8 Campsites with Power and Water Hookups by Tourism Destination Region ............................. 19
Figure 9 Camping Equipment used in Provincial and National Parks ....................................................... 21
Figure 10 Recreational Vehicle Ownership in Canada............................................................................. 22
Figure 11 Recreational Vehicle Type by Province ................................................................................... 23
Figure 12 Percent of RV Camping in Alberta by Province ........................................................................ 24
Figure 13 Average Age of RV Owners (BC, AB, SK) .................................................................................. 24
Figure 14 Average Household Size of Recreational Vehicle Owners (AB, BC, SK) ..................................... 25
Figure 15 Average Camping Nights in 2008 by RV Type and Province ..................................................... 25
Figure 16 Priorities among Alberta Recreational Vehicle Campers ......................................................... 26
Figure 17 What make some campgrounds better than others? .............................................................. 30
Figure 18 What makes some campgrounds worse than others?............................................................. 31
Figure 19 Preference for Operator by Province ...................................................................................... 32
Figure 20 Preference for Operator by RV Type ....................................................................................... 33
Figure 21 Seasonal Distribution of Use in Provincial Park Campgrounds (2004) ...................................... 35
Figure 22 Where Alberta RV Owners Camp (camper nights) .................................................................. 36
Figure 23 Where British Columbia RV Owners Camp (camper nights) .................................................... 37
Figure 24 Where Saskatchewan RV Owners Camp (camper nights) ........................................................ 37
Figure 25 Will Current Economic Conditions Affect RV Camping?........................................................... 44
Figure 26 How will Camping Participation be Affected by Economy (37% of campers)? ......................... 45
Figure 27 Number of Years Owned Current RV ...................................................................................... 46
Figure 28 Anticipate Purchasing an RV in the Near Future ..................................................................... 47
Figure 29 Camping Trends in Alberta (camper nights) ............................................................................ 48
Figure 30 Camping Trip Expenditures in Alberta..................................................................................... 56
Figure 31 What would encourage you to camp more often in Alberta? Alberta campers ....................... 60
Figure 32 What would encourage you to camp more often in Alberta? BC and SK campers ................... 61

                    The Praxis Group™, Building B1, Room 242, 2451 Dieppe Avenue SW Calgary, AB T3E 7K1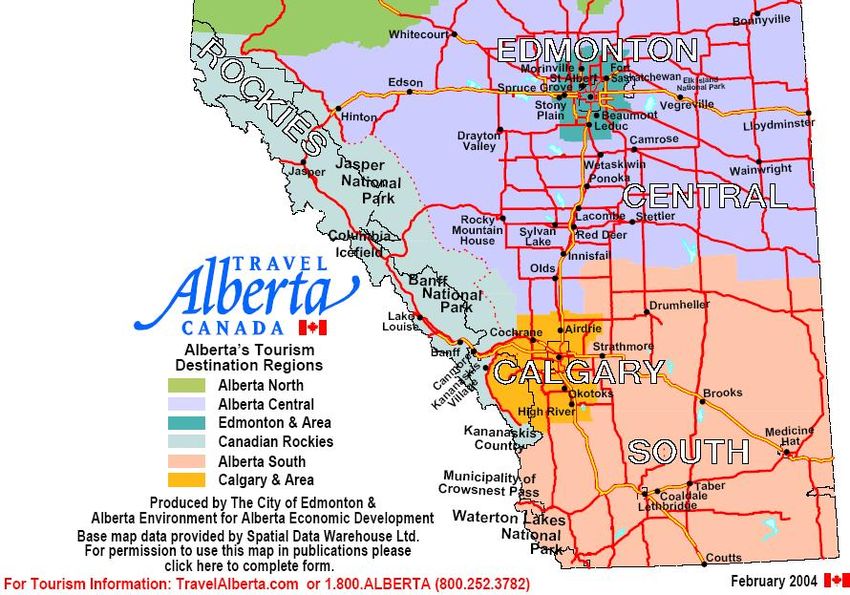
Recreational Vehicle Camping in Alberta: A Demand and Supply Side Perspective       4

Acknowledgements

This study was commissioned by the Tourism Business Development, Research and Investment Branch
of Alberta Tourism, Parks and Recreation (ATPR). The advisory team for the study included
representatives from ATPR, the Alberta Hotel and Lodging Association and the Recreational Vehicle
Dealers Association of Alberta. The authors would also like to acknowledge the panel of industry experts
who provided valuable input to the study.

               The Praxis Group™, Building B1, Room 242, 2451 Dieppe Avenue SW Calgary, AB T3E 7K1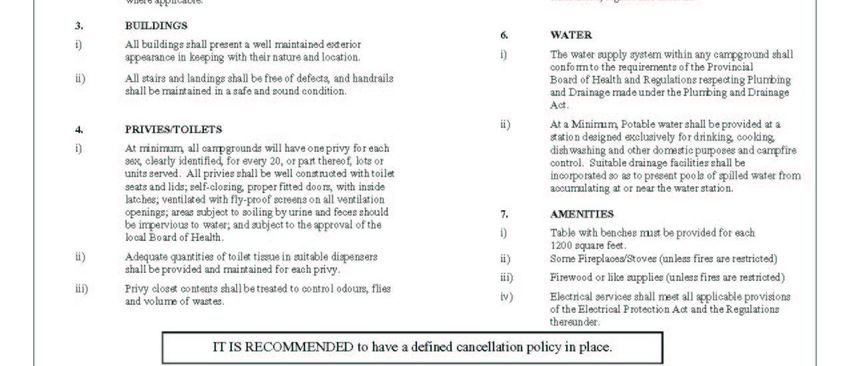
Recreational Vehicle Camping in Alberta: A Demand and Supply Side Perspective         5

Executive Summary
In order to assess if Alberta campgrounds are adequate in numbers, condition and diversity, a detailed
look at recreational vehicle (RV) campers and campgrounds was conducted by The Praxis Group™ in
February and March of 2009. The study included a review of print and web literature, expert interviews
and a public telephone survey of those who camp with RVs who reside in British Columbia, Alberta and
Saskatchewan. Using these primary and secondary sources, the study provides an assessment of the
status of the travel industry in light of the economic changes, the current campground situation in
Alberta in terms of the supply side (manufacturers and RV campground operations) and the demand
side (how Alberta rates in the eyes of its campers), highlights significant trends impacting RV
campground operation and development, and identifies best practices in campground operations.

Camping is one of the most popular leisure activities in which Albertans are involved. Over 40% of
Albertans take part in overnight camping as a leisure activity and over three quarters of camping is
done using a recreational vehicle. Alberta has one of the highest rates of RV ownership in North
America, with 18% of households owning an RV.

In 2007, more than $380 million dollars was spent in the province on camping trip expenditures alone.
Approximately $700 million dollars is spent on RV purchases in Alberta each year, representing about
one third of all RV sales in Canada. Over 20,000 new RV units are sold each year in Alberta, adding to the
more than 800,000 RV units on the road nationally. Canadian retail RV sales in 2008 grew by 11.8% and
early indications in 2009 are showing continuation of strong sales. The future for the RV camping
industry, even in the current economic downturn is one of optimism. There is also a high desire for
current RV owners to upgrade to a larger model in the future.

The trend in camping activity in Alberta since 2005 is on the rise, following a downward trend in
camping since the late 1990’s. Forecasts suggest participation in RV camping will be stronger than ever
over the coming years given the affordability of camping and the heavy existing investment in
recreational vehicle ownership.

Over 40,000 campsites throughout the province provide campers with a wide range of opportunities;
lakes and rivers for fishing, swimming and other water sports; wilderness for such activities as hiking,
backpacking, horseback riding, X-country skiing, quadding; and, the existence world class tourist
attractions.

In spite of the popularity of the activity and its importance to Albertans and the tourism industry as a
whole, the supply-side picture is less than ideal. Many of the province’s campgrounds have deteriorated
in quality through a lack of re-investment. Campsites developed several decades ago have not kept pace
with the changing needs of today’s RV campers. The perceived value for money has declined with
charges for firewood and showers along with increased camping fees with limited corresponding
investment in facility upgrades. RV campers are seeking service buildings with showers and flush toilets,
power and water hookups and sani-stations. They are also looking for well maintained campgrounds
that offer privacy and sites large enough for their RV camper.

               The Praxis Group™, Building B1, Room 242, 2451 Dieppe Avenue SW Calgary, AB T3E 7K1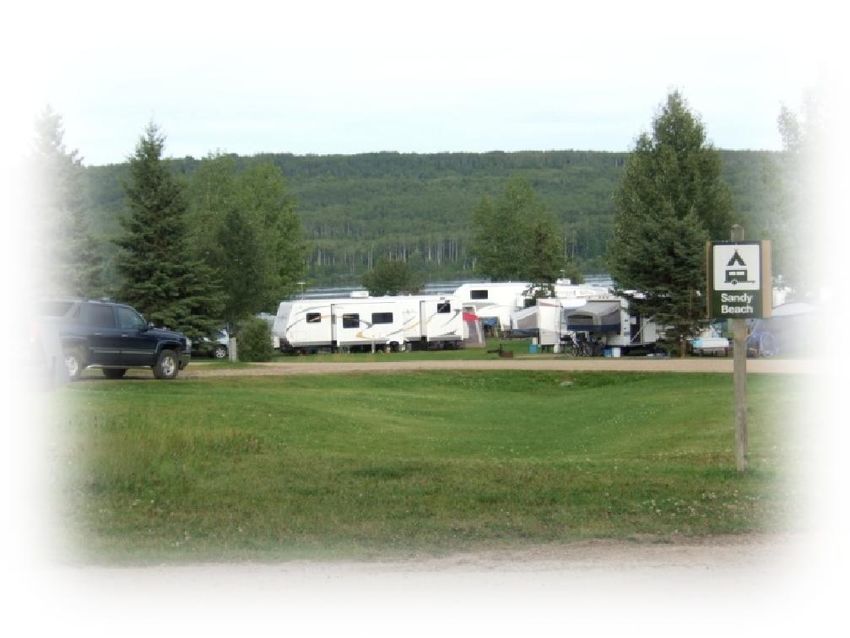
Recreational Vehicle Camping in Alberta: A Demand and Supply Side Perspective          6

On the surface there appears to be a large supply of campsites in Alberta; however, the number of sites
designed to meet current and future RV camping requirements is not sufficient.

Over half the province’s campground supply does not offer power hookups and over two-thirds do not
offer water hookups. The largest provider of serviced sites is privately owned campgrounds. Over 60% of
powered sites and 72% of sites with water hookups are provided by private owners. National parks and
provincial parks are significantly under-represented in terms of provision of serviced sites.

Just over half of the province’s campgrounds offer shower facilities, flush toilets and sani-stations. In
terms of these services, the provincial parks lag well behind federal, municipal and private parks.

The survey of industry experts indicated the lack of availability of suitable sites coupled with a less than
adequate reservation system and higher camping fees is forcing campers to leave the province, and is
not attracting campers from outside of the province to the extent that could be the case. The survey
findings show one third of Albertan’s camping nights are spent outside of Alberta, mostly in British
Columbia and Saskatchewan.

One of the benefits of investing in the upgrade of the province’s campgrounds will be to relieve some of
the pressure on the areas that currently experience demand well in excess of supply. Areas like
Kananaskis Country are perceived as ‘impossible to get into’. Many campers are frustrated with the
inability to obtain what they perceive to be the ‘prime camping sites’ as these are secured through
advanced bookings as early as March for the entire summer season. Campers thereby reach the
conclusion that the province has an inadequate supply of campsites (noted in two recent province-wide
surveys). In reality the supply of campsites is not the issue; rather it is the insufficient supply of
campsites that have the services and amenities to meet today’s camping needs. Improvements to
information and marketing will also work to relieve the current concentration of demand.

To sustain and even grow the province’s RV camping industry, investment is essential. Without
investment in the province’s campgrounds, the risk of losing campers to neighboring provinces and
states increases. British Columbia and Saskatchewan have embarked on strategies to align their
campground supply with the current types and levels of demand.

                The Praxis Group™, Building B1, Room 242, 2451 Dieppe Avenue SW Calgary, AB T3E 7K1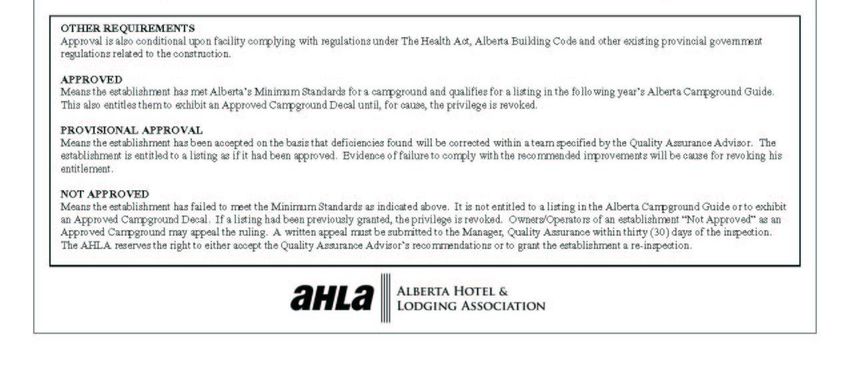
Recreational Vehicle Camping in Alberta: A Demand and Supply Side Perspective   7

1.0 Study Background and Purpose
1.1 Background
Camping is a very popular leisure activity to
Albertans; over 40% of Albertans take part in
overnight camping as a leisure activity.1 The Alberta
Recreation Survey (2005) indicated that Albertans
rated camping as their third most favorite leisure or
recreation activity, after walking and golf. 2

RV camping is by far the most popular method of
camping. Over three quarters of camping is done with
some form of RV. The recreational vehicle market
includes a wide array of products targeting nearly
every demographic group. The motorhome segment
includes Class A, Class B, and Class C motorhomes, as
well as conversion vans and busses. The travel trailer
and camper segment principally includes conventional and fifth wheel travel trailers, truck campers, and
tent trailers.

In order to assess if Alberta campgrounds are adequate in numbers, condition and diversity, a detailed
look at recreational vehicle (RV) campers and campgrounds was conducted by the Praxis Group™ in
February and March of 2009. The study included a review of print and web literature, expert interviews
and a public telephone survey of those who camp with RVs who reside in British Columbia, Alberta and
Saskatchewan. Using these primary and secondary sources, the study provides an assessment of the
status of the travel industry in light of the economic changes, the current campground situation in
Alberta in terms of the supply side (manufacturers and RV campground operations) and the demand
side (how Alberta campgrounds rate in the eyes of its campers), highlights significant trends impacting
RV campground operation and development, and identifies any best practices in campground
operations.

The goal of the review is to focus on all types of campground operations; private, municipal, provincial
and federal campgrounds and parks.

1
    (Alberta Community Development, 2005); p. 2

2
    (Alberta Community Development, 2005); p. 10

                   The Praxis Group™, Building B1, Room 242, 2451 Dieppe Avenue SW Calgary, AB T3E 7K1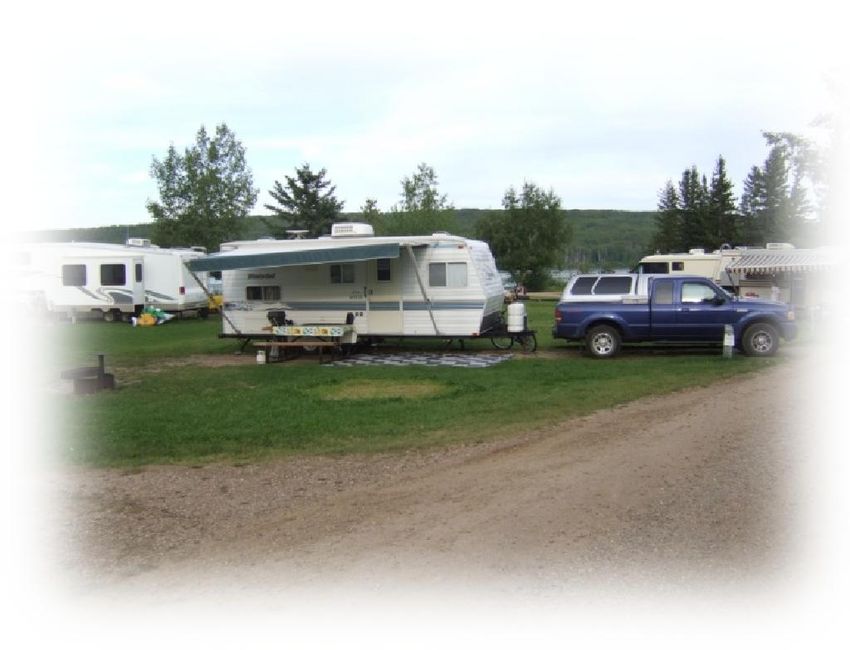
Recreational Vehicle Camping in Alberta: A Demand and Supply Side Perspective   8

1.2 Methods

1.2.1 Literature Review
As there lacks a single, consistent source of campground information in Canada, the literature review
was compiled from a variety of sources, some of which are industry-specific but from other countries.
Much of the data is taken from US sources such as Woodall’s and Trailer Life as they are the established
authorities on RV camping and campgrounds. Due to the recent economic change in the North American
markets, any literature that is older than six years was not considered. The current financial situation
has barely begun to be reflected in tourism statistics.

The first stage of the literature review began with an update of the Alberta Recreational Vehicle
Campground Study 2001 bibliography.3 Newer versions of the key reports were researched and located.
Woodalls.com, RVIA.org and GoRving.ca websites provided current 'news' announcements pertaining to
the RV industry. An extensive search of electronic databases at EbscoHost was conducted. The
databases covered were: Academic Search Elite, Canadian Reference Centre, MasterFILE Premier,
Primary Search, Regional Business News, Business Source Complete, Business Source Elite, Regional
Business News, Psychology and Behavioral Sciences Collection and SocINDEX with Full Text.

A blog, 'RV Industry News' (www.rvinews.com) was followed for the entire period of this study as well as
retrospectively. Web searches using Google were conducted throughout the entire research process to
locate any additional documents or news pieces pertaining to the RV camper and campground
industry. Statistical information was updated using CANSIM tables available through E-Stat.

1.2.2 Expert Interviews
Interviews were conducted with knowledgeable representatives from government, manufacturing,
private and public campground operations to obtain additional insight into the current and future state
of RV camping in Alberta. Open-ended questions were asked pertaining to a number of key themes;
strengths, weaknesses and opportunities in relation to the Alberta camping industry, identification of
trends in relation to equipment and consumer preferences, the impact of the current economic
conditions on the industry and potential models for success in the future. Experts were identified
through contacts within the RV Dealers Association, the Alberta Hotel and Lodging Association (AHLA),
Alberta Tourism, Parks and Recreation (ATPR) and web searches. The interviews were conducted over
the telephone by a senior consultant. Answers were recorded in an on-line form. A link to the on-line
form was then sent to the participant along with a password allowing them to review their responses to
validate the information and to add anything that may have been missed. Twenty interviews were
completed, ranging in length from twenty minutes to an hour and a half (Appendix B).

3
    (Western Management Consultants, 2001)

                   The Praxis Group™, Building B1, Room 242, 2451 Dieppe Avenue SW Calgary, AB T3E 7K1
Recreational Vehicle Camping in Alberta: A Demand and Supply Side Perspective     9

1.2.3 Public Survey of RV Campers
A random sample telephone survey was conducted in Alberta, British Columbia and Saskatchewan
between February 27th and March 13th. The survey commenced with a screener to determine if the
household owns or has rented a recreational vehicle for camping. The survey asked questions about
equipment used, best and worst features of campgrounds, the amount of camping done and where,
services and amenities sought, improvements needed to campgrounds and the impact of the current
economic conditions on future camping. The survey took an average of 17 minutes to complete. The
sample size for Alberta was 389, while British Columbia and Saskatchewan combined were 389 (evenly
split). A proportionate sample was used across the three provinces. Data were weighted to the
respective populations. A response rate of 30% was obtained among the RV camping population. Results
are reliable within +/-5%, 19 times out of 20 for the Alberta sample and BC/Saskatchewan sample. When
examining all three provinces the results are reliable within +/-3.5%, 19 times out of 20.

1.2.4 Campground Inventory
The majority of the data used to create the supply-side perspective was from the Alberta Hotel and
Lodging Association’s 2009 Alberta Campground Guide. Specific information concerning campsite
amenities (power and water) were gathered from a combination of sources including Woodall’s Canada
Campground Guide (2009 edition), Campscout.com and the ATPR campground database. For the small
number of campgrounds that did not have site-specific information on power and water an average
appropriate for that campground type was assigned.

              The Praxis Group™, Building B1, Room 242, 2451 Dieppe Avenue SW Calgary, AB T3E 7K1
Recreational Vehicle Camping in Alberta: A Demand and Supply Side Perspective 10
2.0 Alberta’s Campgrounds
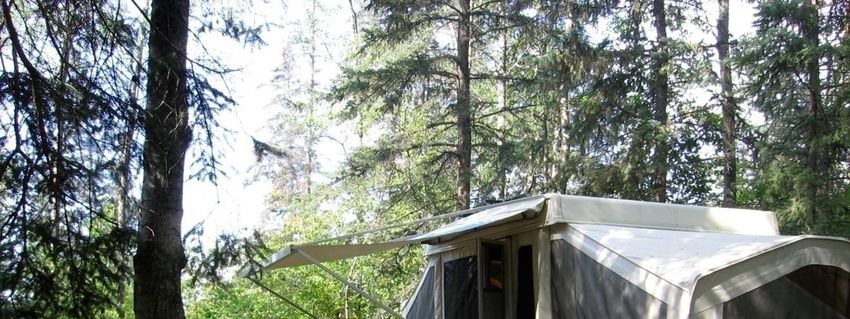
There are more than 600 campgrounds
offering more than 40,000 campsites in
Alberta.4 All campgrounds included in
the current study met the Minimum
Standard for Approved Campgrounds as
defined by the Alberta Hotel and
Lodging Association (Appendix A). As
there are many unserviced
campgrounds in Alberta used
extensively by RVs their inclusion in the
Converted bus in an unserviced site at Long Lake PP
supply analysis is essential.5
Table 1 provides the breakdown of
campgrounds and campsites according to the type of operator.
Table 1 Campgrounds and Campsites
Operating Agency # of Campgrounds # of Campsites
Local Clubs and Associations 39 2769
Municipal and County 176 6958
Parks Canada 27 4507
Privately Owned 153 12867
Provincial Parks 208 13953
Total 603 41054
A key strength of Alberta’s campgrounds is the wide range of landscapes, and scenery offered
throughout the entire province. Mountains, rivers, lakes, prairies and even badlands are available for
campers to enjoy.
4
Information was gathered from the Alberta Hotel and Lodging Association’s 2009 Alberta Campground Guide, Woodall’s
Canada Campground Guide (2009 edition), ATPR campground database and Campscout.com.
5
The 2001 Alberta Recreational Vehicle Campground Study only included serviced campgrounds (n=359), therefore direct
comparisons to the earlier report in terms of the supply analysis are not possible. Only including serviced campgrounds
underestimates supply and does not reflect how camping is carried out.
The Praxis Group™, Building B1, Room 242, 2451 Dieppe Avenue SW Calgary, AB T3E 7K1Recreational Vehicle Camping in Alberta: A Demand and Supply Side Perspective 11
Government parks (federal, provincial and municipal) administer almost two-thirds of the province’s
supply of campsites (Figure 1).
Figure 1 Campground Administration (% of campsites)
Other
7%
Municipal and
County
Provincial Parks 17%
34%
Parks Canada
11%
Privately Owned
31%
Over half the province’s campground supply does not offer power hookups at the site and over two-
thirds do not offer water at the site. The largest provider of serviced sites is privately owned
campgrounds. Over 60% of powered sites and 72% of sites with water hookups are provided by private
owners.
National parks and provincial parks in relation to the number of sites offered are significantly under-
represented in terms of provision of serviced sites (power and water).
Table 2 Campsite Amenities: Power and Water (campsites)
Local Club Municipal
Total Parks Privately
and and Provincial
Amenity Campsites with power or Canada Owned
Association County Parks
water Campsites Campsites
Campsites Campsites
Power 18,317 45%* 876 3,491 698 10,744 2,508
Water 12,939 32%* 709 2,013 321 9,620 276
*expressed as % of total campsites in Alberta
The Praxis Group™, Building B1, Room 242, 2451 Dieppe Avenue SW Calgary, AB T3E 7K1Recreational Vehicle Camping in Alberta: A Demand and Supply Side Perspective 12
Figure 2 Campsites with Power
Local Clubs and Parks Canada
Associations 2%
Provincial Parks 2%
6%
Municipal and
County
9%
No Power
Privately Owned 55%
26%
Figure 3 Campsites with Water
Local Clubs and
Parks Canada
Associations
1% Provincial Parks
2%
Municipal and 1%
County
5%
Privately Owned
23%
No Water
68%
The Praxis Group™, Building B1, Room 242, 2451 Dieppe Avenue SW Calgary, AB T3E 7K1Recreational Vehicle Camping in Alberta: A Demand and Supply Side Perspective 13
More than half of the province’s campgrounds offer sani-stations, showers, flush toilets and fire pits.
Table 3 Campground Amenities: General
# of Campgrounds % of Campgrounds
Amenity Offering Amenity Offering Amenity
Fire Pits 528 88%
Flush Toilets 340 56%
Showers 339 56%
Sani-Station 328 54%
Reservations Accepted 292 48%
Caretaker 265 44%
Pull-Thru sites available 191 32%
Gate 157 26%
Laundry 134 22%
Concession/Snack Bar 84 14%
Figure 4 provides a comparison of the percentage of campgrounds by operating entity offering the key
amenities RV campers look for. Provincial parks offer the lowest level of service in terms of flush toilets
(22%), showers (21%) and sani-stations (30%). By Contrast, the private sector offers the highest level of
amenities.
Figure 4 Amenities by Operator (campgrounds)
100% 93% 94%
90% 84%87% 86% 85%
78%
80% 70% 72%
67%67%65%
70% 63%
60%
50% 41% 43%
40% 30%31%
30% 22%21%
19%
20%
10%
0%
Parks Canada Privately Owned Provincial Parks Local Clubs, Associations,
Municipalities and
Counties
Fire Pits Flush Toilets Showers Sani-Station Reservations Accepted
The Praxis Group™, Building B1, Room 242, 2451 Dieppe Avenue SW Calgary, AB T3E 7K1Recreational Vehicle Camping in Alberta: A Demand and Supply Side Perspective 14
Table 4 Power Amperage Breakdown (campgrounds)
Power Sites # of Campgrounds % of Campgrounds
15 amp sites
available 240 40%
30 amp sites
available 266 44%
50 amp sites
available 39 7%
Table 5 Power Amperage Breakdown by Operator (campgrounds)
Local Clubs,
Total Privately Associations,
Power Sites Parks Canada Provincial Parks
Campgrounds Owned Municipalities,
and Counties
15 amp sites
240 (40%) 5 (19%) 106 (69%) 10 (5%) 119 (55%)
available
30 amp sites
266 (44%) 5 (19%) 134 (88%) 7 (3%) 120 (56%)
available
50 amp sites
39 (7%) 0 33 (22%) 0 6 (3%)
available
Note: Some campgrounds offer more than one level of amperage and are therefore double-counted
The Praxis Group™, Building B1, Room 242, 2451 Dieppe Avenue SW Calgary, AB T3E 7K1Recreational Vehicle Camping in Alberta: A Demand and Supply Side Perspective 15
The recreational vehicle camper survey undertaken as part
of this study revealed that having a campfire is an essential
part of the experience for the majority of campers (59%
indicated it is essential and 31% preferred in their choice of
campground).6
Two thirds of campgrounds in Alberta charge for firewood.
Alberta provincial parks now charge for firewood on a per
bundle basis (sold by concession or as a surcharge $6.00 to
$8.00). National parks charge for a daily fire permit
($8.80/day). Private park firewood charges vary.
Campfires are an essential or preferred requirement by
90% of RV campers in their choice of a campground
Figure 5 Firewood in Alberta’s Campgrounds*
Free Firewood
34%
Charge for
Firewood
66%
*This information is based on data from 473 (78%) of the campgrounds as the remaining campgrounds did not report this
information.
6
(The Praxis Group, March, 2009); p. 16
The Praxis Group™, Building B1, Room 242, 2451 Dieppe Avenue SW Calgary, AB T3E 7K1Recreational Vehicle Camping in Alberta: A Demand and Supply Side Perspective 16
The majority of Alberta’s campgrounds provide access to
playgrounds (60%). Access to water-based activities such
as fishing (56%), canoeing (43%), boating (30%) and
swimming (26%) is offered at many of the provinces’
campgrounds. Water access is a key decision point for
many RV campers (39% indicated it is ‘essential’ and 50%
‘preferred’ in their choice of campground).7
Crimson Lake Provincial Park
Table 6 Recreational Activities Offered
Recreational Activities # of Campgrounds % of Campgrounds
Playgrounds 364 60.4%
Fishing 336 55.7%
Day Use Area 302 50.1%
Canoeing 258 42.8%
Horseshoe Pits 228 37.8%
Boat Launch 183 30.3%
Hiking Trail 176 29.2%
Swim Area 156 25.9%
Beach 132 21.9%
Fish Stand 119 19.7%
Pier 99 16.4%
Baseball Diamond 80 13.3%
Bike Trails 69 11.4%
Cross-country Skiing 68 11.3%
Interpretive Trails 49 8.1%
Golf Course 42 7.0%
Motor Boats 37 6.1%
Mini-golf 28 4.6%
Boat Rental 27 4.5%
Equestrian Trails 25 4.1%
Indoor Area 21 3.5%
Outdoor Pool 12 2.0%
Tennis 7 1.2%
Indoor Pool 4 0.7%
Hot Tub 2 0.3%
7
(The Praxis Group, 2008); p. 16
The Praxis Group™, Building B1, Room 242, 2451 Dieppe Avenue SW Calgary, AB T3E 7K1Recreational Vehicle Camping in Alberta: A Demand and Supply Side Perspective 17
Table 7 Campground Fees
Local Clubs Municipal
Total and and Parks Privately Provincial
Site Type N* Alberta N Associations N County N Canada N Owned N Parks
No services 460 $17.40 28 $16.11 131 $14.82 20 $22.20 79 $20.95 202 $17.40
Power 198 $22.62 20 $21.20 76 $19.49 4 $33.00 48 $25.25 50 $24.60
Power/Water 142 $25.95 14 $21.93 41 $21.12 0 - 76 $28.80 11 $29.36
Power/Water/Sewer 179 $29.62 20 $28.40 49 $24.18 3 $39.00 105 $32.14 2 $28.50
Tenting 135 $17.07 16 $14.62 43 $12.70 5 $19.80 58 $20.60 13 $17.69
*N=number of campgrounds
National park camping fees do not include the park entry fee. National park entry fees range from
$4.90/day for youth, $9.60/day for an adult to $19.60/day for a family (discounts apply to annual
permits). This makes national parks the most expensive place to camp in Alberta.
RV campers surveyed in 2009 noted that value for money is declining in Alberta’s campgrounds with
increased fees, charging for firewood and showers with no commensurate increase in the quality and
provision of services and facilities.8 Similar results were obtained in ATPR’s campground satisfaction
surveys. The most recent report (2008) showed value for camping fee, cleanliness of washrooms,
condition of facilities and availability of firewood as the lowest ranked of all attributes measured, with
value for money lowest overall. Issues with the reservation system, firewood and condition of facilities
generated the greatest number of negative comments (32.7% of all comments).9
8
(The Praxis Group, March, 2009); p. 10
9
(Alberta Tourism, Parks and Recreation, 2008); p. 3
The Praxis Group™, Building B1, Room 242, 2451 Dieppe Avenue SW Calgary, AB T3E 7K1Recreational Vehicle Camping in Alberta: A Demand and Supply Side Perspective 18
2.1 Campground Characteristics by Tourist Destination Region
Figure 6 demonstrates the extent to which campsites are distributed in all regions of the province. The
characteristics of each tourism destination region are vastly different.
Figure 6 Campsites by Tourist Destination Region
Calgary and
Edmonton and Area
Area 6%
10%
Northern Central Alberta
Alberta 32%
13%
Southern
Alberta Alberta Rockies
17% 22%
Figure 7 Tourist Destination Regions
The Central Region has the greatest number of
campgrounds (220) and campsites (13,275).
Campgrounds in the Central and Northern Regions
provide the greatest number of water-based
opportunities in the province. The Canadian
Rockies region has 93 campgrounds offering 8,888
sites. See Table 8.
The Praxis Group™, Building B1, Room 242, 2451 Dieppe Avenue SW Calgary, AB T3E 7K1Recreational Vehicle Camping in Alberta: A Demand and Supply Side Perspective 19
Table 8 Campgrounds and Campsites by Tourism Region
Tourist Destination Region # of Campgrounds # of Campsites
Northern Alberta 90 5,389
Central Alberta 220 13,275
Edmonton and Area 31 3,834
Alberta Rockies 93 8,888
Calgary and Area 32 2,595
Southern Alberta 137 7,073
The mountain parks provide the lowest levels of power and water services to their campsites.
Figure 8 Campsites with Power and Water Hookups by Tourism Destination Region
70%
64%
60%
51% 50% 50% 51%
48%
% of campsites in region
50%
43%
40% 35%
34% 33%
30%
19%
20%
11%
10%
0%
Northern Central Edmonton Rockies Calgary Southern
Power Sites Water Sites
The Praxis Group™, Building B1, Room 242, 2451 Dieppe Avenue SW Calgary, AB T3E 7K1Recreational Vehicle Camping in Alberta: A Demand and Supply Side Perspective 20
2.2 Assessment of Camping Supply
Interviews conducted with operators, dealers, manufacturers, government officials and other industry
experts support the quantitative findings. The key strengths identified are the proximity to a wide
variety of camping opportunities, a safe environment for camping, and relax or recreate in some of the
most spectacular outdoor areas in North America.10
There was consensus among those surveyed that the current supply of campgrounds lacks quality (sites
are run down – especially in provincial parks) and there is a serious shortage of campsites that cater to
the current and future needs of the recreational vehicle camping market. Sites are too small for today’s
camping units and they do not offer the services needed.11
It is believed that the lack of availability of suitable sites coupled with a less than adequate reservation
system and higher camping fees is forcing campers to leave the province, and is not attracting campers
from outside of the province. It should be noted that ATPR is developing a new centralized campground
reservation system in for provincial parks commencing in 2009.
10
(The Praxis Group, February, 2009)
11
(The Praxis Group, February, 2009)
The Praxis Group™, Building B1, Room 242, 2451 Dieppe Avenue SW Calgary, AB T3E 7K1Recreational Vehicle Camping in Alberta: A Demand and Supply Side Perspective 21
3.0 Profile of Alberta RV Campers
3.1 Camping Equipment Used
More than 70% of camping in the province’s government parks is done in recreational vehicles.
Provincial parks report slightly higher levels of RV use (76%)12 compared with Banff and Jasper National
Parks (69%).13 14 The percentage of RV use in private and other parks is not reported in any published
sources, however it is presumed to be higher than provincial and national parks as there is a much
higher percentage of serviced sites offered.
Figure 9 Camping Equipment used in Provincial and National Parks
50% 46%
45%
40%
Percent of All Campers
35% 31%
30% 28%
24% 23%
25%
20%
15% 12% 11%
9%
10% 7%
5%
5%
0%
Tent 5th Wheel/Trailers Motorhome Tent Trailer Truck/Van Camper
AB Provincial Parks Mountain National Parks
The higher percentage of motorhome use in national parks can be attributed to the considerable fly-
drive camping market in the mountain parks renting motorhomes. Over 30% of campers in Banff and
Jasper are from overseas (32% Banff and 31% Jasper). This compares with less than 2% for Alberta’s
provincial parks. Over 90% of Alberta provincial park campers are from in-province.
12
(Alberta Tourism, Parks and Recreation., 2005); p. 17
13
(Banff National Park, December, 2008); p. 11
14
(Jasper National Park, December, 2008); p. 11
The Praxis Group™, Building B1, Room 242, 2451 Dieppe Avenue SW Calgary, AB T3E 7K1Recreational Vehicle Camping in Alberta: A Demand and Supply Side Perspective 22
RV ownership is more common in western Canada (19%) than eastern Canada (11%). Figure 10
illustrates that 18% of Alberta households own an RV. 15
Figure 10 Recreational Vehicle Ownership in Canada
Bristish Columbia 17%
Alberta 18%
Man./Sask. 23%
Ontario 12%
Quebec 11%
Atlantic 11%
Total Canada 14%
0% 5% 10% 15% 20% 25%
RV Ownership (2006)
The recreational vehicle camper survey undertaken as part of this study showed that in the three
provinces surveyed, travel trailers are the most popular form of recreational vehicle, followed by fifth
wheels. This is consistent with the type of equipment used in Alberta’s provincial parks (Figure 9).
In Alberta tent trailers are the third most popular form of RV in use. Individuals camping in tent trailers
are more likely to travel outside of the province in comparison to those camping in trailers and fifth
wheels.16
15
(MRP Market Research Professionals, 2006); p.11
16
(The Praxis Group, March, 2009); p. 5
The Praxis Group™, Building B1, Room 242, 2451 Dieppe Avenue SW Calgary, AB T3E 7K1Recreational Vehicle Camping in Alberta: A Demand and Supply Side Perspective 23
Figure 11 Recreational Vehicle Type by Province
45%
39%
40%
35% 34% 35%
30%
27%
25% 22% AB
20%
20% 18% BC
17%
15% 16% SK
15% 13%
11%
9%
10% 7%
6%
4% 5%
5%
2%
0%
tent trailer truck camper fifth wheel travel trailer camper van motor home
3.2 Camping Destinations
In 2008, half of Alberta RV owners did all of their camping in Alberta. Nine percent of Alberta RV owners
camped entirely outside of Alberta in 2008. One quarter of British Columbia RV owners and 18% of
Saskatchewan RV owners did at least some of their camping in Alberta in 2008. 17 Given the substantial
ownership of RV’s in the two provinces immediately adjacent to Alberta, a large potential market exists
that is largely untapped.
The majority of Alberta residents who own tent trailers (60%) and motorhomes (66%) did at least some
of their camping outside of Alberta. The majority of travel trailer (56%) and fifth wheel (60%) owners did
all of their camping in Alberta.18
17
(The Praxis Group, March, 2009); p. 5
18
Ibid, p. 9
The Praxis Group™, Building B1, Room 242, 2451 Dieppe Avenue SW Calgary, AB T3E 7K1Recreational Vehicle Camping in Alberta: A Demand and Supply Side Perspective 24
Figure 12 Percent of RV Camping in Alberta by Province
90% 82%
80% 75%
70%
60%
50%
50%
AB
40%
BC
30% 24%
SK
20% 17% 15%
9% 9%
10% 4% 2% 5% 7%
0%
100% 50% to 99% 1% to 49% Do not camp in
Alberta
3.3 Demographic Profiles of Recreational Vehicle Campers
Demographic profiles for users of the various RV types indicate that travel trailer and tent trailer
campers are younger families, while fifth wheel and motorhome campers are older with smaller
families19.
Figure 13 Average Age of RV Owners (BC, AB, SK)
70.0
59.9
60.0 57.7
53.9 54.6
Average Age of RV Owner
48.3
50.0
41.9
40.0
30.0
20.0
10.0
0.0
tent trailer travel trailer truck camper fifth wheel camper van motor home
19
(The Praxis Group, March, 2009); p. 7
The Praxis Group™, Building B1, Room 242, 2451 Dieppe Avenue SW Calgary, AB T3E 7K1Recreational Vehicle Camping in Alberta: A Demand and Supply Side Perspective 25
Figure 14 Average Household Size of Recreational Vehicle Owners (AB, BC, SK)
4 3.73
3.5 3.22
Number of People in Household
3 2.81
2.62 2.57 2.51
2.5
2
1.5
1
0.5
0
tent trailer travel trailer fifth wheel camper van truck camper motor home
3.4 Camping Patterns
Figure 15 shows the average number of nights spent camping in 2008 by owners of each type of
recreational vehicle. Fifth wheel and motorhome owners spend considerably more time camping than
all other RV types, especially among British Columbia owners. This may be related to the average age of
RV owners in British Columbia being higher than the other two provinces and more time available
associated with retirement (BC mean age = 54, AB mean age = 49, SK mean age = 50) 20.
Figure 15 Average Camping Nights in 2008 by RV Type and Province
50.0 45.6
Avg. Number of Nights Camping 2008
45.0 42.7
40.0
33.9
35.0
30.0 26.1 26.9
23.422.423.7
25.0 20.6 21.4
20.0 17.9 16.9 15.1
13.414.9
15.0 11.0 9.6
10.0 7.5
5.0
0.0
tent trailer truck camper fifth wheel travel trailer camper van motor home
Alberta British Columbia Saskatchewan
20
(The Praxis Group, March, 2009); p. 7
The Praxis Group™, Building B1, Room 242, 2451 Dieppe Avenue SW Calgary, AB T3E 7K1Recreational Vehicle Camping in Alberta: A Demand and Supply Side Perspective 26
3.5 Services and Amenities Sought by RV Campers
Figure 16 shows the priorities for services and amenities among RV campers in Alberta. Respondents
were asked to rate each item as ‘not required’, ‘preferred’ or ‘essential’ in selecting a place to camp. The
figure shows only the ‘preferred’ and ‘essential’ attributes ranked in order of most essential to least
essential. Four items were rated as preferred or essential by more
than 80% of Alberta RV campers; fire pits, private well treed
sites, being near a lake or river and ability to reserve in advance.
The top five items were the same for British Columbia and
Saskatchewan RV campers, although the order changed slightly in
both cases.21
Figure 16 Priorities among Alberta Recreational Vehicle Campers
fire pits
private site, well treed
dumping station available
ability to reserve in advance
near lake or river
cost of site
nearby hiking/walking trails
shower facilities
flush toilets
water to your site
30 amp electrical hookup
sewer hookup at your site
Essential
pull through site
tourism attractions in area Preferred
laundry facilities
50 amp electrical hookup
nearby golf course
seasonal RV site rental
swimming pool
concession
interpretive programs
owning my RV campsite
0 20 40 60 80 100
Percent
21
(The Praxis Group, March, 2009); p. 14
The Praxis Group™, Building B1, Room 242, 2451 Dieppe Avenue SW Calgary, AB T3E 7K1Recreational Vehicle Camping in Alberta: A Demand and Supply Side Perspective 27
Table 9 illustrates the attributes considered essential by each RV camper type. Items shaded in green
represent 50% or more respondents considering the item essential. Items shaded in red represent 25%
to 49% of RV campers in the respective category.22
The opportunity to have a fire is the top requirement for the majority of RV campers. The majority of
tent trailer campers also consider being near a lake and having shower facilities essential features of a
campground. While 30 amp electrical hookups are an essential requirement for 40% of fifth wheel
campers, it is less critical to other RV types. Sewer hookups and 50 amp electrical hookups are also
considered less essential than other features.
Table 9 Essential Attributes in Choosing a Campground by Equipment Type
fifth travel motor tent truck camper
Essential wheel trailer home trailer camper van
fire pits 55% 64% 40% 72% 67% 45%
private site, well treed 36% 49% 27% 50% 40% 29%
sani-station available 48% 46% 41% 23% 16% 24%
near lake or river 40% 44% 23% 51% 39% 18%
ability to reserve in advance 34% 39% 27% 47% 19% 19%
cost of site 30% 34% 31% 25% 29% 36%
water to your site 32% 33% 22% 26% 23% 7%
shower facilities 29% 31% 26% 53% 12% 36%
nearby hiking/walking trails 15% 27% 19% 47% 29% 40%
flush toilets 21% 25% 22% 44% 4% 26%
30 amp electrical hookup 40% 25% 21% 18% 9% 4%
sewer hookup at your site 23% 21% 18% 13% 11% 6%
pull through site 20% 18% 21% 18% 6% 9%
tourism attractions in area 11% 11% 10% 22% 19% 20%
laundry facilities 8% 9% 10% 15% 4% 8%
seasonal RV site rental 16% 9% 2% 7% 3% 5%
50 amp electrical hookup 16% 6% 12% 6% 3% 6%
concession 4% 6% 6% 7% 2% 6%
nearby golf course 6% 5% 11% 7% 1% 3%
interpretive programs 1% 5% 6% 15% 4% 10%
swimming pool 8% 5% 2% 11% 2%
owning my RV campsite 10% 5% 3% 2% 5% 10%
22
(The Praxis Group, March, 2009); p. 15
The Praxis Group™, Building B1, Room 242, 2451 Dieppe Avenue SW Calgary, AB T3E 7K1Recreational Vehicle Camping in Alberta: A Demand and Supply Side Perspective 28
Table 10 shows which attributes are considered preferred
or essential (categories combined) by RV campers.23
Lower priority was consistently given across all RV types
for having 50 amp electrical hookups, seasonal RV site
rental, a nearby golf course, a swimming pool, a
concession and owning an RV campsite.
Being near a lake or river is sought
by 89% of campers
Table 10 Essential or Preferred Attributes in Choosing a Campground by Equipment Type
fifth travel motor tent truck camper
Preferred or Essential wheel trailer home trailer camper van
fire pits 90% 91% 81% 93% 91% 84%
private site, well treed 86% 92% 81% 92% 85% 100%
near lake or river 85% 90% 84% 94% 92% 100%
cost of site 82% 81% 85% 80% 71% 91%
sani-station available 81% 82% 86% 42% 55% 49%
water to your site 76% 75% 76% 61% 54% 67%
ability to reserve in advance 74% 80% 78% 85% 52% 85%
nearby hiking/walking trails 71% 76% 81% 92% 76% 86%
shower facilities 71% 76% 73% 94% 62% 90%
30 amp electrical hookup 69% 66% 66% 51% 48% 58%
sewer hookup at your site 66% 60% 68% 33% 36% 32%
flush toilets 64% 66% 59% 86% 55% 90%
tourism attractions in area 62% 69% 67% 73% 47% 69%
pull through site 56% 57% 57% 56% 26% 23%
interpretive programs 39% 41% 49% 62% 20% 79%
laundry facilities 43% 39% 46% 41% 24% 36%
50 amp electrical hookup 40% 33% 40% 28% 12% 34%
seasonal RV site rental 36% 34% 34% 36% 12% 23%
nearby golf course 36% 21% 38% 27% 13% 17%
swimming pool 33% 38% 26% 44% 18% 26%
concession 30% 30% 35% 43% 12% 14%
owning my RV campsite 25% 20% 21% 21% 8% 10%
23
(The Praxis Group, March, 2009); p. 16
The Praxis Group™, Building B1, Room 242, 2451 Dieppe Avenue SW Calgary, AB T3E 7K1Recreational Vehicle Camping in Alberta: A Demand and Supply Side Perspective 29
Table 11 shows the mean scores for the importance of 16 attributes related to the camping experience.
The high mean scores for the top three items suggest RV campers are looking for an opportunity for
relaxation in a safe, secure and uncrowded setting. Being together with friends and family is an
important feature of camping for travel trailer campers and tent trailer campers. This is consistent with
earlier results presented in relation to the demographic profile of these RV campers (having a higher
percentage of families with children). Being in a wilderness setting is very important to those camping
with tent trailers, truck campers and camper vans.
Camping close to home, learning new skills and attending fairs/exhibitions and special events are the
least important features. It should be noted being close to home was not described in absolute terms in
this question.24
Table 11 Experience Sought by RV Campers (AB, BC, SK)
Mean Scores - Scale from 1 (not
at all important to 5 very fifth travel motor tent truck camper
important) wheel trailer home trailer camper van overall
A safe, secure setting 4.44 4.55 4.39 4.51 3.82 4.41 4.42
Relaxation 4.22 4.33 4.21 4.40 4.29 4.15 4.28
Uncrowded 4.05 4.05 4.08 4.12 4.25 4.40 4.10
To be together with family/friends 3.92 4.16 3.99 4.52 3.62 3.29 4.03
Wilderness/natural setting 3.80 3.94 3.80 4.24 4.44 4.37 4.00
Solitude and quiet 3.77 3.96 3.98 3.92 4.18 4.36 3.96
Opportunity to explore nature 3.80 3.98 3.79 4.19 3.98 4.19 3.95
Opportunities for outdoor
recreation 3.80 3.99 3.63 4.10 3.87 3.98 3.90
Adventure 3.20 3.35 3.06 3.74 3.17 3.70 3.33
Exercise 3.01 3.28 3.10 3.37 3.07 3.44 3.20
Learning about nature 3.05 3.10 3.11 3.52 2.98 3.27 3.15
To be with and meet other people 3.19 3.21 3.31 3.04 2.79 2.63 3.12
Exploring cultural and historical
attractions 3.11 3.12 2.99 3.21 3.06 2.96 3.10
Close to home 2.71 2.85 2.76 2.70 2.55 2.27 2.72
Learning new skills 2.64 2.64 2.44 3.05 2.57 2.29 2.64
Attending fairs/exhibitions and
special events 2.32 2.35 2.44 2.29 2.03 2.16 2.31
24
(The Praxis Group, March, 2009); p. 17
The Praxis Group™, Building B1, Room 242, 2451 Dieppe Avenue SW Calgary, AB T3E 7K1Recreational Vehicle Camping in Alberta: A Demand and Supply Side Perspective 30
3.6 Best and Worst Features of Campgrounds
RV campers were asked to describe the features of
the best RV parks they had been to recently. The
responses were recorded verbatim and then
categorized for analysis purposes. Two features
emerged above all others that separated the best
parks from others; well treed, private sites and
being near a lake for swimming and/or fishing.
Clean and well maintained buildings were also
identified as features that differentiated the top Beach at Lesser Slave Lake PP
campgrounds from the rest (for 9% of RV campers). 25
Figure 17 What make some campgrounds better than others?
Well treed/private 21.2
Near a lake/swimming/fishing 20.6
Clean buildings and well maintained 9
Scenery/wildlife/wilderness 5.3
Large sites 4.7
Power and water hook ups 4.1
Quiet, noise is managed 3.2
Activities for children 3
Close to home 2.7
Hiking nearby 2.6
Showers and flush toilets 2.3
Good firewood 2.2
Lots to do 2
Pull through sites 1.2
Had all the possible amenities 1.1
Near golf course 0.6
0 5 10 15 20 25
Percent
25
(The Praxis Group, March, 2009); p. 18
The Praxis Group™, Building B1, Room 242, 2451 Dieppe Avenue SW Calgary, AB T3E 7K1Recreational Vehicle Camping in Alberta: A Demand and Supply Side Perspective 31
The opposite perspective was also gathered from RV
campers who were asked to describe the characteristics
of the worst campgrounds they have been to recently.
Perhaps not surprisingly the features that created the
best campgrounds when done well, also resulted in the
worst campgrounds when not done well. Sites being
crowded, poor privacy and being too close together
were major reasons for campers disliking certain
campgrounds. Poor cleanliness and maintenance and
excessive amounts of noise and partying were also
reasons that campers cited as significant detractors from
a positive camping experience.26 Open sites with little or no privacy
are not ideal for most RV campers
Figure 18 What makes some campgrounds worse than others?
Too crowded/sites too close 21.4
Sites too open/no privacy/no trees 17.7
Poor cleanliness/maintenance 16.1
Noise, excessive partying 10.7
No power/water 4.3
Poor site/ not level/ bad drainage 4.2
Poor/no firewood/no fires 3.7
Difficult to get a site 2.8
No showers/flush toilets 2.5
Poor swimming/water quality 2.3
Unfriendly or unhelpful staff 2.2
Poor value for money 1.7
Too many rules/restrictions 0.9
0 5 10 15 20 25
Percent
26
(The Praxis Group, March, 2009); p.19
The Praxis Group™, Building B1, Room 242, 2451 Dieppe Avenue SW Calgary, AB T3E 7K1Recreational Vehicle Camping in Alberta: A Demand and Supply Side Perspective 32
3.7 Preference for Campground by Operator Type
Most RV campers do not have a preference for private, public or not for profit and municipal
campgrounds. For many RV campers their choice of campground depends on the services offered, not
the organization in charge of operation. British Columbia RV campers had a slightly higher preference for
provincial park campgrounds than Alberta or Saskatchewan campers.27
Figure 19 Preference for Operator by Province
70%
63%
60% 55%
48%
50%
40%
30%
30% 25%
22%
20%
9% 8%
10% 7% 6% 6%
4% 3% 3% 3%
0%
within provincial private campground national park non profit or no pref depends on
park or rec area municipal services offered
Alberta British Columbia Saskatchewan
There was no significant difference by length of recreational vehicle which suggests the issues of
campsite size are applicable to all operators
27
(The Praxis Group, March, 2009); p.20
The Praxis Group™, Building B1, Room 242, 2451 Dieppe Avenue SW Calgary, AB T3E 7K1Recreational Vehicle Camping in Alberta: A Demand and Supply Side Perspective 33
Provincial park campgrounds appeal to a slightly higher percentage of tent trailers and truck campers
than other RV types. Fifth wheel owners had the highest proportion of use of private campgrounds. As
with the breakdown by province, the most prevalent response was that the choice of operator was not
an issue, rather it was dependent on the services offered.
Figure 20 Preference for Operator by RV Type
60% 57%57%
49%50% 49%
50%
40% 35%34%
30% 27%
22% 23%
20%
14%
10% 8%
10% 8% 8% 7% 6%
4% 3% 4% 4%
1% 0% 2% 2%
0%
within provincial private campground national park non profit or no pref depends on
park or rec area municiple services offered
tent trailer truck camper fifth wheel travel trailer motor home
3.8 Campground Occupancy
Information on the number of campsites and campgrounds in Alberta is available from published
sources, such as Woodall’s, the Alberta Campground Guide and the Alberta Hotel and Lodging
Association database. However, current occupancy data are only available for national parks.
The most recent published occupancy data for provincial parks is from 1990, and there are no published
sources for private parks.
Banff National Park’s campgrounds show a wide range of occupancy throughout the season.
Campgrounds such as Lake Louise Trailer Court, Tunnel Mountain Trailer Court and Two Jack Lakeside
show peak season occupancy levels in excess of 90%. Overall seasonal occupancy levels range from a
low of 21.8% at Two Jack Lake, to 84.9% at Two Jack Lakeside. Occupancy statistics were not available
for other national parks in Alberta.
The Praxis Group™, Building B1, Room 242, 2451 Dieppe Avenue SW Calgary, AB T3E 7K1Recreational Vehicle Camping in Alberta: A Demand and Supply Side Perspective 34
Table 12 Banff National Park Campground Occupancy (2007)
Tunnel
Lake Mountain Tunnel Tunnel
Occupancy Louise Trailer Two Jack Two Jack Mountain Mountain Johnston Castle
Rate Trailer Court Lake Lakeside Village I Village II Canyon Mountain
May 22.1% 25.5% 6.2% 51.4% 13.7% 23.9% N/A 18.6%
June 78.5% 58.6% 14.6% 77.9% 24.8% 44.4% 33.6% 32.3%
July 96.5% 91.3% 30.6% 99.0% 63.1% 82.3% 76.5% 62.5%
August 96.3% 83.5% 26.7% 97.2% 56.2% 72.7% 73.4% 49.9%
September 77.5% 45.8% 24.8% 77.0% 15.8% 46.2% 31.7% 45.0%
October 58.0% N/A N/A N/A N/A N/A N/A N/A
Total 62.9% 61.8% 21.8% 84.9% 35.3% 54.0% 56.8% 44.5%
A gross estimate of occupancy for provincial parks can be determined by dividing the overall number of
occupied sites by the number of sites available. Based on the most recent campground attendance data
available (2004), the overall provincial park campground occupancy rate for July was 41% and August
32%. However, the limitation of an aggregate occupancy calculation is that it does not display the high
weekend loading on facilities and is based on ‘design’ capacity, not actual campsites open (site closures
occur throughout the season for various management reasons).28
The most recent data on peak season occupancy is from 1990 which showed weekend campsite
occupancy in the peak season was double that of weekday use. There is no reason to believe this ratio
has changed. Also, most of the camping in provincial parks is done in the summer months (2004 data).
Although occupancy data are not available for parks within Kananaskis Country, survey respondents and
experts interviewed reported the main campgrounds in this region to be at capacity the entire summer
season. Mount Kidd at the time of preparing this report (March, 2009) was already 98% booked for the
summer.29 Thirty percent of Alberta’s campers stay in Kananaskis Country. In 2004, this represented
418,402 site nights of occupancy.30
Figure 21 illustrates that two-thirds of camping occurs in July and August in provincial park campgrounds
and 83% of camping occurs in June, July and August.
28
(Alberta Community Development, 2005); p. 7
29
(The Praxis Group, February, 2009)
30
(Alberta Tourism, Parks and Recreation, 2005)
The Praxis Group™, Building B1, Room 242, 2451 Dieppe Avenue SW Calgary, AB T3E 7K1You can also read