Group Identity and Agency Frictions: Evidence using Big Data - American Economic ...
←
→
Page content transcription
If your browser does not render page correctly, please read the page content below
Group Identity and Agency Frictions:
              Evidence using Big Data∗
                                                                   †
                                        Jitendra Aswani

                                     This Version : December 2020
                                    The latest version available here

                                             Abstract
       This paper examines whether similarity in social identities between a manager and
       the board affects executive compensation, firm value, and agency frictions. By using
       a novel dataset on surnames with multiple identities (native language, native place,
       and caste), developed by merging micro census data of 474 million Indians with data
       from Linguistic Survey of India (LSI), I provide evidence that the firms with a shared
       group identity between a manager and the board do well compare to other firms and
       due to in-group favoritism, managers of such firms earn higher compensation. These
       results are stronger for group identity based on native language and native place. I
       also find that the firm benefits from taking on the cost of in-group favoritism as it
       reduces the agency frictions and increases firm value in the long run. These results
       are robust to the endogeneity test, managerial influence on firm, college ties, ties from
       past employment, and various other checks.

       Keywords: Group Identity, In-group Favoritism, Managerial Compensation, Firm
       Value

       JEL Codes: C92, M12, D21, D22

   ∗
     I am deeply grateful to Nadya Malenko for the discussions and detailed feedback. I also thank Mahazarin
Banaji (Harvard Behavioral Lab), Mahesh Srinivasan (UC Berkeley Behavioral Lab), and Jay Van Bavel
(NYU Behavioral Lab) for providing the guidance on social psychology and social neuroscience literature. I
also appreciate comments from Hersh Shefrin, Alex Butler, Ross Levin, Ganet Gao, Gaurav Sood, Tristan
Fitzgerald, Yeejin Jang, Svenja Dube, Elizabeth Blankespoor, Darya Yuferova, Sris Chatterjee, Iftekhar
Hasan, N.K. Chidambaran, Hongyu Shen, and seminar participates at Ph.D. Colloquium of Financial Man-
agement Association (FMA, 2020) and Australasian Finance & Banking Conference (2020) at UNSW. The
author acknowledges the help from Fordham University for cloud computing.
   †
     Author is a Ph.D. student at Gabelli School of Business, Fordham University and can be contacted at
jaswani@fordham.edu .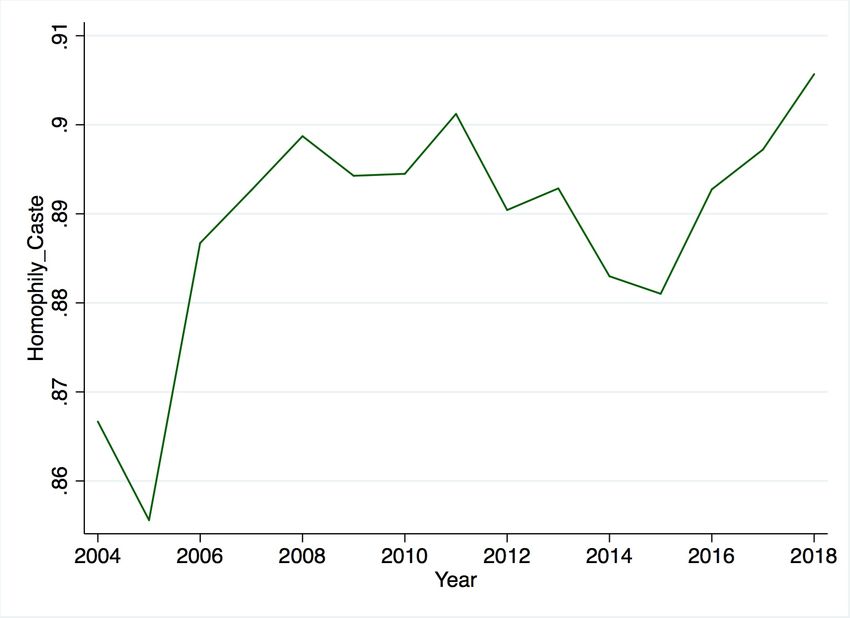
1     Introduction

Standard neo-classical models in finance posit that corporate decisions are made virtually
in a vacuum and independently of the social identities of agents. But since the seminal
work of Akerlof and Kranton (2000), there has been increased interest in social identity
research in economics and finance, yielding new insights into phenomena in which standard
economic analyses of individual-level incentives proves unable to explain. Social identity
models have been applied to the analyses of gender discrimination (Kranton and Hall, 2001),
the economics of poverty and social exclusion, the household division of labor (Akerlof and
Kranton, 2000; Bertrand and Mullainathan, 2004), contract theory (Akerlof and Kranton,
2005), economic development (Basu, 2006), public goods provision (Croson, Marks, and
Snyder, 2008; Eckel and Grossman, 2005), banking (Fisman, Paravisini, and Vig, 2017), and
investment decisions (Morse and Shive, 2011; Grinblatt and Kelohraju, 2001). But there
is not much literature on how similarity of social identity (or group identity) plays role in
corporate decisions which are endogenous, interlinked, and complex. This work attempts
to fill that gap by providing theoretical perspective and empirical analyses that how group
identity can affect the managerial compensation, firm value, and agency frictions between a
manager and the board. Current study is inspired by huge literature on identity economics,
social psychology, social neuroscience, and their applications in finance.
    The paper begins by providing an intuition on how similarity of social identities be-
tween a manager and the board members can change the endogenous decisions of executive
compensation and firm value. Using Akerlof and Kranton (2005) suggested agent’s utility
function in the Holmstrom (1979) model, equilibrium outcomes show that the manager gets
higher compensation due to the in-group bias and that firm value increases as the manager
exerts extra effort for his group members due to the same reason.
    As theoretical predictions can differ from empirical findings, it is important to verify

                                              1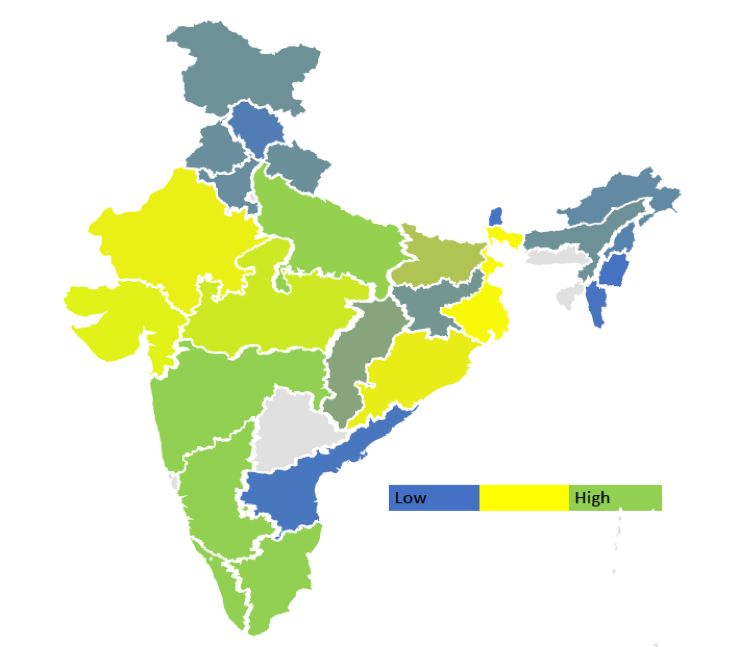
whether predictions sustain empirical analyses. Social psychology and neuroscience studies
have shown that favoritism or discrimination based on natural identities exists and is strong
than induced identities1 and this is detected by frequency magnetic resonance images (fMRIs)
and through implicit association tests (IATs).2 But most of these findings are based on lab
experiments and therefore, hard to scale for cross-industry analysis. To work around this
shortcoming, I followed Freshtman and Gneezy’s (2001) empirical design and choose a setting
where stereotypes related to identities are well established and the identities can be easily
discerned. In India, a surname (i.e., a family name or last name) can provide information
such as family lineage, native language, place of origin, and caste 3 , about a person. As a
result, surnames are likely an important basis of social ties and is a source of favoritism or
discrimination. The details for using surnames as a source of social identities is discussed in
section 3.1, but the main reason is that people belong to a particular surname lives in tight
kinship and effective cooperation is believed to take place within the group members, while
people outside the group are distrusted (Alesina and Giuliano 2013; Moscona, Nunn, and
Robinson 2017).
    To check how group identity based on social traits can affect executive compensation,
    1
      According to Huettel and Kranton (2012), identities in humans can be categorized into natural and
induced. The identities such as gender, race, caste, place of birth, native language, religion, and similar
others are considered as natural identities and the identities such as college alumni, club membership,
experience-based and others are categorized as induced identities.
    2
      The IAT relies on test-takers’ speed of response to represent the strength of their unconscious mental
associations.IATs are used to measure a wide range of implicit attitudes about social groups, products, or
self identity (Greenwald et al. 1998).
    3
      According to ancient literature, the caste is mainly divided into four - the Brahmins (priestly people),
the Kshatriyas (also called Rajanyas, who were rulers, administrators, and warriors), the Vaishyas (artisans,
merchants, tradesmen, and farmers), and Shudras (laboring classes). People who do not come in any of
these castes are called ‘Harijans’ (untouchables). Brahmins, Kshatriyas, and Vaishyas are collectively called
as upper caste and, Shudras and Harijans are called lower caste. After the establishment of the Indian
constitution in 1950, caste is redefined based on reservation provided to the under-privileged in government
jobs, education, and other services. As per this new categorization, Brahmins, Kshatriyas, and Vaishyas are
called ‘other’ caste, Shudras as ‘scheduled tribes’ (ST), and Harijans as ‘scheduled caste’ (SC). The caste
in Socio-Economic Caste Census (SECC) data is according to new categorization. I also include caste as
an identity because, in India, caste remains an enduring predictor of economic status. It is correlated with
occupation and employment (Prakash, 2015; Ito, 2009; Thorat and Attewell, 2007), income and expenditure
(Deshpande, 2000), and capital more generally (Kijima, 2006).

                                                      2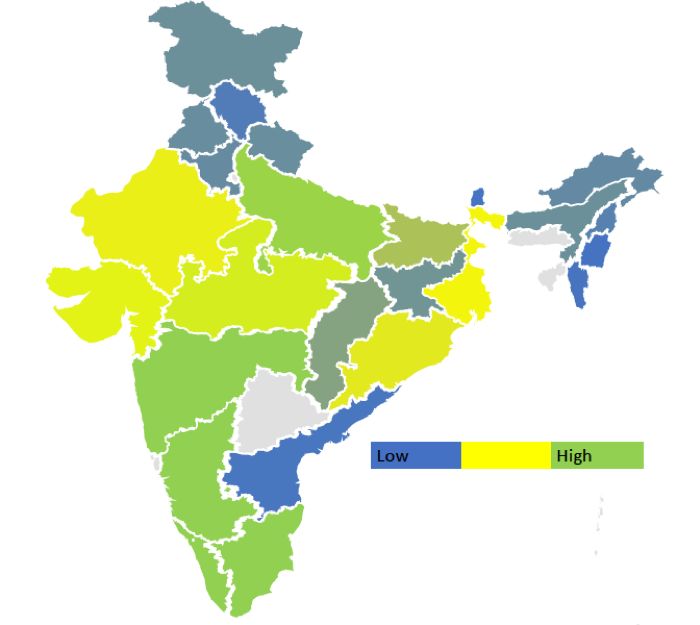
agency frictions, and long-term firm value, a novel dataset on surnames mapping to their
native language, caste, and native place in India is developed. I use these social identities
because implicit stereotypes or biases are stronger for these social identities and one can
easily detect these identities from a surname. As there is no readily available database to
provide the identities of managers and directors, therefore, a surname dataset developed
using the information of 474 million Indians from socio-economic Caste Census (SECC)
along with the Linguistic Survey of India (LSI) data to know the identities of managers and
directors. The details of this dataset is provided in section 3.2. These identities related to
                                                                                           4
surname form the identities of the principal (board) and an agent (manager).
       By discerning the identities of managers and directors, homophily (or group identity)
variables are computed based on native language, native place, and caste. To examine the
role of homophily in executive compensation, firm value, and agency frictions, I use panel
data of 2,324 non-financial firms listed on two main Indian stock exchanges - Bombay Stock
Exchange (BSE) and National Stock Exchange (NSE) from 2004-2018. The main empirical
results show that the manager gets 6-8 % higher compensation if the manager speaks the
same native language or belongs to the same native place as the majority of the board
members. This can be construed as a cost of in-group favoritism borne by the shareholders.
I also find that the firm value (measured as Price to Book ratio) is 11-12% higher for such
firms compared to their counterparts. Even if the cost of in-group favoritism is excluded, the
residual firm value (a proxy for manager’s reciprocation to in-group favor) is 8-9% higher
for such firms, implying that the manager exerts extra effort due to shared group identity,
which leads to a reduction in agency frictions. These results are robust to firm fundamentals
and corporate governance characteristics. The result that the individuals put extra effort for
in-group members compared to out-group members is in line with the literature on group
   4
    The surname dataset provides composition of all the Indian surnames at the state level, language level,
and caste level. As there is no major intra-country movement of any community in India except Kashmiri
pandits in 1990, this surname database would provide the correct identities of managers and of directors.

                                                    3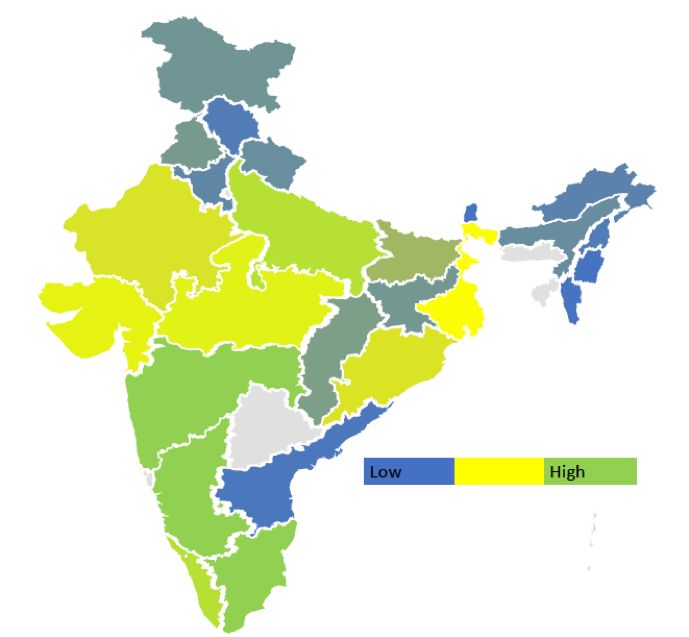
identity in social psychology and social neuroscience (Cikara and Bavel, 2014; Allport, 1954).
   To check the external validity of my homophily measures, I reconstructed the identity
variables based on an alternative dataset from “Indianchildnames.com”. This website fea-
tures the largest collection of names (roughly 125,000) and surnames (roughly 15,000) of
Indian and International origins. The results are robust to these alternative measures of
native place and native language. To assess the external validity of my dependent variables,
the total compensation and Price to Book ratio are replaced with compensation relative to
the industry average and with sales growth. The results are consistent; manager gets higher
compensation due to in-group favoritism and group identity reduces agency frictions and
increases firm value.
   As there can be an endogeneity issue because the board can select a manager who has
the same identity as their own to reduce the frictions in corporate decision making (Dama-
raju and Makhija, 2018), I follow Fracassi and Tate (2012) and use the director’s death or
retirement as a shock to the identity of the board. I still find results that are consistent
with the main results. One can argue that a director’s death or retirement may or may not
change the board identity and hence, the homophily constructs. To mitigate such concerns,
additional test is conducted. Rather than using the death or retirement of a director as a
shock, change in homophily due to it is considered as shock; otherwise, not. The results
from the additional test suggests that the coefficient of language and the place homophily
are positively associated with managerial compensation, firm value, and residual firm value;
it confirms the paper’s main findings.
   I also test for parallel conjectures such as managerial influence on firm, college ties, or
ties from past employment between a manager and board members. Adams et al. (2005)
show that firm in which the CEO has greater power to influence decisions also has higher
performance variability. Therefore, I control for ‘powerful CEO’ measures of Adams et
al.(2005) and show that homophily results still hold. Farcassi and Tate (2012) show that

                                              4
powerful CEO is more likely to appoint known directors and these CEO-director ties reduce
firm value. From the network connections used in Farcassi and Tate (2012), the most common
are past employment and the least common are education and current employment. To
mitigate the concerns that results are not driven by ties from past employment or college
ties, I show results controlling the measures based on these ties. The homophily results are
still robust. The coefficient of ’powerful CEO’ measures and past experience ties are in line
with Adams et al. (2005) and Farcassi and Tate (2012).
Lastly, I discuss the results along with findings from other comparative papers that why
homophily based on some identities affect firm decisions (such as selecting the manager (or
director), executive compensation, job assignments, etc.) and firm performance (or value)
and not all.
This paper is close to Cai et al.(2013) which investigated how family ties with firm heads
affect managerial compensation and job assignment in Chinese private firms. Cai et al.(2013)
show that family managers earn higher salaries and receive more bonuses, hold higher posi-
tions, and are given more decision rights and job responsibilities than non-family managers
in the same firm. However, unlike Cai et al. (2013), this paper shows that favoritism due
to in-group bias (not familial bias) also leads to higher managerial compensation, and but
also that the firms benefited from the bias as it increases the firm value and reduces agency
frictions. This paper can also be seen in accord with Fracassi and Tate (2012) which shows
that CEO-director ties based on shared experiences reduce firm value in the absence of
other governance mechanisms to substitute for board oversight. I show that shared iden-
tities between CEO and board increase firm value under strong governance such as high
promoters(founders)holding.
In sum, this paper shows that shared group identity between a manager and the board
members can increase the executive compensation due to in-group favoritism and the firms
with group identity have higher value compare to other firms. Furthermore, the residual firm
5value (i.e. the firm value conditional on executive compensation of the last year) is higher for
such firms, implies that the manager puts extra effort when there is a shared group identity
between him and the board. These results imply that although in-group favoritism is a cost,
it can reduce agency frictions and can increase long-term firm value.
2 Related Literature and Contribution
Psychologists have long posited a self or “ego” as a primary force of individual behavior.
They have further associated an individual’s sense of self to social categories; and individu-
als identify with people in some categories and differentiate themselves from those in others
(Akerlof and Kranton, 2010). Research in social pyschology has even shown that people
categorize themselves and others based on trivial criteria (Tajfel et al., 1971) and this cate-
gorization can be very fluid and is often context dependent (Turner et al., 1994). For instance,
Steele and Aronson (1995) find that African-American students, who are stereotyped to be
poor students, underperformed relative to white students when they are told that the test
is diagnostic of their abilities. In a similar kind of experiment, Levy (1996) find that elderly
people perform worse on a memory task if they have previously been primed with a negative
stereotype of the aging. Using gender as an identity, Carlana (2019) shows that implicit
stereotypes in teachers regarding gender induce girls to underperform in math and self-select
into less demanding high-schools, following recommendation of their teachers. This form of
implicit biases due to identities is likely to be the primary driver of prejudice, stereotyping,
discrimination, and in-group favoritism (Crisp and Hewstone, 2001). According to the social
psychology literature, if identity remains in the sub-conscious mind due to strong priming
effect and legitimatized by groups of people in society, then that identity gives a birth to a
stereotype related to that identity.
The recent literature in economics and finance have shown that how in-group favoritism
6affects the decision making of loan officers (Fisman, Paravisini, and Vig, 2017), sell-side
analysts (Jannati et al. 2019), the board of governors in M&A deals (Bhalla et al. 2018),
employers (Becker, 1957; Bertrand and Mullainathan, 2004; Banerjee et al. 2009, Cornell
and Ivo, 1996; Charles Sarsons, 2019), retail investors (Morse and Shive, 2011; Grinblatt
and Kelohraju, 2001), and mutual fund investors (Kumar et al. 2015), auditors (Cunnigham
et al. 2018; Du, 2017), students and instructors (Fairlie, Hoffmann, and Oreopoulos, 2014),
venture capitalist syndicates (Gompers et al. 2016). But the literature is silent on what role
social identities play in the board room and what is the capability of the identities to change
executive compensation, agency frictions, and long term firm value. This paper seeks those
answers.
Contribution: This paper makes a contribution toward the literature on agency prob-
lem, executive compensation, corporate governance, and the role of identity economics in
corporate finance.
Modern finance theory argues that the proper objective of managers is to maximize the
value of the firm, which in general means running the firm in the shareholders’ interests.
But managers are self-interested individuals. Because managers have effective control over
the firm, they can make decisions and take actions that serve their own interests (Jensen
and Meckling (1976), Aggarwal and Samwick (1999)). The problem that surfaced due to
separation of owners and manager is known as ’agency problem’. Adam Smith forecasted in
his work ‘The Wealth of Nations’ that if an organisation is managed by a person or group of
persons who are not the real owners, then there is a chance that they may not work for the
owners’ benefit. Berle and Means (1932) later supported this concern in their thesis, where
they analysed the ownership structure of the large firms of the U.S. and observed that agents
appointed by the owners control large firms and carry the business operations. They argued
that the agents might use the property of the firm for their own end, which will create the
conflict between the principals and agents.
7There are different theories on agency conflict and its existence. Arrow (1971) and Wilson
(1968) postulate that agency conflict occurs due to risk-sharing between the principal and an
agent who have opposite risk preferences. The principal or the owners invest their capital and
expect to gain economic benefits from it, whereas the agents are risk-averse and concerned in
maximizing their private benefits. Ross (1973) regarded the agency problem as the problem
of incentives, while Mitnick (1975) considered the problem occurs due to the institutional
structure, but the central idea behind their theories is similar. Grossman and Hart (1983)
explained that the principal’s consumption gets affected by the agent’s output. The agent’s
level of effort affects the firms’ output, where the principals desire for a higher level of
effort from agents. Hence, the principal should trade-off the agent’s behavior with a proper
payment structure. The incentive structure is affected by the agents’ attitude towards the
risk and information quality possessed by the principals, and no incentive problem arises if
the agent is risk-neutral. The current study proposes that the similarity of social identities
between the principal and an agent can reduce agency frictions. In that respect, this work
contributes towards the literature on behavioral agency theory, which is propounded by
Wiseman and Gomez-Mejia (1998), Sanders and Carpenter (2003), and Pepper and Gore
(2012).
Due to the agency problem, there is considerable debate among both academics and prac-
titioners on what should be the executive pay and how it affects the firm value. According to
a literature review by Edmans, Gabaix, and Jenter (2017), there are three broad perspectives
on executive compensation - “shareholder view”, “rent extraction view”, and “institutional
view”. The “shareholder view” suggests that compensation contracts are chosen to maxi-
mize value for shareholders, taking into account the competitive market for executives and
the need to provide adequate incentives. The “rent extraction view” argues that executives
themselves set contracts to maximize their rents. Lastly, the ”institutional view” explains
the role of institutional forces, such as regulation, tax, and accounting policies in executive
8compensation setting. The rent extraction argument starts with the observation that, in
practice, executive pay is set by the board of directors and its compensation committee.
This creates another agency problem, as directors on the compensation committee have
their own agenda and may have incentives to favor executives (Edmans, Gabaix, and Jenter
(2017). In theory, market forces, including the market for corporate control, capital markets,
product markets, and the managerial labor market, impose constraints on how much value
destruction directors (and executives) can allow from rent extraction. In reality, constraints
from market forces can be loose and permit large deviations from efficient contracting (Be-
bchuk, Fried, and Walker, 2002). There is limited theoretical work in this area and empirical
papers are mainly related to pay for non-performance (such as Pay-for-luck, severance pay,
pay for acquisitions, option repricing, incentive rigging, or hedging), hidden pay (option
compensation, backdating options, perks, pension, performance-based equity, or severance
pay) and the association of certain practices with poor corporate governance. The current
study connects the “rent extraction view” with “shareholder view” and suggests that rent
extraction by an manager (hidden pay due to similar social identities as the board members)
should not be considered as cost to the firm if the manager increases the firm value condition
on the compensation paid.
Corporate governance and its effectiveness plays a big role in executive compensation
(Core, Holthausen, and Larcker, 1999; Fahlenbrach, 2009; Armstrong, Ittner, and Larcker,
2012). Researchers have checked the impact of board size, number of independent directors,
gray directors and staggered board on executive compensation. But the identities of the
board members are also essential. Delis et al.(2017) show that the impact of genetic diversity
in the country of origin of the firms’ board members on corporate performance and find that
adding board of directors from countries with different levels of genetic diversity (either
higher or lower) can increase firm performance. Using a sample of US firms and gender
as identity, Adams and Ferreira (2009) find a negative impact of having females on the
9board on firm performance, despite better attendance records and more effective monitoring
in firms with more gender-balanced boards. On contrary, Gregory-Smith et al. (2014)
find no evidence that the gender composition of the board affects firm performance. Core,
Holthausen, and Larcker (1999) showed that firms with weaker governance structures have
greater agency problems and CEOs at such firms receive greater compensation; and that
firms with greater agency problems perform worse. One part of this paper examines whether
similarity in social identities between a manager and the board reduces agency problems or
not.
Lastly, this paper contributes to the literature on identity economics in corporate finance.
Identity economics literature mainly discusses how identities can change outcomes due to
implicit biases (Bertrand et al., 2005) or due to taste-based discrimination (Becker, 1971).
Identities can be divided into two types - by experience (educational institute, past em-
ployer, same club etc) or by birth (gender, native place, native language, race, caste etc.).
The implicit biases and stereotypes are far stronger in the latter case. Like, Fisman et al.
(2018) shows how hometown ties of a candidate with fellow selection committee members
can increase the selection probability in Chinese Academies of Sciences and Engineering by
39%. Fisman, Paravisni, and Vig (2017) show how group identity between the loan officer
and the borrower based on the identities like religion and caste increases credit access and
loan size dispersion, reduces collateral requirements, and induces better repayment even af-
ter the in-group officer leaves. Contributing to this literature, this paper examines how the
similarity in identities (based on caste, native place, and native language) between board
and manager can change managerial compensation, managerial effort toward the firm, fric-
tions between a manager and the board and the future firm performance. Similarly, related
to in-group favoritism and its impact, Gompers et al. (2016) show that venture capitalists
who share the same ethnic, educational, or career background are more likely to syndicate
with each other and this homophily reduces the probability of investment success, and the
10detrimental effect is most prominent for early-stage investments. As the role of homophily
in an organization, the theoretical work of Moisson and Tirole (2020) explores the trade-off
between meritocracy and homophily in selection and promotion process in the organization
setup and checks the entrenchment and welfare properties of an organization. Unlike Mois-
son and Tirole (2020), I did not include the meritocracy of a manager in the theoretical
setting, however, in my empirics, I control for manager’s education as proxy of meritocracy
for the subsample. This paper extends the ongoing work on the role of identities in an or-
ganization and provides a theoretical perspective and empirical evidence on how identities
change managerial compensation, firm value, and agency frictions.
3 Institutional Details
To examine the role of homophily based on native language, native place, and caste
in executive compensation and firm value, India provides a perfect setting due to cultural
diversity and persistent caste-based discrimination in the labor market.5 Because Indian last
name provides these details about identities; therefore, this makes it easier for someone to
discriminate or provide favorable behavior.
Although Indian cultural diversity strengthens this research’s prominence, there are some
institutional differences between Indian firms compared to firms from developed markets
such as the United States. Compared to developed markets, where institutional context is
characterized by well-functioning capital, labor, and product markets, in emerging markets,
such as India, China, or Brazil, there are various market failures caused by information and
agency problems (Khanna and Palepu (2000)).6 Perhaps this makes it more important to
know whether a shared identity between manager and board of directors reduces the wedge
5
To review the literature on caste-based discrimination in the Indian labor market, refer to Vaid (2014).
6
Appendix in Khanna and Palepu (2000) provides the details comparison of India’s institutional context
with that in the United States and Japan.
11between them and affects the agency frictions or not. Another significant institutional dif-
ference between firms in emerging markets from developed markets is that, in the former,
firms have a significant amount of common ownership and control, usually by founders (pro-
moters). Concentrated ownership has its pro and cons. On one side, it aligns incentives
and encourages monitoring, but on the other side, it weakens further corporate governance
mechanisms and can impose significant costs. In the analyses, I control for additional corpo-
rate governance mechanisms discussed in Berglof and Classens (2006) to reduce the negative
impact of common ownership.
Structure of the Paper: The rest of this paper proceeds as follows. Section 4 provides
an intuition on how the similarity of a manager’s identity with the board can change his
compensation and firm value. Section 5 explains the datasets and the variables used in the
analysis. Section 6 reviews the methodology used for surnames matching and the empirical
specification used for the analysis. Section 7 provides the perspective on endogeneity con-
cerns and the identification strategy used to mitigate those concerns. Section 8 discusses the
results. Finally, Section 9 presents the concluding remarks.
124 Principal - Agent Problem with Identity Function
Model Setup The first order model of principal-agent given in Holmstrom (1979) and in
Edmans, Gabaix, and Jenter (2017) for the executive compensation setting is an underlying
framework here. According to this model, the board of directors hires a manager to run the
firm. The firm value is indicated by V (a, S, ) which is increasing in the manager’s action
a and firm size S. Suppressing the dependence on S and for simplicity, firm value is a
function of only managerial effort.
V (a) = S + b(S)a +
The manager is paid a compensation c(V ) contingent upon firm value. The limited liability
on the board is assumed which means c(V ) ≤ V ; that is manager pay should not be more
than firm value. Similarly, the limited liability of manager is assumed which means c(V ) ≥ 0
and reservation wage, w ≥ 0.
The model is modified by introducing group identity into the preference function by
providing different weights to the managerial effort component. This defines the agent utility
function with identity and it implies that the agent exerts more effort if the principal (board,
in this case) has the same identity as the agent. This kind of agent utility function is
suggested by Akerlof and Kranton (2005) and the similar way of incorporating into group
identity in preferences is adopted in Chen and Li (2009) and Chen and Chen (2011) and this
is in line with the literature on minimum-effort coordination games.7
The first order model from Holmstrom (1979) with group identity can be seen as,8
7
For more details on this topic, refer to Camerer (2003).
8
For simplicity, I follow the same assumptions as in Holmstrom and Milgrom (1987) i.e. manager exhibits
exponential utility ( u(x) = −e−νx ) and cost of effort is pecuniary (v(c) = c). The terms are shown without
the exponential part. For details, refer to Edmans, Gabaix, and Jenter (2017, Pp-43-45).
13max E[V-c] (Principal’s Problem)
s.t. E[ u(c-g(a))]≥ E[u(w)] (Participatory Constraint)
c = φ + θV (Managerial Compensation)
a∗ argmax E[c − g(a)] (Agent’s Problem)
V = s + b(s)a + (Firm Value)
g(a) : cost function of manager’s efforts
φ: Fixed component of the manager’s compensation (Salary)
θ: Variable component of the manager’s compensation
: Random variable with normal distribution. ∼ N (0, σ 2 )
Agent utility function from Akerlof and Kranton (2005)9 ,
U(c,a,m) = c - a + Im − tm |â − a|
a when â = a, in-group member (m = 1)
Agent’s effort including identity =
a − tm (â − a) when â > a, out-group member (0 ≤ m < 1)
â : Ideal or optimal effort
Im : Additional utility due to group identity (or homophily)
Agent’s effort including identity = a − tm (â − a)
m : Indicator variable for homophily (or group identity) which takes value 1 for complete homophily
i.e. manager and the board has the same identity; otherwise 0.
9
Im is identity utility which is considered as 0 for simplicity and tm |â − a| is disutility for diverging from
the ideal effort level for in-group member, denoted by â
14Proposition. Managerial efforts are different in case of complete homophily than from incomplete
homophily (0 ≤ m < 1).
Proof : Firm value and manager’s compensation using his identity included efforts,
V = S + b(s) [ a - tm (â − a)] +
c = φ + θ[s + b(s)[a − tm (â − a)]]
Following Holmstrom and Milgrom (1987), I use quadratic cost function of manager’s efforts, i.e,
g(a) = 12 ga2
E(u) = E[c − 21 g[a − tm (â − a)]2 ]
First order condition (FOC) :
dE[u]
da
= θb(s)(1 − tm ) − g[a − tm (â − a)](1 − tm )
θb(s)
g
= a∗ − tm (â − a∗ )
if m = 1 , the board and a manager share the same identity then â = a∗ and therefore,
θb(s)
a∗ = g
(1)
Else if 0 ≤ m < 1, that is board and manager have different identity, then
θb(s)
g
= a − tm (â − a)
a∗ = 1
1−tm
[ θb(s)
g
− tm â] (2)
This implies that in case of complete homophily (m = 1), the manager’s effort at equilibr
θb(s)
-ium is a∗ = g
and it is different, a∗ = 1
1−tm
[ θb(s)
g
− tm â] for incomplete homophily 0 ≤ m < 1.
Lemma 1. Different managerial efforts for complete and incomplete homophily lead to different firm
values at equilibrium.
Proof. As from eq(1) and eq(2), a∗(m=1) > a∗(0≤mTherefore, at equilibrium, V(m=1) > V(0≤m
a∗ and θ∗ are known from eq(1), eq(2), and eq(4)
From eq(4),
 ∗       ∗
θ(m=1 > θ(0≤m
5        Data

5.1       Surname Data

       To know the identities of managers and the directors, surname is invoked as the link
and this follows from sociology, anthropology, and social neuroscience literature. Sociolog-
ical studies find that “surname remains central to the establishment of a person’s sense of
belonging to a kin group” in contemporary times (Davies, 2011) and anthropologists have
long noted that kinship systems differ in their tightness: the extent to which people are
embedded in very large extended family networks. With tight kinship, effective cooperation
is believed to take place within cohesive in-groups, while people outside the group are dis-
trusted (Alesina and Giuliano, 2013; Moscona, Nunn, and Robinson, 2017). Conversely, in
loose kinship societies, people are said to enter productive interactions with strangers but
do not place special emphasis on the in-group member. Surname is widely perceived as an
important means of genealogy, potentially revealing one’s DNA information (Jobling, 2001).
It may also indicate one’s ethnic minority background and engender race biases (Kumar et
al., 2015). Importantly, a surname connects the bearer not only to family members, but also
potentially to many non-family members who share the same surname (Carr and Landa,
1983; Kiong and Kee, 1998). This creates a network and a bond embedded with rich social,
cultural, or even biological connection. These connections can be invoked when people bear-
ing the same surname meet or work together, making it easier for them to understand and
cooperate with each other. In addition to all these characteristics, a surname in India can
provide information such as family lineage, native language, native place, and caste which
makes it as a source of discrimination and favoritism.10
       Because identities of CEOs and directors of Indian firms were unavailable in any existing
  10
    Indian media has covered this issue many times such as “Ban Surnames to End Casteism” (Times of
India, 8th Aug, 2016), “Slash Surname to kill caste” (The Telegraph, 14th Oct, 2005) and similar others.

                                                  18
database, I needed to construct my own. I relied on two large datasets to develop my
database of Indian surnames linked to native language, native place, and caste–the Socio-
Economic Caste Census (SECC), a micro census database of 474 million Indians, and the
Linguistic Survey of India (LSI). The surname database used to determine the identities of
managers and the directors.
5.2 Microcensus Data
To generate identity variables based on native place and the caste, the Socio Economic
and Caste Census (SECC) 2011 data of 474 million Indians is used.11 This census is unique
because in the history of independent India, only two times caste is measured - in 1950
and in 2011. Registrar General of India conducted SECC 2011 and has approximately
4.6 million categories of caste, sub-caste, synonyms, different surnames, gotras in the caste
and clan names.12 The data contains individual’s name, age, gender, address (state,
district, and gram panchayat (similar to county)), caste, parents’ name, and other details.
To keep individuals’ information private, only surnames, caste, district, and state variables
are extracted.
The extracting surnames from Indian names using SECC data is a complex process due
to following reasons: First, names in the SECC data are given in English as well as in
native language separated by backslash (“\”). Second, occasionally, first name and surname
are amalgamated such as “DilipChauhan” (surname: Chauhan). When this occurs with
surnames of the same character length as only first name or amalgamated first-last name, it
makes difficult to extract surnames without including the noise. Third, names in north India
and south India are differently written in SECC data such as ”Ram Singh” is a north Indian
name with surname ‘Singh’ and ‘Chandra Rao P.K.’ is a south Indian name with surname
11
The exact number of observations in raw SECC data is 473,967,954.
12
https://www.thehindu.com/opinion/lead/the-tools-for-counting/article24247791.ece
19’Rao’. It exhibits that there is a different position of surnames in north Indian and south
Indian names in SECC data and this makes extraction further complicated. The long names
such as ‘Mohammad Kasim P.’ (surname: Kasim) also have the same pattern as south Indian
names. Details of generating a surname database from SECC 2011 using cloud computing is
explained in Appendix C. The final dataset is consolidated at the state level and contains
variables like surname, caste, and place of origin (state). The data is consolidated at the
state level because stereotypes and implicit biases are stronger at the state level rather than
13
at the district level.
5.2.1 Linguistic Survey of India (LSI) Dataset
The LSI is a comprehensive survey of Indian languages conducted for the first time in
1898 by an linguist George Abraham Grierson, a linguist, and obtained information on 364
languages and dialects. The second survey was conducted in 1984 and by 2010; it was 40%
complete but the project was abondoned after that. The third survey started as the People’s
Linguistic Survey of India (PLSI) in 2010. According to the 1991 census of India, there are
about 1,576 “mother tongues” with separate grammatical structures and 1,796 languages
classified as “other mother tongues.”
For this paper, I use Lacina (2017) data which contains linguistic composition of all the
640 districts of India. This data contains information on district id, state, district name,
population, Hindu population in a district, and the seven most popular languages in a district
with a percentage of the population speaking them.
For simplicity, I use only the most popular language in a district and further consolidated
the data at the state level which provides the data on the most popular language in 29 states
and 7 union territories. The final surname dataset contains native place, native language,
and the caste associated with Indian surnames.
13
Python code to scrape surnames with identities such as caste and state is available on request.
205.2.2 Alternative Surname Data
To externally validate the surname database developed using SECC and LSI, I develop an
alternate surname dataset from the website “Indianchildnames.com”. This website features
a large collection of about 125,000 names and 15,000 surnames of Indian and international
origins. Data on Indian surnames, their native language, and their native place is collected
using a web scraping technique. This dataset contains information on unique 2,225 Indian
surnames with their native language and native place. Merging this data with managers
and board members’ surnames from ProwessDx (CMIE) database using a text similarity
algorithm gives information on language and place of origin of directors and managers. The
details of the algorithm is provided in section 4.1.
5.3 Firm characteristics and Manager characteristics
ProwessDx (CMIE), Global Compustat, and the BoardEx databases are used for manager
and board member names, executive compensation data, firm fundamentals, board char-
acteristics, and managerial demographics. Extracting surnames from manager and board
members names are not straightforward because of various designations and their patterns
such as Mr./MR/Mr/(MR)/(Mr.)/(Mr), Dr./Dr/(Dr), Prof., Sh./Shri, I.A.S., army desig-
nations ( Maj. (Major), Gen. (General), Col. (Colonel), navy designations (Vice Admiral,
Commodore) and many others. Therefore, an algorithm employed to extract surnames from
a manager and the board members’ names is different from the way surnames extracted from
SECC names.
To avoid data complexities or unavailability of firm fundamentals, the sample comprises
only non-financial firms listed on two main Indian stock exchanges, Bombay Stock Exchange
(BSE) and National Stock Exchange (NSE), from 2004-2018. There are 2,324 firms in the
sample and 28,026 firm-year observations. Appendix A1 shows the filtration of observations
21from ProwessDx database to sample data. As the concept of CEO is new in India, therefore,
CEO-equivalent positions like Managing Director, Managing Director and Chairman are also
part of the sample.14 The distribution of managerial designation is provided in Appendix
B. The yearly distribution of the observations shows that the sample is balanced (Appendix
A2).
The compensation data from ProwessDx provides information on total compensation,
salary, perks, and retirement benefits. For the analysis, only total compensation and salary
data is used as most of the observations for perks and retirement benefits data are missing.
Log values of total compensation and salary are used due to skewness in the distribution.
Price to Book ratio is used as a proxy for firm value and it is measured as the ratio of
market price of the equity value by book value of the equity value. For the robustness check,
Sales Growth is used as another proxy of firm value. Sales Growth is calculated as growth
in sales compared to the previous year.
For the controls, Size, Firm age, Institutional Ownership, Promoters Ownership, Lever-
age, Volatility, BIG5,Board Size, Number of Meetings and ROA are used. The data to
construct these variables are from ProwessDx (CMIE). Size is measured as log of market
capitalization. Firm Age is the age of the firm from year of incorporation.Promoters Own-
ership is percentage of promoters equity holding to the total equity issued by the firm.
Institutional Ownership is percentage of institutional investors equity holding to the total
equity issued by the firm. Leverage is the ratio of total debt by total assets. ROA is mea-
sured as the ratio of net income to total assets. Board Size is total number of directors on
board. Volatility is return volatility. BIG5 is a dummy variables which takes value 1 if the
firm’s auditor is BIG 5 auditor; otherwise 0. Number of Meetings is the number of board
meetings in a year. The institutional ownership, promoters ownership, board size, number
14
Bertrand and Hallock (2001) uses the CEO, chairman, Managing Director positions for the top corporate
jobs.
22of board meetings, and BIG 5 are internal and external governance characteristics.
Because managerial characteristics like age, gender and education are not available in
ProwessDx, therefore, this data is gathered from the BoardEx database. But due to con-
straints in matching between these two databases, these characteristics are not available for
all the managers. Due to the same issue, the observations of managerial demographics such
as age, gender, and education are limited to 3,542 observations. The results controlling for
managerial demographics are provided in Appendix D.
6 Methodology
6.1 Surname Matching using Unsupervised Machine Learning
Due to lack of common identifier between surname dataset and ProwessDx dataset, a text
similarity algorithm is used to discern the identities of a manager and the remaining board
members. Text similarity algorithm is a simple form of unsupervised machine learning. The
two most common text similarity algorithms are Jaccard and Cosine. These two algorithms
gives different results if the two documents or sentences in question are too different in
length. In this case, both would give similar results as comparison is between two surnames
rather than between two documents.
For matching, surnames are first divided into bi-grams and by using Jaccard similarity
algorithm, similarity scores are computed. For this case, the Jaccard similarity is the ratio
of the number of common bi-grams in two surnames divided by the union of bi-grams in two
surnames.
A∩B
Jaccard Similarity = (6)
A∪B
23Here A and B are two surnames.
It can be understand by computing the Jaccard similarity score of ‘smith’ and ‘thomas’.
The bi-grams of ‘smith’ are {sm,mi,it,th} and bi-grams of ‘thomas’ are {th,ho,om,ma,as}.As
there is only one bi-gram is matching i.e. ‘th’ , therefore, Jaccard similarity is 0.125. It
is quite low because the surnames in this example are too discrete. For exact matching,
the threshold of similarity score is kept at 0.9 and above, and to confirm the matching, the
manual check was also conducted.
6.2 Empirical Specification
To test the role of in-group favoritism in setting executive pay, following empirical spec-
ification is used:
Yi,t = αi,t + β1 Homophilyi,t + β2 Xi,t + β3 Li,t + β4 Zi,t + γf irm + γyear
+ γDesignation + i,t (7)
The main dependent variable, Y, is either salary or the total compensation. Homophily
(a measurement of group identity) is a dummy variable that takes value 1 if the majority of
board members have the same identity trait (same native language, same caste, or the same
place of origin) as the executive/manager; otherwise 0. This paper uses a simple baseline
homophily measure as an estimate of in-group favoritism.15 The detailed literature surveys
15
The extensive literature on homophily has demonstrated such patterns across many dimensions, including
ethnicity, age, gender, religion, profession, as well as things like political opinions and other behaviors.
Homophily can arise for many reasons, such as biases in the amount of contact that people have with each
other (Blau (1977), Feld (1981), Rytina and Morgan (1982)), preferences for associating with individuals
with similar traits, behaviors, or backgrounds (Cohen (1977), Kandel (1978), Knoke (1990), and Currarini,
Jackson and Pin (2008) and Bramoulle and Rogers (2009)), competition among groups (Giles and Evans
(1986)), social norms and culture (Carley 1991)), and institutional and organizational pressures (Meeker and
24on executive compensation by Core, Guay, and Larcker (2002), Frydman and Jenter (2010),
and Edmans, Gabaix, and Jenter (2017) suggest that main determinants of executive pay
are mainly firm fundamentals, governance characteristics, and manager demographics. Fol-
lowing that suggestion, X is a vector of firm characteristics such as firm size, firm age, return
on assets (ROA), leverage, and volatility. L is the vector of governance characteristics such
as board size, number of board meetings, BIG 5 auditor, institutional ownership, and pro-
moters ownership. Z is the vector of manager demographics (such as education, age, gender,
and others). The γf irm and γyear are firm and year fixed effects. As results can be affected
due to managerial positions, therefore, γDesignation fixed effects is also used. As managerial
demographics is not available for the full sample, therefore, subsample results controlling for
manager’s age, gender, and education are provided in Appendix D.
To check the impact of homophily on firm value following, the empirical specification is
implemented:
F irmV aluei,t = αi + β1 Homophilyi,t + β2 X + β3 L + γf irm + γyear + i,t (8)
The coefficient of interest is β1 . As homophily is based on language, place, and caste,
β1 can be seen as βLanguage , βP lace , and βCaste . Firm Value is measured as the price to book
ratio. X and L are the firm characteristics and governance characteristics listed earlier.
Based on the prior literature, all βs of firm fundamentals and governance are expected to be
positive except for volatility and leverage. To avoid the impact of unobservables, firm and
year fixed effects are used.
Next, to check the reciprocation of in-group favor by the manager, the impact of homophily
Weiler (1970), Khmelkov and Hallinan (1999), Kubitschek and Hallinan (1998), Stearns (2004)).
25on the residual firm value is examined. The residual firm value is firm value conditioned on
managerial compensation of last year.
F irmV aluei,t = ξi + φT otalCompensationi,t−1 + εi,t (9)
The Residual Firm Value is ε. It captures the firm value conditioned on managerial com-
pensation; an increase in Residual Firm Value proxies higher managerial effort to increase
the firm value. To test whether Residual Firm Value is positively associated with homophily
variables or not, the following regression specification is used,
ResidualF irmV aluei,t = αi + β1 Homophilyi,t + β2 X + β3 L + γf irm + γyear + i,t (10)
The interpretation and the expectations for the βs are same as for the firm value regres-
sion.
6.3 Endogeneity Concerns and Identification Strategy
As the board can select the manager of the same identity in order to reduce frictions
in corporate decision making (Damaraju and Makhija, 2018), and this can affect the causal
inference of the results. Therefore, to mitigate this concern, I use a similar identification
strategy as in Fracassi and Tate (2012). The director’s death or retirement is used as an
exogenous shock as these events are not related to conditions inside the firm. Voluntary
retirement is not included as it can be due to firm related issues.
As ProwessDx does not have information on director’s date of death, therefore, this in-
16
formation is collected from BoardEx database. The empirical specification for this test
16
Boardex dataset on India uses various sources of information like specific database of Indian directors(
Directors Database), media information, etc. to construct their dataset.
26is,
Yi,t = αi +β1 Death+β2 Homophilyi,t +β3 Death×Homophilyi,t +β4 X +β5 L+γf irm +i,t (11)
Here Y is total compensation (Total Compensation), firm value (Firm Value), or firm value
conditioned on managerial compensation (Residual Firm Value). Death is a dummy vari-
able which takes value 1 if any director died or retired in that firm-year; otherwise 0. X is a
vector of firm fundamentals and L is a vector of governance characteristics. The coefficient
of interest is β3 . The firm (γf irm ) fixed effects is used to control for firm-level unobservables.
As time fixed effects can affect the coefficient of Death variable, it is not included in the
specification.
One can argue that a director’s death or retirement may or may not change the board
identity and hence, the homophily constructs. To mitigate such concerns, additional test
is conducted. Rather than using the death or retirement of a director as a shock, change
in homophily due to it is considered as shock; otherwise, not. Based on that, a DR C HS
dummy variable is constructed which takes value 1 if any director died or retired in that
firm-year and homophily changed relative to next year; otherwise 0. S designates a form of
homophily, i.e., due to language, place, or caste. The coefficient of DR x Homo S determines
whether homophily affected the managerial compensation, firm value, and residual firm value
before or after the shock. I find that the coefficient of interest for the language and the place
homophily is positively associated with managerial compensation, firm value, and residual
firm value, confirming the paper’s main findings. Results are provided in table D4.
277 Results and Discussion
7.1 Univariate Analysis
7.1.1 Identities of the Managers and the Directors
Figure 1 shows maps showcasing the distribution of managers and directors as per their
native place in India. These maps exhibit that although directors and managers are from
all over India most of them originally from southern India. In a parallel analysis, I find that
most of founders come from northern India. This implies that, in India, wealth creators
come from the northern region while wealth managers come from the southern.17
[Insert Figure 1 Here]
The pie charts in Figure 1 shows that most of the directors and the managers in India
belong to the upper caste and only 21-24% are from a lower caste. This distribution is more
skewed at managerial level than at directors level.
Figure 2 shows the distribution of managers and directors as per their native language
and conveys that most of the managers and directors speak Marathi, Tamil, or Westeren
Hindi and this group comprises 14-18% of the sample. Other popular native languages
spoken by managers and directors are Malyalam, Gujarati, and Kannada. The native place,
18
native language, and caste forms the identities of the managers and the directors.
[Insert Figure 2 Here]
17
Indian Media has also pointed out that half of the top ten Indian billionaires figuring in the list of
Bloomberg Billionaires are Gujaratis (state in a northern India) and one in three CFOs of Nifty index
companies is south Indian. For details check, https://economictimes.indiatimes.com/news/politics-and-
nation/stereotypes-dominate-indias-rich-list/articleshow/46857906.cms?from=mdr
18
The table A4 shows the industrial distribution of homophily variables. In certain industries such as
metal and mining, consumer durables, media print, wines cables, wood wood products, fertilizers, and
similar others have more homophily between a manager and the board as compared to other industries.
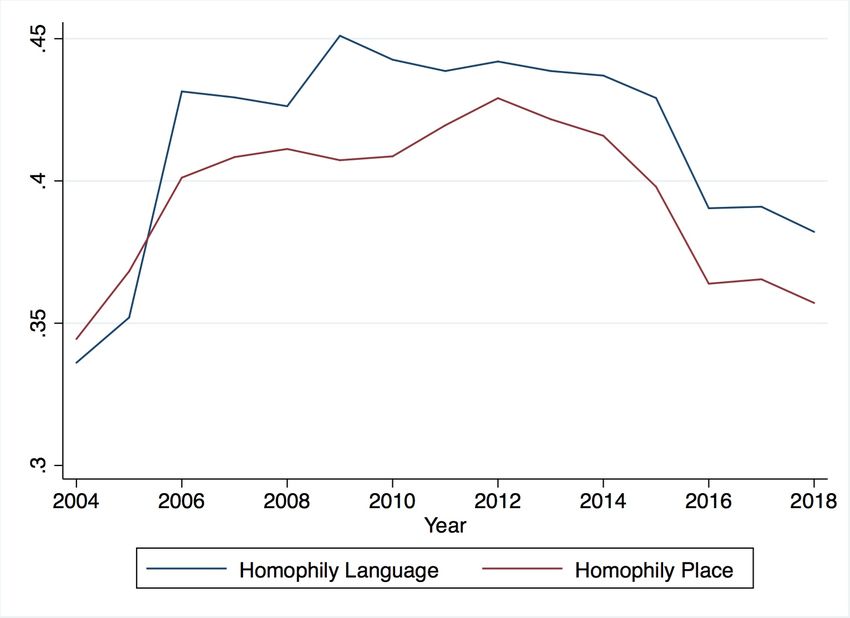
28As there can be a concern that homophily constructs might be time invariant, but graphs
in A5(appendix) show that it is not true and these constructs change with time. It hap-
pens because change in manager or director’s leaving or joining the board can affect these
constructs.
7.1.2 Summary Statistics
Table 1 shows the summary statistics of the main variables used in the analysis. The
average (maximum) total compensation of CEO or CEO equivalent position in India is
192,000 USD (2,461,000 USD).19 The major part of the total compensation is salary and the
variable components of the pay comprise perquisites and retirement benefits. The average
Salary is 132,000 USD and maximum is 1,116,000 USD. Unlike in the US, the mean variable
pay in India is 17% of total remuneration. Summary statistics and distribution of managerial
compensation are compared with Chakrabarti et al. (2012). As total compensation and
salary are skewed, log of total remuneration and salary is used for the analysis. Figure 3
shows the kernel density curves of Log Remuneration and Log Salary with normal density
curves for reference. It shows that taking the logarithm of total remuneration and salary
reduced the skewness in these variables.
[Insert Figure 3 Here]
The mean (max) of Log Remuneration (LogCompensation) is 10.611 (13.634). Log Salary
is a log of the salary component. The mean(max) of Log Salary is 10.4 (13.493). For
the external validity test, I also use compensation relative to the industry average as a
dependent variable. The mean(max) of industry relative compensation (Industry Relative
Compensation) is 0.003 (3.752). The standard deviation of total compensation is higher
19
To provide the sense of these numbers in comparison to US executive compensation, for the period 1982
through 1988, the average salary and bonus for CEOs of large public companies was 843,000 USD. (Jensen
and Murphy, 1990)
29compare to the standard deviation of the salary component and this probably due to variation
in perks. Log compensation and industry relative compensation variables are used to show
how the executive compensation gets affected by in-group favoritism.
[Insert Table 1 Here]
To show how the firm value is affected by group identity (homophily), Price to Book
ratio and Sales Growth are used as proxies of firm value. Price to Book ratio is the ratio
of the market price of equity to the book value of the equity. The mean (max) value of
Price to Book ratio is 2.238 (19.260). Sales Growth is change in sales compared to last
year. The mean (max) of Sales Growth is 0.145(7.067). To show how the firm value is
affected by the homophily even after paying the cost of in-group favoritism, Residual Firm
Value is computed. The Residual Firm Value is the residual of regressing the firm value
on last year’s managerial compensation. The underlying theory for using it as a proxy of
managerial reciprocation is that the determinants of residual firm value should be either from
firm characteristics or from governance characterstics; if homophily explaining a part of it
that means it is due to the manager’s extra effort for the firm.The mean (max) of Residual
Firm Value is -0.014 (8.470).
The three main independent variables are Homophily Language, Homophily Place, and
Homophily Caste. These variables are dummy variables and take value 1 if the board and
the manager share the same identity, i.e., native language, native place, or caste. In the
40-42% of the observations in the sample, the board and the manager speak the same native
language or come from same native place. This indicates that the sample is balanced on
these identities. However, there is a skewness in the variable - Homophily Caste. In 89% of
the observations, the board and the manager belong to the same caste. As the board and
managerial positions are dominated by upper caste individuals, the skewness in Homophily
Caste results from it. Table 1 Panel B shows the distribution of Homophily variables in
detail.
30You can also read