DOES WORKING FROM HOME WORK? EVIDENCE FROM A CHINESE EXPERIMENT
←
→
Page content transcription
If your browser does not render page correctly, please read the page content below

DOES WORKING FROM HOME WORK?
                  EVIDENCE FROM A CHINESE EXPERIMENT

           Nicholas Blooma, James Liangb, John Robertsc and Zhichun Jenny Yingd

                                       November 6, 2014

Abstract:
A rising share of employees now regularly work from home (WFH), but there are concerns this can
lead to “shirking from home.” We report the results of a WFH experiment at Ctrip, a 16,000-
employee, NASDAQ-listed Chinese travel agency. Call center employees who volunteered to WFH
were randomly assigned either to work from home or in the office for 9 months. Home working led
to a 13% performance increase, of which 9% was from working more minutes per shift (fewer
breaks and sick days) and 4% from more calls per minute (attributed to a quieter and more
convenient working environment). Home workers also reported improved work satisfaction and
their attrition rate halved, but their promotion rate conditional on performance fell. Due to the
success of the experiment, Ctrip rolled out the option to WFH to the whole firm and allowed the
experimental employees to re-select between the home and office. Interestingly, over half of them
switched, which led to the gains from WFH almost doubling to 22%. This highlights the benefits of
learning and selection effects when adopting modern management practices like WFH.

Keywords: working from home, organization, productivity, field experiment, and China
Acknowledgements: We thank Jennifer Cao, Mimi Qi and Maria Sun from Ctrip for data, advice
and logistical support. We thank Chris Palauni, David Butler, Jared Fletcher and Michelle Rowan
for their time discussing home-working and the call-center industries. We thank our formal
discussants Mushfiq Mobarak, Rachael Heath, Sabrina Pabilonia, Shing-Yi Wang, our editors
(Larry Katz and Andrei Shleifer) and our four anonymous referees, and numerous seminar
audiences for many helpful comments. We thank the National Science Foundation and Toulouse
Network for Information Technology (which is supported by Microsoft) for co-funding for this
project.

Conflict of interest and IRB statement: No funding was received from Ctrip. James Liang is the co-
founder of Ctrip. During the experiment we report here he was non-executive Chairman of Ctrip.
Since the end of the experiment he has returned to Ctrip as CEO. No other co-author has any
financial relationship with Ctrip. Neither the results nor the paper were pre-screened by anyone.
The experiment received Stanford IRB approval. The IRB did not require changes in our
experimental design.
a
 Stanford Economics, SIEPR, CEPR and NBER; b Beijing University Guanghua Management
School and Ctrip, c Stanford GSB and SIEPR, d Stanford Economics and Cornerstone Research.

                                                                                                1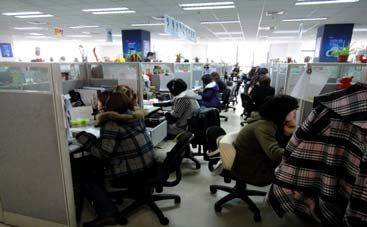
I. INTRODUCTION

Working from home (also called telecommuting or telework, but hereafter referred to as “WFH”) is
becoming an increasingly common practice. In the United States, the proportion of employees who
primarily work from home has more than tripled over the past 30 years, from 0.75% in 1980 to
2.4% in 2010 (Mateyka et al. 2012).1 At the same time, the wage discount (after controlling for
observables) from primarily working at home has fallen, from 30% in 1980 to zero in 2000
(Oettinger, 2011). Home-based workers now span a wide spectrum of jobs, ranging from sales
assistants and realtors to managers and software engineers, with a correspondingly wide range of
incomes (Figure I).2

Internationally, working from home also appears to be common. Figure II shows the share of
managers allowed to “work from home during normal working hours”, from a major telephone
survey we ran on over 3,000 medium sized (50 to 5000 employee) manufacturing firms during
2012-2013.3 This is a broader measure of WFH as it covers managers that are allowed to WFH
occasionally, for example, one day a week. We find two interesting findings. First, the share of
managers in the US, UK and Germany allowed to WFH during normal hours is almost 50%,
signaling this is now a mainstream practice. Second, the share in many developing countries is
surprisingly high, at 10% or 20%. Survey respondents from developing countries told us that WFH
is becoming increasingly common because of rising traffic congestion and the spread of laptops and
cell-phone connectivity.

Having employees work from home raises two major issues. First, is it a useful management
practice for raising productivity and profitability? This is an important question that lacks
systematic evidence or consensus. Even within a single industry practices often vary dramatically.
For example, at JetBlue Airlines, call-center employees all work from home, American Airlines
does not allow any home work, and United Airlines has a mix of practices. More generally, Bloom
et al. (2009) reported wide variation in the adoption rates of managers and employees of WFH
within every 3-digit SIC industry code surveyed.

The second issue relates to the concerns over deteriorating work-life balance and the potential of
working from home to help address this. The share of US households with children in which all
parent(s) were working has increased from 40% in 1970 to 62% by 2012 (Council of Economic
Advisors, 2014). The increasing pressure for parents to work is leading governments in the US and
Europe to investigate ways to promote work-life balance, with again a shortage of evidence:

    A factor hindering a deeper understanding of the benefits and costs of flexibility is a lack of
    data on the prevalence of workplace flexibility and arrangements, and more research is needed
    on the mechanisms through which flexibility influences workers’ job satisfaction and firms’
    profits to help policy makers and managers alike.

1
  This share was 1% in 1990 and 1.4% in 2000, so has been steadily increasing.
2
  Our experiment studies call-center employees, who are in lower income deciles, while professionals, managers and
even academics would be typical of those in the top deciles. Interestingly, the polarization of WFH into top and bottom
deciles looks similar to broad employment trends (e.g. Autor, Katz and Kearney, 2006)
3
  This data comes from questions included in recent waves of management surveys following the survey protocol
outlined in Bloom and Van Reenen (2007) and Bloom et al. (2014).

                                                                                                                     2
(Council of Economic Advisors, 2010, Executive Summary)

The efficacy of WFH as a management practice was what concerned Ctrip, China’s largest travel
agency, with 16,000 employees and a NASDAQ listing. Its senior management was interested in
allowing its Shanghai call-center employees to work from home because they perceived potential
benefits from reducing office rental costs, which were increasing rapidly due to the booming real
estate market in Shanghai. They also thought that allowing WFH might reduce the high attrition
rates the firm was experiencing by saving the employees from long commutes. But the managers
worried that allowing employees to work at home, away from the direct oversight of their
supervisors, would lead to a large increase in shirking. The call center workforce was mainly
younger employees, many of whom might well have been expected to struggle to remain focused
working from home without direct supervision.

Given the uncertainty surrounding the effects of working from home in the research literature as
well as in practice, the firm’s senior management decided to run a randomized controlled trial. The
authors assisted in designing the experiment and, essentially whenever feasible, our
recommendations were followed by management. We had complete access to the resulting data, as
well as to data from surveys conducted by the firm. We also conducted various surveys ourselves
and numerous interviews with employees, line supervisors and senior management.

In summary, Ctrip decided to run a nine-month experiment on working from home. They asked the
996 employees in the airfare and hotel departments of the Shanghai call center whether they would
be interested in working from home four days a week, with the fifth day in the office. 4
Approximately half of the employees (503) were interested, particularly those who were married,
had children and faced long commutes. Of these, 249 were qualified to take part in the experiment
by virtue of having at least six months tenure, broadband access and a private room at home in
which they could work. After a lottery draw, those employees with even-numbered birthdays were
selected to work from home, while those with odd-numbered birthdates stayed in the office to act as
the control group.

Office and home workers used the same IT equipment, faced the same work order flow from a
common central server, carried out the same tasks and were compensated under the same pay
system, which included an element of individual performance pay. Hence, the only difference
between the two groups was the location of work. This allows us to isolate the impact of working
from home versus other practices that are often bundled alongside this practice in attempts to
improve work-life balance, such as flexible work hours.

We found several striking results. First, the performance of the home workers went up dramatically,
increasing by 13% over the nine months of the experiment. This improvement came mainly from a
9% increase in the number of minutes they worked during their shifts (i.e., the time they were
logged in to take calls). This was due to reductions in breaks, time off and sick-days taken by the
home workers. The remaining 4% improvement came from home workers increasing the number of
calls per minute worked. In interviews, the workers attributed the increase in time worked to the

4
  The one-day-a-week specification was meant to allow for on-going training, which was important because Ctrip
introduced new services frequently. We are not aware of much debate at Ctrip about the “right“ number of days to set
for WFH, although JetBlue requires only one day per month.

                                                                                                                  3
greater convenience of being at home (e.g. the ease of getting tea, coffee, lunch or using the toilet)
and the increased output per minute to the relative quiet at home. Second, there appear to be no
spillovers to the rest of the group. Comparing the control group to similar workers in Ctrip’s other
call center in the city of Nan Tong, which was not involved in the experiment, we see no
performance drop despite the control group’s having lost the treatment lottery. Third, attrition fell
sharply among the home workers, dropping by 50% versus the control group. Home workers also
reported substantially higher work satisfaction and had more positive attitudinal survey outcomes.
Fourth, one downside of WFH appears to be that, conditional on performance, it was associated
with reduced rates of promotion of about 50%.

There are some obvious concerns with these results. First, was quality sacrificed for quantity by the
home workers? Using two different quality metrics we found no impact on quality of home
working. Second, could the results be driven by the control workers’ becoming frustrated by losing
the randomization lottery and then performing worse? To examine this, we compared the Shanghai-
based control group to similar employees in Nan Tong, and found no almost identical results. Third,
perhaps our results are driven by attrition bias. It turns out that in fact our results probably are
biased by attrition, but biased downwards, so the true impact of WFH is probably substantially
larger.

The overall impact of WFH was striking. The firm improved total factor productivity by between
20% to 30% and saved about $2,000 per year per employee working at home. About two third of
this improvement came from the reduction in office space and the rest from improved employee
performance and reduced turnover. 5

This led Ctrip to offer the option to work from home to the entire firm. It also allowed members of
the treatment and control groups to re-select their working arrangements. Surprisingly, over half of
all the employees changed their minds, indicating the extent of employee’s learning about their own
suitability for working from home. In particular, two thirds of the control group (who initially all
had volunteered to work from home 10 months earlier) decided to stay in the office, citing concerns
over the loneliness of home working. In reverse, half of the treatment group changed their minds
and returned to the office – especially those who had performed relatively badly at home, but also
ones who found the lack of social contact particularly costly.

This learning and re-selection led to the longer-run impact on employee performance from working
at home to rise to 22%, almost double the direct experiment effect of 13%. The reason was strong
selection effects: workers with relatively worse performance at home over the 9 month experiment
period returned to the office, while those who performed well at home stayed at home. Strikingly,
this ratio of selection plus direct effects (22%) to direct effects (13%) is similar to the 2:1 ratio in
Lazear’s well-known study of introducing piece-rate pay in Safelite Auto Glass (Lazear 2000). This
highlights how selection effects of employees across different working practices are an important
part of the impact of management practices, and makes this experiment – which followed
employees over the experiment and subsequent firm roll-out – particularly informative.

This highlights the learning by both the firm and employees around the adoption of a new
management practice like working from home. Ex-ante, both groups were unsure about its impact,
5
    See Online Appendix O.A for derivations of these figures.

                                                                                                      4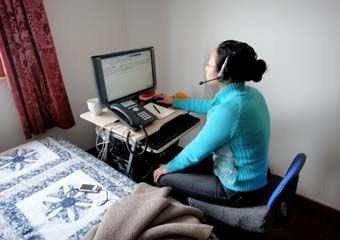
and the 9-month experiment and subsequent roll-out process were essential for their ability to
evaluate it. These gradual learning effects are likely a factor behind the slow adoption of many
modern management practices, and we see the results as being similar to the adoption process for
product innovations, like hybrid seed-corn as emphasized in Griliches’ (1957) classic article.

This experiment is, we believe, the first randomized experiment on working from home. As such, it
also provides causal evidence to supplement the prior case-study and survey research. It is also
unusual in that it involves a randomized controlled experiment within a large firm. Moreover, we
were also granted exceptional access not only to data but also to Ctrip management’s thinking about
the experiment and its results. This was because one of the co-authors of this paper, James Liang –
the co-founder and current Chairman and CEO of Ctrip – was a doctoral student at Stanford GSB
while we were working on the project.6 As a result, the paper benefited from unusually rich insight
into the rollout and adoption of a new management practice in a large, multinational firm.

Of course the experiment involved a particular group of employees – those working in call-centers
– who tend to be lower paid and with a high share (about half) of their compensation based on
performance pay. As such, the direct implications for performance are limited to these types of jobs.
But as Figure I shows, there are still many millions of US employees working from home in lower-
paid jobs, many of whom are in roles with measurable outcomes like telesales and IT support. More
generally, we also believe that the results on attrition and promotion have broader applicability –
many employees do seem to strongly prefer working from home, but may fear this reduces their
chances of promotion. Our study also highlights the importance of learning and experimentation
around working from home – Ctrip’s management and more than half their employees appear to
have changed their views in light of the experiment.

This paper connects to three strands of literature. First, there is a long literature that links the
puzzling dispersion of productivity between firms to differences in management practices (see the
literature from Walker (1887) to Leibenstein (1966) to Syversson (2011), Gibbons and Henderson
(2013) and Bloom et al. (2013)).7 Our paper suggests that uncertainty about the efficacy of new
practices may play a role in the slow diffusion of these practices, including those addressing issues
of work-life balance such as WFH. These practices have potentially large effects on measured
productivity. For example, based on the methodology that is used to measure productivity in Census
data (e.g. Foster, Haltiwanger and Krizan, 2000) Ctrip would have experienced a measured
productivity increase of around 20% to 30% after introducing working from home, even before
accounting for selection effects, because it increased output while cutting capital and labor inputs.

The second strand of literature is on the adoption of workplace flexibility and work-life balance
practices. It is based primarily on case-studies and surveys across firms. These tend to show large
positive associations of WFH adoption with lower employee turnover and absenteeism and with
higher productivity and profitability.8 However, these studies are hard to evaluate because of the
non-randomized nature of the programs. One exception is Kelly et al. (2014), who examined the

6
  For the four years during which Liang was a Stanford doctoral student he was non-executive Chairman rather than the
CEO of Ctrip.
7
  There is also a literature on performance in call centers - an industry which employs around 1 million people in the US
(Batt et al. 2004) – for example, Nagin et al. (2002) on how increased call monitoring reduces “rational cheating”.
8
  See, for example, see the survey in CEA (2010).

                                                                                                                       5
impact of a work-life balance training program randomized across branches of a large firm, finding
significant reductions in employee work-family conflict, and improved family-time and schedule
control.
There is also a connection to the urban economics literature. Reducing the frequency of commuting
will reduce vehicle miles travelled, lowering emissions, but also reducing population centrality as
people move out to the suburbs (Bento et al. 2005).9 WFH is also part of the wider impact of IT on
firm fragmentation arising from the increasing ease of long-distance communicating (e.g. Rossi-
Hansberg et al., 2009 and Glaeser, 2013). Ctrip has now set up regional offices to employ workers
in lower-wage, inland Chinese cities using the same WFH technology used in this experiment.
II. MODELLING WORKING-FROM-HOME DECISIONS
To anchor our thinking before examining the data we map out a simple model of the impact of
working from home on: (i) firm profits, (ii) employees hours, and (iii) selection effects. In all three
cases we find the impact is theoretically ambiguous, motivating Ctrip’s decision to experiment.
Firm Profits: We model the impact on profits of WFH as primarily driven by four effects10:
A) Hours: The number of hours worked from the official shift (as opposed to taken on breaks)
B) Call rate: The number of (quality adjusted) calls completed per hour
C) Attrition: The impact on quit rates (which drive hiring and training costs)
D) Capital: The impact on capital inputs, through office space and equipment requirements.
To highlight these we consider the firm’s profit per worker as a function of the fraction of the work-
week spent at home, denoted θ ∈ [0, 1]. Initially, we will assume that if a positive level of θ is
selected (WFH is implemented), all employees will choose to work from home this fraction of time.
We will later investigate if employees will choose to WFH or stay in the office.
Assume employees’ weekly shift is H hours per week, and they produce c (quality adjusted) calls
per hour worked. Calls have unit value of v to the firm. The number of actual hours worked is the
employee’s choice: H = 40 – B, where B is the time spent on breaks, and 40 hours is the nominal
shift length. The firm incurs three sets of costs. First, it must pay the employee a fixed base salary,
f, and a per call piece rate, w. Second, if the employee quits, the firm incurs recruitment and training
costs of t. We denote the probability of quitting by a. Finally, the firm needs to pay for its office-
space, k, at rental rate r, and WFH should reduce this space requirement. This yields the call-center
profits per employee as a function of the location of work:
vH ( )c( ) f wH ( )c( ) ta( ) rk ( ) ,
9
For example, JetBlue allowed home-based call center employees to live up to 3 hours drive from the office as they
needed to come into the office only one day per month. As a result, many employees chose to live in rural areas.
10
For tractability we are ignoring any longer-run impacts from adjusting wages, prices and skill levels. For example,
home-based employment might allow the firm to access other labor markets, e.g. people living in the outer suburbs of
Shanghai or women with young children. Empirically ignoring this is a reasonable short-run assumption as they did not
change during our experiment (their inclusion should make WFH relatively more attractive).
6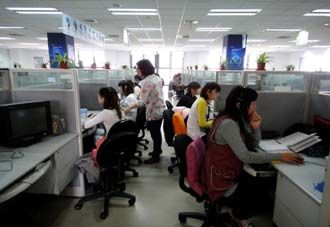
where we have allowed the location of work, θ, potentially to affect the amount of breaks the
employee takes, the call rate c, the attrition rate and the capital needs. If the firm considers WFH
(setting θ at a positive level), the first-order effect on profits is given by:
(v w)(c ' H H 'c) ta ' rk ',
where all derivatives are with respect to θ. If WFH is required, the effect on quits could go either
way, but assuming that the employee chose to work at home, a positive θ should reduce quitting.
Then ta ' ≥ 0. The reduction in capital costs from WFH, should also be positive, so rk ' ≥ 0.
Meanwhile, the term v w is positive (per call revenue is above marginal cost), so the focus is on
the terms c' H and H 'c , embodying the call rate and hours worked effects.
The call rate effect from work location, c' H , is ambiguous. It depends, for example, on the benefits
of supervisor support in the office versus the quieter working environment at home. This ambiguity
would seem likely in other contexts too. Tasks requiring concentration, such as writing papers, may
be best undertaken at home, while others involving team-work may be best undertaken in the office.
Employees hours: To evaluate the hours worked effect, H 'c , we need to consider the employee’s
problem. We take the employee’s utility to depend on income, Y, the amount of breaks during the
week, B, the amount of leisure L the employee enjoys over the work-week, and the location of
work. We write L as 80 T (1 ), where 80 is the number hours during the week when the
employee is not expected to be at work and T is the weekly commute time. Assuming for simplicity
that utility is linearly separable in income, the employee seeks to maximize
f wc ( )(40 B ) U ( B,80 T (1 ), ).
Taking the derivative with respect to B yields c( ) w U1 . Treating this as a first-order condition
yields the familiar trade-off of less income versus the utility gain from breaks. Just how the
employee’s time choice will depend on the location of work, θ, is then governed by the sign of the
cross-partial of utility with respect to B and θ: if it is negative (positive) then the employee will take
less (more) breaks when working from home.11 This cross-partial is
wc '( ) U12T U13 .
Thus, there are three channels that determine the direction of the effect of location on the hours
worked. First is the effect through c’: if productivity is higher (respectively, lower) at home, then
this leads to fewer (more) breaks when WFH. The second term reflects the impact on the
attractiveness of breaks from having more leisure from less commuting. This term is probably
negative because breaks and leisure are likely substitutes. Finally, the last term reflects the direct
impact of location on the attractiveness of breaks. This too could go either way: breaks at work
allow social interactions, but breaks at home allow watching television or playing games. So the
overall impact of WFH on hours is ambiguous.
11
See, for example, Milgrom and Roberts (1995).
7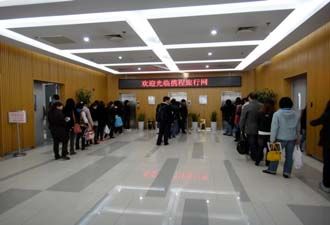
Selection Effects: Finally, we turn to the selection issue: given the option, will employees chose to
work from home? Let τ* indicate the employee’s optimal choice of how much time to spend at
home. In the Ctrip case, τ* was required to be 0 or θ, but for now we treat it as unconstrained. Then
the employee’s utility as a function of τ* can be written as
V ( ) c( *) w(40 B( *)) U( B( *),80 (1 *)T , *),
where B(τ*) is the optimal choice of breaks given τ*. A standard envelope theorem argument
indicates that dependence of this payoff on the location of work is determined by the sign of
c '( *) w(40 B( *)) U 2T U 3. .
Two things are worth noting about this. First, the sign of this is ambiguous at τ* = θ, so ex ante it is
hard to predict if employees will choose to work from home. Second, this condition is distinct from
the condition for WFH to increase hours worked, wc '( ) U12T U13 0, and from that for it to
increase firm profits, (v w)(c ' H H 'c) ta ' rk ' 0 . Hence, selection effects could be either
positive or negative, a further motivation for Ctrip to experiment.
III. THE EXPERIMENT
III.A. The Company
Our experiment took place at Ctrip International Corporation, a leading travel agency in China with
operations also in Hong Kong and Taiwan. Like other travel agencies internationally, Ctrip
aggregates information on hotels, flights and tours; makes reservations and obtains tickets for
clients; and generates revenue through commissions from hotels, airlines and tour operators.
Because of lower Internet penetration in China, Ctrip does much more of its business on the
telephone than leading U.S. agencies like Expedia, Orbitz or Travelocity. Ctrip was established in
1999, was quoted on NASDAQ in 2003, and was worth about $5bn at the time of the experiment. It
is the largest travel agency in China in terms of hotel nights and airline tickets booked, with over
50% market share in 2010. Exhibit I displays photos of the Ctrip Shanghai office, a modern multi-
story building that housed the call center in which the experiment took place, as well as several
other Ctrip divisions and its top management team. The firm also operates a second call center in
Nan Tong, a city about 1 hour away from Shanghai, which employs about 5,000 call center staff.
Both locations operate in the same fashion, with the same equipment under the same procedures.
Call center representatives are organized into small “teams”12 of around 10 to 15 people (mean of
11.7 and median of 11), grouped by department and the type of work. There were four jobs in each
of the two departments – hotel and airline – involved in the experiment. These were order takers,
who answered customer calls, took orders, and entered them into the Ctrip information system;
order placers, who dealt with the airlines and hotels and then notified the clients; order correctors,
who resolved problems such as a flight being canceled; plus a night shift that both placed and
corrected orders. The members of a given team sat together in one area of the floor, typically
12
The call-center jobs involved little “teamwork” and there was no group-based pay, but we stick with the term “team”
because that was what Ctrip called the work groups operating under a common supervisor..
8
occupying an entire aisle. Each call center representative worked in a cubical with equipment
including a computer, a telephone and a headset. When team members were ready to start work,
they logged on to Ctrip’s IT system and, in the case of order takers, client calls were automatically
routed into their headsets. Order placers and order correctors were also allocated tasks
automatically. The allocations between the two Shanghai and Nan Tong call centers were handled
centrally, using a standard computerized call queuing system. When employees wanted to take a
break, they logged out of the system. The team leaders patrolled the aisles to monitor employees’
performance as well as help resolve issues with reservations, provide ongoing training, and give
emotional support to employees dealing with difficult clients.

The employees typically worked 5 shifts a week, scheduled by the firm in advance. All members of
a team worked on the same schedule, so individuals could not choose their shifts. A team shared the
same team leader and the same work schedule, as well as the same call center working area.

Monthly earnings were composed of a flat wage and a bonus. The flat wage depended on seniority,
education, and prior experience, averaging around ¥1300 per month. The bonus portion depended
on the individual’s monthly performance, and also averaged about ¥1300 per month. The bonus was
primarily a linear function of call and order volumes, but with small adjustments for call quality
(penalties were applied for call quality scores below certain thresholds) and shift type (night shifts,
for example, were paid at a higher flat rate). Promotion to team-leader was also partially based on
performance, so both current pay and career concerns provided incentives for employees to perform
well.

Since no other Chinese firm had previously experimented with home-working for call center
employees, there was no local precedent. In the US, the decision to allow employees in call centers
to work from home varies across firms, even those within the same industry, suggesting a lack of
any consensus on its impact. Meanwhile, the prior academic literature on call centers also offered
limited guidance, being based on case studies of individual, firm-level interventions. Given this
uncertainty, and the management’s belief in data-driven decision making13, they decided to run an
experiment.

III.B. The Experimental Design
The experiment took place in the airfare and hotel booking departments in the Shanghai call center.
The treatment in our experiment was to work 4 shifts (days) a week at home and to work the 5th
shift in the office on a fixed day of the week determined by the firm.14 Treatment employees still
worked on the same schedule as their teammates because they had to work under the supervision of
the team leader (who was always office-based), but they operated from home for 4 of their 5 shifts.
For example, in a team the treatment employees might work from home from 9am to 5pm on
Monday, Tuesday, Wednesday and Friday and in the office from 9am to 5pm on Thursday. The
control employees from that team would work in the office from 9am to 5pm on all five days.
Hence, the experiment changed only the location of work, not the type or the hours of work.
Because all incoming phone calls and work orders were distributed by central servers, the work

13
  See, in particular, the discussion in Garvin and Dai (2012) about Ctrip’s adoption of scientific management.
14
  Ctrip had considered allowing for more variation in the number of days at home – for example, allowing employees
to choose between 0 and 4 – but thought this would be too complex to organize alongside the experiment. Meanwhile,
they wanted employees in the office once a week for on-going training on new products and services.

                                                                                                                9
flow was also identical between office and home locations. Home workers also used the same
Ctrip-provided computer terminals, communications equipment and software, faced the same pay
structure and undertook the same training as the control group (although for the treatment
employees this occurred only the day they were in the office).
Importantly, individual employees were not allowed to work overtime outside their team shift,
because doing so would require their team leader to supervise their work. Hence, entire teams could
have their hours changed – for example all teams had their shifts increased during the week before
Chinese New Year – but individuals were not able to work overtime on their own. In particular,
eliminating commuting time, which was 80 minutes a day for the average employee, did not permit
the treatment group to work overtime, and so this is not a factor directly driving the results.
Three factors other than location did differ between treatment and control. First, the treatment
group’s spending less time commuting meant that they would sometimes be able to take care of
personal and family responsibilities without taking breaks or leaving early from work. As we will
see, this appears to have had a significant effect. Second, the treatment workers did not have as
much support from their supervisors, because technological limitations meant that they could not
get real-time help while dealing with clients. If anything, this presumably reduced the effectiveness
of the treatment workers. Finally, the work environment differed between treatment and control.
The former were working alone, typically in what was reported to be a quieter environment. Being
alone had some negative effects in terms of high levels of reported loneliness (see Appendix B), but
the quietness had positive effects on productivity.
In early November 2010, employees in the airfare and hotel booking departments were informed of
the working from home program. They all took an extensive survey documenting demographics,
working conditions and their willingness to join the program. When asked about their willingness to
join the program, employees were not told the criteria that they would have to meet in order to
participate in the program. Employees who were both willing and qualified to join the program
were then recruited for the experiment. Of the 994 employees in the airfare and hotel booking
departments, 503 (51%) volunteered for the experiment. They tended to have a longer commutes,
less tenure in the firm, less education and their own bedrooms (see Table I). Importantly, prior
performance (measured simply by the gross wage, given that almost 50% of earnings were
performance-related pay) was not predictive for the take-up of working from home. This helped to
assuage one concern of the firm, that worse performing employees would be more tempted to work
from home to avoid the direct supervision of their team leaders. We also find that the r-squared for
predicting volunteering for WFH was rather low, at 3%, demonstrating how this choice is strongly
influenced by individual preferences.
Interestingly, 49% of employees did not volunteer to work from home, despite the potentially
considerable saving in commuting time and cost. The major reason given for this in later interviews
was the loneliness of working from home and the lack of opportunities to socialize in the office and
after work. Another reason, mentioned much less often, was the possible negative impact of WFH
on promotion, which, as we discuss in section IV below, appears perhaps to have been a somewhat
legitimate concern.
10To qualify to work from home, an employee also needed to have tenure of at least 6 months, have
broadband internet at home to connect to the network, and an independent workspace at home
during their shift (such as their own bedroom). Among the volunteers, 249 (50%) of the employees
met the eligibility requirements and were recruited into the experiment.
The treatment and control groups were then determined from this group of 249 employees through
a public lottery. Employees with an even birth date (a day ending 2, 4, 6, 8, etc.) were selected into
the treatment and those with an odd birth date were in the control group. This selection of even
birthdates into the treatment group was randomly determined by the Chairman, James Liang, by
drawing a ping pong ball from an urn in a public ceremony one week prior to the experiment’s start
date (see Exhibit II).15 The treatment group was notified and computer equipment was installed in
each treatment participant’s home the following week. Comparison between treatment and control
groups (see Appendix Table AII) shows there was a 5% significant difference between them in only
1 of the 18 characteristics: the control group was more likely to be have children. Running a joint
test on all characteristics finds no significant differences.16 Furthermore, since our main estimations
have individual fixed-effects this should help to control for any chance differences between the
treatment and control groups.
The experiment commenced on December 6, 2010 and lasted for 9 months, which employees knew
in advance. All treatment employees had to remain at home for this period, even if they changed
their minds and wanted to return to the office. On August 15, 2011, employees were notified that
the experiment had been a success and that Ctrip would roll out the experiment to those who were
qualified and wanted to work at home in the airfare and hotel booking departments on September
1st, 2011.
The employees were told throughout the experiment that it would be evaluated to guide future
company policies, but they did not learn the actual policy decision until the end of the experiment
on August 15th. Because of the large scale of the experiment and the lack of dissemination of
experimental results beyond the management team prior to the roll-out decision, employees were
uncertain about what that decision would be.
Employees in the treatment group had to remain working at home for the duration of the experiment
(even if they wished to return to the office). Likewise, the control employees had to remain in office
for the full duration. Hence, the treatment and control assignments were fixed for the full 9 months,
except for a few cases where employees changed apartments and lost access to their own rooms or
where a functioning Internet connection to Ctrip could not be established17.
Figure III shows compliance with the experiment throughout the experimental period, and for one
year after the general roll-out. During the experiment, the percentage of treatment group working at
15
It was important to have this draw in an open ceremony so that managers and employees could not complain of
“favoritism” in the randomization process. The choice of odd/even birthdate was made to ensure the randomization was
straightforward and transparent.
16
The F-test on all 18 characteristics in the randomization had a p-value of 0.466.
17
In all estimations, we use the even birthdate as the indicator for working-at-home, so these individuals are treated as
home workers. In a probit for actually working from home during the experiment, none of the observables are
significant, suggesting that returning to the office during the experiment was observationally random. One reason is that
the IT group policed this heavily to prevent employees fabricating stories to enable them to return to the office.
11home hovered between 80% and 90%. Since compliance was imperfect, our estimators take even
birth date status as the treatment status, yielding an intention to treat result on the eligible
volunteers. But as a robustness check in Table O.V (in the online appendix) we run the two-stage
instrumental variables estimation and find similar results to our main findings in Table II.
After the experiment, we see in Figure III that about 50% of the treatment group immediately
decided to return to the office, despite having to incur the financial and time costs of commuting.
Strikingly, only about 35% of the control employees – who all had volunteered initially to work
from home – actually moved home when they were allowed to do so. The main reasons both groups
gave for changing their minds were concerns over loneliness at home. Finally, we also see that
about 10% of the workers who did not initially volunteer changed their minds after the experiment
and decided to work from home.
It is worth noting that the firm’s management was surprised by two of the findings. First, they were
struck by how many employees changed their minds about working from home. More than 50% of
the volunteer group and 10% of the non-volunteer group switched preferences after the 9-month
experiment, primarily because of feeling isolated and lonely at home. The management thought
these types of problems would have been foreseen by employees in advance, but apparently not.
Second, despite the time and financial savings from not having to commute, more than half of the
workers eligible to work at home decided to return to work in the office, suggesting they placed a
high value on social interactions at work (Hamermesh, 1990). This is particularly striking because,
as we note below, we find no negative impact of home-working on performance or quality of
service.
III.C. Data Collection
Ctrip had an extremely comprehensive central data collection system, in large part because its
founding team came from Oracle and had extensive database software experience. The bulk of the
data we used in our paper were directly extracted from the firm’s central database, providing
extremely high data accuracy. The data we collected can be categorized in 7 fields: performance,
labor supply, attrition, promotions, reported employee work satisfaction, detailed demographic
information, and survey information on attitudes towards the program.
Performance measures varied by the job: the 134 order takers versus the 11 order placers, order
correctors, and night shift workers (details in Appendix A1). Order takers’ key performance
measures were the number of phone calls answered and number of orders taken. The key measures
for the other three groups were the numbers of different types of calls made. For order takers, we
could also accurately measure time spent working (in terms of minutes on the phone) because
phone calls and call lengths were recorded in the central database. The firm used these measures to
monitor the work of its employees. We also calculated phone calls answered and completed per
minute as a measure of labor productivity for these workers.
We have daily performance measures of all employees in the airfare and hotel booking departments
from January 1st, 2010 onwards, as well as daily minutes on the phone for order takers. We also
collected data on different types of promotion by September 2012, almost 2 years after the
experiment commenced. The firm ran internal surveys of the employees during the experiment on
12work exhaustion, and positive and negative attitudes. We conducted two rounds of surveys, in
November 2010 and August 2011, to collect detailed information on all the employees in the two
departments including basic demographics, income, and attitudes toward the program, and ran
extensive interviews and focus groups with the employees.
Finally, in May 2013 we ran a mandatory post-experiment survey on 957 employees (all remaining
treatment, control and non-experimental employees, and a random sample of 200 new employees)
to investigate their experiences and views on the costs and benefits of working from home (see
Appendix B).
IV. IMPACT ON THE FIRM
We analyzed the effect of home-working both in terms of its impact on the firm, which we cover in
this section, and the impact on the employees, which we cover in the next section.
IV.A. Individual Employee Performance
We first estimated the intention to treat effect on weekly employee performance for the eligible
volunteers prior to and during experimental period data via equation (1)
, , (1)
where Treati is a dummy variable that equals 1 if an individual belongs to the treatment group
defined by having an even-numbered birthday; Experimentt is a dummy variable that equals 1 for
the experimental period December 6th to August 14th; and Employee Performancei,t is one of the key
measures of work performance. This includes the log of weekly phone calls answered, log of phone
calls answered per minute on the phone, log of weekly sum of minutes on the phone, and an overall
performance z-score measure (performance score normalized to mean=0 and standard-deviation=1
based on pre-experiment performance for each task). Finally, reflects a full set of weekly time
dummies to account for seasonal variation in travel demand, such as the World Expo in 2010 and
the Chinese New Year, and reflect a full set of individual fixed effects.
To make performance of different types of workers comparable, we use performance z-scores. For
each individual we subtract the pre-experiment mean for the set of individuals holding the same job
(“worker type”) and divide by the pre-experiment standard deviation for the worker type. Hence,
this normalized z-score measure has a mean 0 and standard deviation 1 across all employees within
each type of worker during the pre-experiment period.
In column (1) of Table II, overall performance of the treatment group is found to be 0.232 standard
deviations higher than the control group after the experiment started, significant at the 1% level.
Column (2) limits the sample to only performance data during the experiment and compares the
treatment group to the control group without controlling for individual fixed effects. The coefficient
is slightly smaller but similar.18 If we limit the sample to the 134 order-takers, we can use phone
18
Because we have a randomized intervention we can examine either the difference between treatment and control
(evaluated over the experimental period), or the difference of differences (evaluated as the change in performance
13calls answered as the key performance measure. The z-scores of phone calls account for different
volumes and average lengths of phone calls in two departments. In column (3), we look only at the
phone calls performance measure and find it is 0.248 standard deviations higher in the treatment
group. In column (4), we look at the log of phone calls and find a coefficient of 0.120, meaning that
treatment employees were making 13% (noting that 13%=exp(0.120)) more phone calls per week.
We can also see these results in Figure IV where we plot the raw number of phone calls per week
for the treatment and control groups from Jan 1st 2010 until the end of the experiment in August 14th
2011. Before the experiment started, the treatment group trended closely together with the control
group, both of which bounced around due to seasonal fluctuations in demand. But once the
experiment began, the treatment group started to outperform the control group, answering about 40
more phone calls per person per week.
Interestingly, the difference in performance was greatest during the middle of the experiment, from
about 2 to 6 months. It seems the smaller rise in performance during the first 2 months was due to
installation and learning effects. It took several weeks for all the IT and logistical bugs to be
addressed. The gradual decline in the performance gap from 6 months onwards reflects two trends.
First, poorly performing employees in the control group were more likely to quit than those in the
treatment group (see section IV.B and Table VIII), boosting the control group’s performance
absolutely and relative to the treatment group. Second, from surveys and interviews we learned that
some employees in the treatment group felt lonely working at home after a few months and wanted
to return to the office but could not because of the experimental design. This potentially affected
their motivation.
Figure V plots the cross-sectional distribution of performance for treatment and control groups at 3
months into the experiment, highlighting the broad distributional improvement from working-from-
home (rather than the results being driven by a few outliers).
We further decomposed the difference in performance observed in column (4) into phone calls
answered per minute on the phone (a measure of productivity), and minutes on the phone (a
measure of high-frequency labor supply). In column (5), we found treatment employees were
handling 3.3% more phone calls per minute, which the employees attributed to home being quieter
than the office. They told us this meant it was easier to hear the customers, so they did not have to
ask them to repeat themselves as often and could process the orders more quickly. This suggestion
matches the psychology literature, which has shown that background office noise can reduce
cognitive performance (see, for example, Banbury and Berry, 1998).
The largest factor increasing the home-workers performance is that, as shown in column (6), they
worked 9.2% more minutes per day. This was despite the fact that home and office workers both
worked the same nominal shift. The reason home-workers could increase minutes on the phone was
between treatment and control over the experimental period versus the pre-experimental period). Since employees have
large pre-existing cross-sectional variations in performance we appear to obtain more accurate (lower mean-squared
error) estimations from using the difference in difference specification, estimated using the panel with employee fixed
effects. However, comparing columns (1) and (2) we see the estimators are quantitatively similar and within one-
standard deviation of each other. We also investigated two-way clustering by individual and week following (Cameron,
Gelbach and Miller, 2006) and found the results remained significant: for example, in Table II, column (1) the standard
error increased from 0.063 to 0.069, reducing the t-statistic from 3.70 to 3.35.
14that, within their shifts, they were available to take calls for more time, meaning they were taking
less break time off during their shifts.
Finally, in column (7) we look at another performance measure, which is the employees’ gross
wages (base pay plus bonus). Treatment employees’ wages rose by 9.9%, equivalent to about 250
Yuan (40 dollars) extra a month from higher bonus pays.
IV.B. Individual Employee Labor Supply
In Table III, we investigate the factors driving this increase in minutes worked within each shift.
Column (1) repeats the result of a 9.2% increase in minutes on the phone from Table II. Columns
(2) and (3) break this difference in minutes on the phone down into two pieces. In column (2), we
look at whether treatment workers spent more minutes on the phone per day worked, and column
(3) looks at whether they worked for more days.
Column (2) shows that about three quarters of the difference in the time on the phone was
accounted for by the treatment group’s spending more time on the phone per day worked. This is
because: (a) they started work more punctually, a phenomenon which they attributed to avoiding
the impact of events like bad traffic or the heavy snow in Shanghai in February 2011;19 (b) they
could schedule personal matters, like doctor’s appointments, in the time they saved by not
commuting (rather than having to leave early); and (c) they took shorter breaks during the day
because breaks (for lunch or toilet) were less time-consuming at home In column (3) we see that the
other one-quarter of the difference in time worked between treatment and control was explained by
treatment employees’ working more days because they took fewer sick-days (which are paid). The
most common reason employees provided in our post-experimental survey was that they would
work at home even when they were too ill to come into the office.
To investigate these effects further we interacted the WFH treatment dummy with a long commute
indicator. Individuals with long commutes should be more likely to increase their hours when WFH
since they are more likely to suffer commuting delays. Indeed looking at columns (4) to (6) we see
suggestive evidence for this: the differences in the weekly time on the phone as well as time on the
phone per day worked are larger for employees with a commute times of above 120 minutes per
day. 20 We also tried other interactions with marital status, children, education and tenure (the
variables that predicted WFH in Table I) and found no significant interactions.21
IV.C. Quality, Spillovers
One question is whether quality of the service was compromised for the increase in output in the
treatment group. We constructed two quality measures: conversion rates and weekly recording
19
Ctrip is strict with punctuality of its workers. If a worker comes to work late, it is recorded as taking time off.
20
21.3% of employees commuted for more than a total of 120 minutes per day.
21
This of course raises multiple inference problems in that we tested multiple interactions with marital and children
status as well as for commuting, and only reported the significant interactions with commuting. As such, these results
on the impact of commuting should be taken as more tentative.
15scores. Conversion rates were calculated as the percentage of phone calls answered that resulted in
orders, while the weekly recording scores came from the 1% of phone-calls that were randomly
evaluated by an external monitoring team. In summary (with the full details in online Appendix
Table O.III), we find no impact of working from home on quality using either measure.
Another related question is whether the improvement associated with working from home came
from an actual improvement in the treatment group or from a deterioration in the control group.
Perhaps the gap between treatment and control was caused not by the treatment group performing
better but by the control group performing worse after they “lost” the randomization lottery. The
group winning the treatment lottery saved themselves 9 months of commuting time and costs, a
substantial gain worth about 17% of their salary, evaluated at their Ctrip wage rate.22
We collected data on two other “quasi” control groups to answer this question. The first group was
the employees in the Nan Tong call center who would have been eligible under the selection rules
for the experiment. This call center also had airfare and hotel departments, and calls were allocated
across the Shanghai and Nan Tong call centers randomly from the same central server. The second
group was the 190 employees in the Shanghai call center who did not volunteer to participate in the
WFH experiment but met the eligibility requirements to work from home. We think these two
groups were comparable to the treatment and control groups for two reasons. First, all four groups
faced the same demand for their services. Second, they all met the requirements for eligibility to
participate in the experiment.
Comparisons of these alternative control groups are also reported in Table IV. Comparing the
Shanghai treatment group to Nan Tong or the non-experimental sample shows similar large positive
performance gains, while the control group shows no significant difference. This suggests that the
gap between the treatment and control group reflects an improvement in the performance of the
treatment group rather than any deterioration of the control group.23
IV.D. Potential Hawthorne and Gift-Exchange Effects
Another explanation for the superior performance of the treatment group are Hawthorne effects,
which suggest that the employees were motivated by the experiment, possibly deliberately so that
the firm would roll out WFH permanently. We should note four things, however, that make this
appear unlikely. First, there were 131 employees working from home, so each individual employee
had little impact on the overall evaluation of the experiment, and thus little incentive to try to
manipulate it. Second, those employees who changed their minds and returned to the office
performed no worse in the last 3 months than during the first 6 months, suggesting their reduced
incentive to make the experiment succeed had no significant impact on their performance.24 Third,
the gap between home-based employees and office-based employees widened after the experiment
22
The average employee made about $100 per week for a 40 hour week. The average commuting time was 40 minutes
each way and the corresponding out-of-pocket commuting cost averaged $0.50. Hence, the saving in time is about $13 a
week in time costs and about $4 per week in out–of-pocket costs.
23
We could in principle do a differences in differences comparison of the performance of treatment and control groups
during the days the treatment groups worked at home versus the days they worked in the office. Unfortunately, these
were not comparable because the team leaders often scheduled weekly team meetings during the days treatment groups
worked in the office
24
Formally, the F-test on the difference of difference between returners and non-returners between months 1 to 6 and
months 7 to 9 for the performance z-score and log(phone calls) had a p-value of 0.174 and 0.389 respectively.
16ended, as we shall see in the next section. Finally, the firm was itself so convinced that the success
of the experiment was not due to Hawthorne type effects that it rolled out WFH to the entire airfare
and hotel divisions.
An alternative story might be a gift-exchange type response (e.g. Falk and Kosfeld, 2006) in that
employees felt more positively towards Ctrip for allowing them to work at home and reciprocated
by working harder. This is of course possible, but some evidence appears to suggest this is not the
primary driver. First, the WFH “gift” was randomly allocated, so it is not obvious how much more
grateful treatment employees would feel than control employees. Second, in the May 2013 survey
we explicitly asked “How did working from home improve your performance?” Employees were
able to pick multiple options from seven different choices, with all 141 current and past WFH
employees responding. The most popular responses were “Convenience for toilet, lunch, tea, coffee
etc” which garnered 19% of the votes, “Quieter working environment” with 17% of the vote, and
“Can work even if I do not feel like coming into the office” with 13% of the vote. The gift-exchange
option “Feeling more positive towards Ctrip for allowing me to work from home” was next with
12% of the responses25. So, gift-exchange appeared to play some role, but was arguably not the
main driver.
IV.E. Post-Experiment Selection
In August 2011, management estimated that each employee working from home was worth about
$2,000 per year more to Ctrip (see details in Online Appendix O.A), so they decided to extend the
option to work from home to the entire hotel and airfare departments. Employees in these
departments were notified that the experiment had ended and they were entitled to choose their
locations of work (conditional on being eligible), so control employees who still wished to move
home could now WFT, and treatment employees who wanted to return to the office could do so
too.26
As shown in Figure VI – which plots the difference in normalized phone-calls between home and
office workers – post-experiment selection substantially increased the performance impact of
working from home. The reason is that workers who had performed badly at home tended to return
to the office. This increased the performance z-scores from home-working from about 50 calls per
week during the experiment to more than 100 calls per week 9 months after the end of the
experiment. This is also evaluated in Table V, which estimates the performance impact of working-
from-home during and after the experiment.
In Table V, column (1) repeats our baseline results for z-scores. In column (2) we see that the
average z-score rose by 28.4% after the experiment. Once we control for quits by using a balanced
panel in column (3) we find similar increases in performance of 25% for z-scores. In column 4 we
examine instead our direct performance measure, which is the number of phone calls, again
repeating our baseline specification. Column (5) is the key result – the post-experiment effect of
WFH rises to 24.6%, almost double the 13.3% increase in the baseline. Finally, in column (6) we
25
The other three options – “less stress”, “no commuting” and “more flexibility on work time and breaks” – all received
between 10% to 11%, while “other (specify in text box)” was never selected.
26
Treatment group employees who were working at home and wanted to come back to work in the office full-time were
allowed to come back on September 1st, 2011, 2 weeks after the announcement of the roll-out. Control group employees
who wanted to work at home started to do so gradually from the beginning of November 2011.
17You can also read