Natural Gas Infrastructure in India Report by Industry Group For Petroleum & Natural Gas Regulatory Board - "Vision 2030" - PNGRB
←
→
Page content transcription
If your browser does not render page correctly, please read the page content below
“Vision 2030”
    Natural Gas Infrastructure in India

        Report by Industry Group
                   For
Petroleum & Natural Gas Regulatory Board

                     1
Contents

Acknowledgements....................................................................................................................................... 5
Objective of the study and sub‐group participants ...................................................................................... 6
Disclaimer...................................................................................................................................................... 7
1      Executive Summary ............................................................................................................................... 8
2      Natural Gas – Demand/ Supply Dynamics .......................................................................................... 13
    2.1        Present Demand Scenario ........................................................................................................... 13
    2.2        Demand Projections .................................................................................................................... 15
       2.2.1          Approach & Methodology................................................................................................... 17
       2.2.2          Power Sector Demand ........................................................................................................ 18
       2.2.3          Fertilizer Sector Demand .................................................................................................... 23
       2.2.4          CGD Sector Demand............................................................................................................ 25
       2.2.5          Other Consumer Sectors’ Demand ..................................................................................... 27
       2.2.6          Consolidated demand ......................................................................................................... 28
       2.2.7          Regional distribution of demand ........................................................................................ 30
    2.3        Present Supply Scenario.............................................................................................................. 33
    2.4        Supply Projections....................................................................................................................... 33
       2.4.1          Approach & Methodology................................................................................................... 34
       2.4.2          Domestic Production........................................................................................................... 35
       2.4.3          Imports of LNG .................................................................................................................... 36
       2.4.4          Gas Imports through Cross Border Pipelines ...................................................................... 38
       2.4.5          Non Conventional Sources .................................................................................................. 38
       2.4.6          Consolidated supply projections ......................................................................................... 40
    2.5        Demand Supply Balance ............................................................................................................. 42
3      Natural Gas Infrastructure .................................................................................................................. 44
    3.1        Present state of Infrastructure ................................................................................................... 44
    3.2        Infrastructure Projection – Approach & Methodology ............................................................... 46
    3.3        Pipeline Infrastructure – Development Plans ............................................................................. 47
    3.4        Scope for further development .................................................................................................. 52
4      Gas Sector – Current status ................................................................................................................ 55
    4.1        Present State in India .................................................................................................................. 55

                                                                                2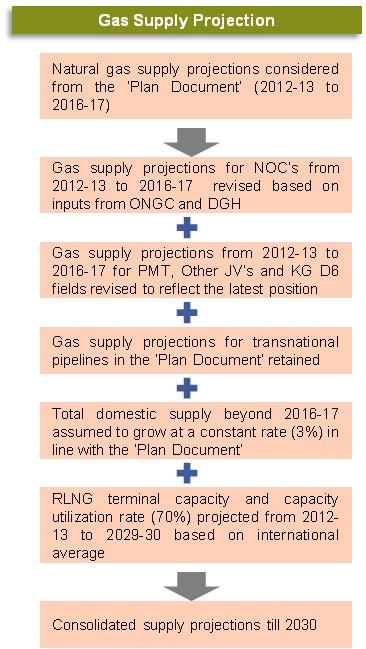
4.2 International Examples ............................................................................................................... 57
4.2.1 USA ...................................................................................................................................... 57
4.2.2 UK ........................................................................................................................................ 59
4.2.3 Market evolution models .................................................................................................... 60
4.3 Focus areas for India ................................................................................................................... 61
4.3.1 Policy Issues ........................................................................................................................ 62
4.3.2 Regulatory Issues ................................................................................................................ 67
4.3.3 Indicative Action Plan.......................................................................................................... 72
FIGURES
Figure 1 Demand Projection Methodology...................................................................................... 17
Figure 2 Region wise gas based power generation capacity (%) ............................................. 19
Figure 3 Gas demand for power sector from 2012-13 to 2029-30 ............................................. 22
Figure 4 Gas demand from fertilizer sector: 2012-13 to 2029-30............................................... 24
Figure 5 Gas demand from CGD sector: 2012-13 to 2029-30 ..................................................... 26
Figure 6 Gas demand from other consuming sectors: 2012-13 to 2029-30............................ 27
Figure 7 Consolidated demand growth trajectory......................................................................... 29
Figure 8 Consolidated Demand - Break up in 2012-13 and 2016-17 ......................................... 29
Figure 9 Consolidated Demand - Break up in 2021-22 and 2029-30 ........................................ 30
Figure 10 Regional markets in India ................................................................................................ 30
Figure 11 Regional contributions to demand ................................................................................ 32
Figure 12 Regional demand growth profiles ................................................................................. 32
Figure 13 Gas supply projection methodology.............................................................................. 34
Figure 14 Natural Gas Supply Growth Profile ............................................................................... 41
Figure 16 Existing gas transmission network in India ................................................................. 46
Figure 17: Gas infrastructure projection methodology ............................................................... 47
Figure 18 Gas transmission network in India at the end of 12th five year plan ..................... 50
Figure 19: Gas transmission network in India at the end of 13th five year plan .................... 51
Figure 20: Infrastructure addition linked to ICF’s NGG proposal and CBM Blocks ............. 52
Figure 21: Natural gas chain (India) .................................................................................................. 56
Figure 22 U.S. Natural Gas Pipeline Network, 2009 ...................................................................... 57
Figure 23 National Transmission System (UK) .............................................................................. 59
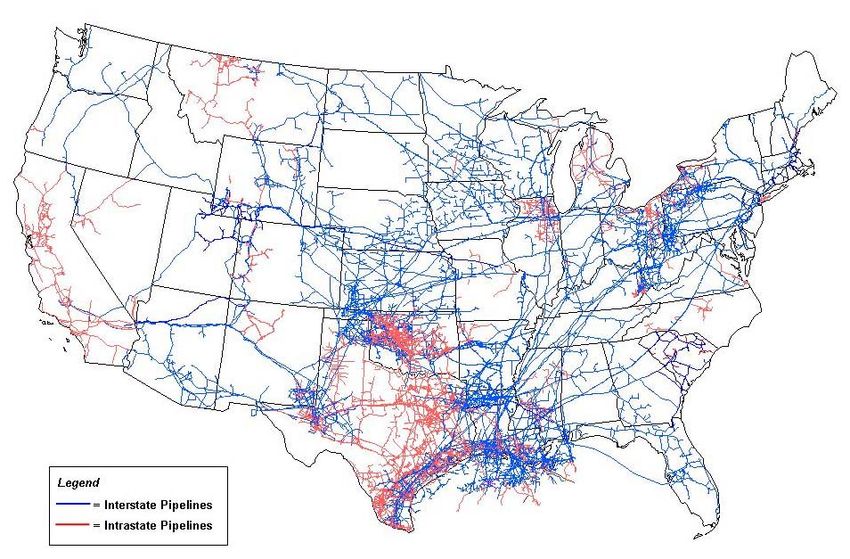
Figure 24 Major structural and market elements for an enabling environment .................... 61
Figure 25 Action plan for development ............................................................................................ 73
TABLES
Table 1 Primary energy mix for India ................................................................................................ 13
Table 2 Sector wise natural gas consumption in India (January 2013) ................................... 14
Table 3 Regional gas markets in India ............................................................................................. 15
3Table 4 Demand drivers for various end user segments ............................................................ 16
Table 5 SUMMARY OF INSTALLED CAPACITY AS ON 31.03.2012 .......................................... 18
Table 6 Gas Demand for Power Projects by End of 12th Plan (2016-17) ............................... 21
Table 7 Power Sector Gas Demand - 12th and 13th five year plan ............................................ 22
Table 8 Power Sector Gas Demand - 2023 to 2030 ...................................................................... 22
Table 9 Fertilizer Sector Gas Demand - 12th and 13th five year plan ........................................ 24
Table 10 Fertilizer Sector Gas Demand - 2023 to 2030 ............................................................... 24
Table 11 Total Realistic Demand - 12th and 13th five year plan ................................................. 28
Table 12 Total Realistic Demand - 2023 to 2030 ............................................................................ 28
Table 13 Regional Markets – Constituent States ........................................................................... 31
Table 14 Regional Demand Distribution .......................................................................................... 31
Table 15 Natural gas availability by source in India ..................................................................... 33
Table 16 Domestic Supply Projections (MMSCMD) ...................................................................... 35
Table 17 Domestic gas availability - 12th and 13th five year plan ............................................... 35
Table 18 Domestic gas availability - 2023 to 2030 ......................................................................... 36
Table 19 Imported LNG - 12th and 13th five year plans ................................................................. 37
Table 20 Imported LNG - 2023 to 2030.............................................................................................. 37
Table 21 Gas availability (cross border pipelines) - 12th and 13th five year plans................. 38
Table 22 Gas availability (cross border pipelines) - 2023 to 2030............................................. 38
Table 23 Total gas availability - 12th and 13th five year plan ....................................................... 41
Table 24 Total gas availability - 2023 to 2030 ................................................................................. 41
Table 25 Natural gas transmission infrastructure in India .......................................................... 44
Table 26 Natural gas transmission infrastructure in India – Regional Distribution ............. 45
Table 27 Pipeline authorizations by MoPNG in 2007 .................................................................... 48
Table 28 Pipeline Authorizations through EOI Route / Pending EOI’s .................................... 48
Table 29 Gas pipelines expected to be commissioned in the 12th five year plan ................. 49
Table 30 Summary – Pipeline infrastructure in 2030 .................................................................... 51
Table 31 Demand-Supply-Capacity from 2022-23 to 2029-30 ..................................................... 53
Table 32 Regional Infrastructure in 2030 ......................................................................................... 54
Table 33 Focus Areas ........................................................................................................................... 62
ANNEXURES
ANNEXURE – I ‐ List of Thermal ( Gas Based ) Power Station as on 31.03.2012
ANNEXURE – II ‐ Gas demand for Future power plants
ANNEXURE – III – Plant wise gas requirement of UREA plants in 2010‐11
ANNEXURE – IV – Demand Projections for UREA plants/ projects from 2012 ‐2030
ANNEXURE – V – Gas consumption by CGD entitis for the year 2010‐11
ANNEXURE – VI – Assumed GA’s for new CGD networks for the period 2016‐17 to 2021‐22
ANNEXURE – VII – Pipeline Development Schedulefor pipelines expanding beyond 13th plan
ANNEXURE – VIII – Pipeline capacity at source ‐ existing and additional
4Acknowledgements
The report on “Vision 2030” – Natural Gas Infrastructure in India was commissioned by the Petroleum
and Natural Gas Regulatory Board (“PNGRB”). The report has benefited tremendously from the
experience of a team of gas sector experts (nominated by entities on request from PNGRB) who invested
their valuable time and also received support from their respective organizations.
The report has relied extensively on secondary sources of data for projecting supply, demand and
pipeline infrastructure which the team would like to acknowledge, without which the basic structure of this
report would not have been possible. The team also would like to especially acknowledge the team
members from CEA, Planning commission, DGH and NFL which provided basic data and support for their
respective areas.
The team was also guided from time to time by Shri S Krishnan, the Chairperson PNGRB, and all its
members and officials on the Vision 2030 work including support on data acquisition from various
agencies. Acknowledgements are also due to Shri R P Watal, IAS, former Secretary PNGRB and Shri
Rajeshwar Rao, OSD, PNGRB for special guidance and critical review of the report.
5Objective of the study and subgroup participants
The PNGRB in its meeting on 22nd November 2011 decided to form a Industry-group for formulating a
Vision 2030 - Natural Gas Infrastructure in India and nominated the companies listed below on the
committee. The key terms for the group included projecting the infrastructure required for development of
gas sector in India, keeping in view the demand and supply of gas, and existing infrastructure in the
country. The terms also included providing suggestions on policy measures to be taken by Government of
India / PNGRB to meet the stated objective of development of gas grid in the country.
The sub-group, chaired by BG India, finalized its report in April 2013 and submitted it to PNGRB in May
2013.
List of nominated member companies / organizations and their representatives
• BG India - Akhil Mehrotra (Chairman)
• BPCL - Shri Vijay Duggal
• CEA - Shri V K Singh
• Directorate General of Hydrocarbons - Shri Sudhir Kumar
• GSPL - Shri Devendra Agarwal
• GAIL - Shri Ajay Kumar Porwal, Shri Anant Khobragade
• HPCL – Shri Deepak Hota, Shri A V Sarma,
• IOCL – Shri D S Nanaware
• Kribhco /NFL – Shri R K Agarwal , Ms Ritu Goswami
• ONGC – Ms Tinku Nischal
• Planning Commission – Shri Rajnath Ram
• PLL - Shri Man Mohan Ahuja
• Reliance – Shri Neeraj Pasricha , Shri Manoj Pandey
• Shell – Shri Anindya Chowdhury
6Disclaimer
This report has been prepared collectively by the committee formed by PNGRB. The contents of the
report do not represent the views, strategy, outlook or circumstances of any of the individual committee
member companies or their representatives. No representation or warranty, express or implied, is or will
be made in relation to the accuracy or completeness of the information in this report and no responsibility
or liability is or will be accepted by any of the companies listed as committee member or any of their
respective subsidiaries, affiliates and associated companies (or by any of their respective officers,
employees or agents) in relation to it.
71 Executive Summary
The Indian economy presently is believed to have established itself on a healthy growth path and this
would increase going forward the energy consumption in the country. This increase in consumption is
expected to be supplemented by an alteration in the primary energy mix of India on account of the
substitution of oil by natural gas. The share of natural gas in the energy mix of India is expected to
increase to 20% in 2025 as compared to 11% in 20101. However, given that all the plans for expansion in
natural gas supply in the country with the help of additional RLNG terminals, nation wide transmission
pipeline network and transnational pipelines are expected to materialize by 2025, it is envisaged that the
share of natural gas in the primary energy mix would reach 20% till 2030 if not more.
In recent years the demand for natural gas in India has increased significantly due to its higher
availability, development of transmission and distribution infrastructure, the savings from the usage of
natural gas in place of alternate fuels, the environment friendly characteristics of natural gas as a fuel and
the overall favourable economics of supplying gas at reasonable prices to end consumers. Power and
Fertilizer sector remain the two biggest contributors to natural gas demand in India and continue to
account for more than 55% of gas consumption. India can be divided into six major regional natural gas
markets namely Northern, Western, Central, Southern, Eastern and North-Eastern market, out of which
the Western and Northern markets currently have the highest consumption due to better pipeline
connectivity. However, with the increasing coverage and reach of natural gas infrastructure in India, this
regional imbalance is expected to get corrected. In future, the natural gas demand is all set to grow
significantly at a CAGR of 6.8% from 242.6 MMSCMD in 2012-13 to 746 MMSCMD in 2029-30. This
demand represents the Realistic Demand 2 for natural gas in India. Gas based power generation is
expected to contribute the highest, in the range of 36% to 47%, to this demand in the projected period
(2012-13 to 2029-30). The share of fertilizer sector in the overall gas consumption in the country is
expected to go down from 25% in FY 2013 to 15% in FY 2030 owing to higher growth in other sectors.
The contribution to the overall demand from the CGD sector is set to increase from 6% to 11% during the
projected period. The demand from CGD sector includes demand for combined heating and cooling
power plants (“CCHP”) from Industries. The consolidated demand for natural gas from 2012-13 to 2019-
30 has been summarized in Table below.
1
As per the ‘Hydrocarbon Vision 2025’ report
2
Realistic demand means the demand estimated after considering limiting factors that are likely to restrict growth
in demand.
8Table: Consolidated segment wise demand for natural gas from 2012-13 to 2029-10
MMSCMD 2012-13 2016-17 2021-22 2026-27 2029-30
Power
86.50 158.88 238.88 308.88 353.88
Fertilizer
59.86 96.85 107.85 110.05 110.05
City Gas
15.30 22.32 46.25 67.96 85.61
Industrial
20.00 27.00 37.00 52.06 63.91
Petchem/Refineries/Internal Cons.
54.0 65.01 81.99 103.41 118.85
Sponge Iron/Steel
7.00 8.00 10.00 12.19 13.73
Total Realistic Demand
242.66 378.06 516.97 654.55 746.03
The supply of natural gas is likely to increase in future with the help of increase in domestic gas
production and imported LNG. However, the expected increase in domestic production at present is
significantly lower than earlier projections due to a steady reduction in gas output from the KG D6 field.
The capacity of RLNG terminals in India is expected to increase from 17.3 MMTPA in 2012-13 to 83
MMTPA in 2029-30 assuming all the existing and planned terminals in India would materialize. Natural
gas availability through non-conventional sources like Shale Gas and Gas Hydrates has not been
considered in gas supply projections in the absence of clarity on key variables like data as most of India
remains unexplored/underexplored, regulatory policy and lack of domestic infrastructure. The total
supply of natural gas is expected to grow at a CAGR of 7.2% from 2012 to 2030 reaching 400
MMSCMD by 2021-22 and 474 MMSCMD by 2029-30. The supply profile for the projected period
has been provided in Table below.
Table: Consolidated source wise supply of natural gas from 2012-13 to 2029-30
MMSCMD 2012-13 2016-17 2021-22 2026-27 2029-30
Domestic Sources 101.1 156.7 182 211 230
LNG Imports 44.6 143.0 188 214 214
Gas Imports (Cross border Pipelines) 0.0 0.0 30.0* 30.0 30.0
Total 145.7 299.7 400 454 474
* TAPI pipeline projected to get commissioned in 2017-18
The above projections for 2012-13 from domestic sources have gone down to circa 85mmscmd as of
January 2013 primarily due to steady reduction in supply from KGD6 fields, which could get backfilled by
other sources like RLNG in the interim.
9The availability of natural gas in India is expected to fall short of the total natural gas demand by around
97 MMSCMD in 2012-13. However, this shortfall will reduce by 2017-18 due to substantial addition in
regasification capacity and natural gas supply through cross border pipeline (TAPI). The demand-supply
gap is likely to again increase post 2017-18 and reach about 272 MMSCMD by 2029-30 as increase in
supply lag behind a steady increase in demand. The demand-supply gap that is likely to prevail over the
projected period has been depicted in the graph below.
Figure: Demand Supply balance of natural gas from 2012-13 to 2029-30
800
700
600 272
247
223
200
178
156
500 135
114
117
mmscmd
96
76
400 54
42
78
300 82
94
98
200 97
100
0
Demand Supply Balance Total Supply Total Demand
India, currently, has a network of about 13,000 km of natural gas transmission pipelines with a design
capacity of around 337 MMSCMD. This pipeline network is expected to expand to around 28,000 Kms
with a total design capacity of around 721 MMSCMD in next 5-6 years, putting in place most of the
National Gas Grid that would connect all major demand and supply centre in India. This would ensure
wider availability across all regions and also potentially help to achieve uniform economic and social
progress. A summary of planned additions to the natural gas infrastructure in India during the projected
period has been provided in the Table below.
10Table: Summary of Planned additions to pipeline infrastructure
Design Capacity
Pipelines (mmscmd) Length (Kms)
Existing till 2012 306 12144
Expected addition in the 12th plan 416 15928
Expected addition in the 13th plan 60 3360
Capacity addition MBBVPL/MBPL/Surat
Paradip/pipelines beyond 13th plan & till 2030 33 1295
Total 815 32,727
The design capacity of pipeline network in India is expected to reach 815 MMSCMD in 2029-30.
However, considering the addition of capacity directly linked to the existing/planned sources of natural
gas in the country, the gas grid capacity in India (pipeline emanating from source) is expected to reach
582 MMSCMD in 2029-30 from the present 274 MMSCMD. This capacity is expected to take care of the
natural gas supply scenario in the projected period. In addition to the trunk lines regional gas pipelines,
similar to the intra-state network of Gujarat, are recommended for highly industrialized states. It is
expected that going forward the Southern and Northern part of India would catch-up with the Western part
in terms of pipeline infrastructure while Eastern and North Eastern part of the country would lag behind
and would require policy boost for industrial development to attract more investments.
Today, the natural gas sector is at the threshold of rapid growth in India supported by ever increasing
demand for natural gas in the country, increased exploration efforts under NELP, commissioning of the
LNG import terminals in the West Coast, projected upcoming LNG terminals and the Government’s
initiatives in the direction of development of a nation wide natural gas pipeline grid. However, there is a
need to provide a proactive enabling environment to support the fast-paced development of natural gas
infrastructure. An enabling environment includes providing desired policy support and the correct pricing
signals for investment in the sector, reforming the present set of regulations to adopt to changing needs
and making them more robust and addressing the distortions in the fiscal regime applicable for natural
gas.
The Government of India (“GoI”) currently allocates gas produced domestically as per Gas Utilization
policy. This creates artificial demand and discourages new suppliers and hence need to be progressively
removed. A free market without compromising the long term objectives of the nation would be a more
prudent approach. The aim of the gas policy should be to attract investments and develop gas markets
Policy initiative should be taken to facilitate development of a market for gas through initiatives like
developing trading hubs and trading platform to discover prices and thereby creating sufficient depth in
the Indian natural gas market. This would help more investment find its way into the hydrocarbon
exploration and infrastructure sector and ensure efficient usage of the infrastructure.
11To meet the growing demand for gas GoI need to achieve the objective of attracting investments in the
upstream and midstream gas sector. Key to this would be sending the right price signals which could be
achieved by reforms in the power and fertilizer sector (main consumers of gas) to increase their
affordability. The government should also evaluate alternatives to the present differential tax regime for
gas which is hindering free movement and swaps.
Certain regulatory reforms remain critical to the development and efficient usage of natural gas
infrastructure In India. A fair and transparent access to the pipeline infrastructure is a key for movement of
gas volumes. Currently the regulations provide for open access and have mandated accounting
separation between transportation and marketing activities. To further develop the market the regulator
should unbundle (legal unbundling) the marketing and transportation activities in next 2-3 years time. This
would prevent restrictions imposed by pipeline companies through non-price measures on competition.
Post legal unbundling the timing of ownership separation can be determined by the regulator based on
factors like transparency adopted by transportation companies in dealing with their trading affiliates,
number of shippers in the business and the choice exercised by consumers.
In addition to unbundling, in order to facilitate pipeline infrastructure sharing there is a need for a robust
open access code for the natural gas pipelines. Establishment of a market for natural gas transportation
would promote transparent and fair pricing of transportation service. A switch to a suitable tariff system
like the ‘Entry Exit system or a hybrid system, which encourages competition in the market as well as
provide services to the customers at the reasonable tariff, particularly to customers at geographically
disadvantageous locations, with due customization keeping in view the multi-ownership, tax systems, etc
from the present Zonal tariff system should be considered. The development and usage of bulletin boards
would facilitate gas trading and pipeline capacity trading by providing system and market information.
Constituting a independent Pipeline System Operator (PSO) once major pipelines are build is expected to
streamline tariff-sharing among various pipeline system owners.
Overall the gas sector in India has shown modest growth in the past. Substantial investment in
infrastructure relating to import of LNG and transportation of domestic gas across India is planned for the
next 5-6 years. The current planned investments along with incremental investments in future would be
sufficient to meet the growing demand for gas from various consumers segments. In order to ensure the
projects get implemented on a fast tract basis, GoI and PNGRB need to take various policy and
regulatory measures as suggested in the report. This would help sustain higher investments in the gas
chain including exploration leading to a sustained and healthy growth of the sector, ensuring that the
share of gas is at least 20% in the primary energy mix by 2030.
122 Natural Gas – Demand/ Supply Dynamics
The Indian economy has been projected to achieve an average real GDP growth of 6.4% during 2008-
20353. Energy availability is key to economic growth and therefore, going forward high economic growth
would lead to increase in the energy consumption of the country. The primary energy mix of India is also
set to alter on account of the substitution of oil by natural gas. The share of natural gas in the energy mix
is expected to increase to 20% in 2025 and beyond as compared to 11% in 20104. The expected change
in the primary energy basket for India in 2010 and 2025 has been presented in Table 1. Based on the
plans for expansion in natural gas supply in the country with the help of additional RLNG terminals, nation
wide transmission pipeline network and transnational pipelines expected to materialize in next 5 to 10
years, it is envisaged that the share of natural gas in the primary energy mix would reach 20% till 2030.
However to achieve a 20% share of natural gas in the primary energy it is required to attract and sustain
investments in the gas infrastructure including the cross country pipelines.
Table 1 Primary energy mix for India
Source 2010 2025
Coal 53% 50%
Oil 30% 25%
Gas 11% 20%
Hydro 5% 2%
Nuclear 1% 3%
100% 100%
Historically, natural gas was significantly cheaper than alternate fuels like motor spirit, naphtha, diesel
and LSHS/FO. Although the price of natural gas is steadily increasing (especially of imported gas), newer
technology and larger plants have now made it possible to ensure efficiency and economies of scale
enabling increase in usage of natural gas. Therefore natural gas has now become the preferred fuel for
fertilizers, petrochemicals and has made inroads into power generation segment. Further, planned
investments in the power, fertilizer, petrochemical and other areas including City Gas Distribution suggest
a sustained increase in the level of natural gas consumption in the country.
2.1 Present Demand Scenario
Natural Gas demand has increased significantly in recent years due to the increase in the availability of
gas, development of transmission and distribution infrastructure, the savings from the usage of natural
3
As per International Energy Agency (IEA) –world energy outlook 2010 report
4
As per Hydrocarbon Vision 2025 report
13gas in place of alternate fuels and the overall favourable economics of supplying gas at reasonable prices
to end consumers. It has become easier for the power, fertilizer and CGD sectors, as well as industrial
and commercial establishments, to switch over to natural gas for their energy requirements. In the near
future power and fertilizer sectors are expected to remain the anchor segments for natural gas demand in
India. Going forward though, with the additional supply of gas significant demand for natural gas is also
expected to come from the industrial (usage both in process and power generation - cogeneration) and
CGD segments.
The total consumption of natural gas was 127 mmscmd (January 2013) with power and fertilizer sectors
consuming 36 and 39 mmscmd of gas respectively. While power sector consumption accounted for 28%
of the total natural gas consumption in India, the fertilizer sector consumption accounted for 31% of the
total consumption. The sector wise consumption has been presented in Table 2.
Table 2 Sector wise natural gas consumption in India (January 2013)
Sector Domestic Gas RLNG Total % of total supply
Consumption
Power 30.36 5.80 36.2 28%
Fertilizers 31.02 8.37 39.4 31%
CGD/CNG 6.69 7.28 14.0 11%
Court Mandated Customers 0.98 2.89 3.9 3%
Shrinkage for liquid 6.02 0.37 6.4 5%
extraction - LPG etc.
Refineries 2.07 8.62 10.7 8%
Petrochemicals 3.5 1.37 4.9 4%
Sponge Iron/Steel 1.11 3.49 4.6 4%
Small consumers (Table 3 Regional gas markets in India
% of States with infrastructure States lacking pipeline
Region consumption and consuming gas infrastructure
Western 53% Gujarat, Maharashtra Goa
Punjab, J&K, Himachal
Northern 26% Delhi, UP, Haryana, Rajasthan Pradesh, Uttarakhand
Central 3% Madhya Pradesh Chattisgarh
Southern 14% Tamil Nadu, Andhra Pradesh Kerala, Karnataka
Bihar, West Bengal,
Eastern NIL - Jharkhand, Orissa
Meghalaya, Sikkim,
Arunachal Pradesh,
North Mizoram, Manipur,
Eastern 4% Assam, Tripura Nagaland
Source - Saumitra Chaudhuri report on Policy for pooling of natural gas prices and pool operating guidelines
At present, natural gas markets remain mostly limited to the states where gas sources have been found.
States closer to the gas source or having pipeline infrastructure (HVJ pipeline) have had the benefits of
higher availability of gas and local development of gas market e.g. Gujarat, Maharashtra, Northern
markets, Andhra Pradesh, etc. Other states like Punjab, Haryana, Jharkhand, Uttarakhand, Karnataka,
Kerala, Bihar, Chattishgarh, etc. have not been able to utilize benefits of gas due to lower gas availability
and inadequate pipeline infrastructure.
2.2 Demand Projections
The Power, Fertilizer, Industrial and CGD segments are expected to contribute to the bulk of future
growth of natural gas demand in India. Natural gas demand from the power sector is expected to be
driven, not only by the shortage of domestic coal supply and the rising cost of its substitute i.e. imported
coal but also by increased domestic gas supply and power sector reforms. Fertilizer industry is the only
industry that uses chemical and thermal heat of gas for its production and remains a major contributor to
the natural gas demand in the country. A higher emphasis on food security in India and increasing import
price of urea are expected to drive the demand from the fertilizer sector. Rising price of crude oil/Naptha
was one of the drivers for the rising gas demand from Fertilizer units and is also expected to remain one
of the drivers from Industrial users as the price of the alternate fuels (Naphtha/FO) used by them is linked
to crude oil. Focus on the reduction of subsidy burden by GoI is further expected to pull the demand from
the Fertilizer units in the country. The process of addressing environmental concerns is expected to drive
the demand of natural gas from the industrial users as well as Compressed Natural Gas (CNG) users in
the CGD segment. Factors like availability of domestic gas, import of LNG and development of requisite
infrastructure are also expected to push the growth of natural gas demand from the CGD user segment.
The key demand drivers for key user segments have been summarized in Table 4.
15Table 4 Demand drivers for various end user segments
Sector Demand Drivers
Power Sector 9 Rising cost of imported coal
9 Constrained domestic coal supply
9 Supply of domestic gas
9 Power sector reforms
9 Fast-growing economy
Fertilizer Sector 9 Greater emphasis on Food Security
9 Increase in import price of Urea
9 Rising price of crude oil
9 Subsidy burden
9 Conducive Govt. Policy for new investment in
urea manufacturing units
Industrial User Segment 9 Rising price of crude oil
9 Environmental concerns
City Gas Distribution 9 Environmental concerns
9 Subsidy burden
9 Enabling policy framework
9 Supply of domestic gas
9 Availability of affordable RLNG
9 Requisite infrastructure
9 GDP / Household income
In terms of the sensitivity of demand to natural gas price the demand arising from the power and fertilizer
sectors is expected to remain highly sensitive to the price at which the entities in these sectors are able to
procure gas due to the issues around affordability by end consumers of basic food products and
electricity. However, the demand from other consuming sectors is expected to remain relatively resistant
to the price levels at which gas becomes available.
162.2.1 Approach & Methodology
Demand projection has been done from the year 2012-13 to 2029-30 using the ‘Plan Document’ as the
main reference. Projection of potential demand for different consumer categories provided in the Plan
Document from 2012-13 to 2021-22 have been analyzed and then refined ( based on current and planned
investment in the user segments), where ever required, in order to project the most likely demand
scenario till the end of the 13th five year plan. These refined projections have then been used to project
demand from 2022-23 till 2029-30 with the help of assumptions derived from various inputs from industry.
The natural gas demand projected from 2012-13 to 2029-30 represents ‘Realistic Demand’ of natural
gas that takes into account the restrictions posed by the limiting factors including the delayed
commissioning of end use infrastructure e.g. power and fertilizer plants, the lack of policy directives in end
user segments, slow pace of regulatory reforms in natural gas sector as well as consumer segments and
unviable economics of end use projects.
The approach and methodology adopted for projecting demand from 2012-13 and 2029-30 has been
summarized in Figure 1.
Figure 1 Demand Projection Methodology
Gas Demand Projection
Natural gas demand projections
considered from the ‘Plan Document’
( 2012-13 to 2021-22)
Demand projections refined for Power,
Fertilizer, CGD and Petchem /Refining
sectors to project most realistic demand
scenario based on inputs from industry
players and GoI.
Sectoral demand growth rate beyond
2021-22 assumed (where ever required)
based on assumptions used in the ‘Plan
Document’ and industry inputs
No constraints considered in terms of
Natural gas price
Natural gas supply
Natural gas infrastructure
Regional distribution of demand projected
based on ICF report on national gas grid
Consolidated demand projections till 2030
17The sectoral demand projected till 2030 as per the above methodology has been discussed in detail in
the following sub sections.
2.2.2 Power Sector Demand
Power sector has been the biggest consumer of natural gas in India in the past and is expected to remain
so going into the future. However, the future demand for natural gas from the sector is likely to be
constrained by the ability of the power plants to pay for a higher fuel expense, reduced availability of
domestic gas supply and power sector reforms.
Gas contributes to about 10% of power generation in India. Gas based power generation is constrained
by the higher cost of gas as a fuel and its availability across all the regions. In recent years the Plant Load
Factor (PLF) of gas based power plants has dropped to around 50% due to lack of natural gas availability
at affordable prices. Natural gas demand for gas based power generation remains highly price sensitive
and it is expected to fall drastically at a price in excess of $8-$9/MMBTU. In future, the ability of power
sector to absorb higher priced RLNG is likely to increase with the help of power sector reforms linked to
periodic tariff revisions, peaking power regulation, time-of-day tariff, robust open access norms etc. The
shortage in natural gas supply has hampered the capacity addition and performance of the existing
plants. Allocation of domestic gas to power sector will remain constrained due to competing demand
pressures from the fertilizer and petrochemical sectors.
Power sector consumed around 36.2 MMSCMD of gas (January 2013) which was 28% of total gas
consumption in India. The total Installed Generation Capacity in the country by the end of 11th Plan (as
on 31.03.2012) is 1,99,877 MW comprising 38,990 MW Hydro, 1,31,603 MW Thermal (including 18,381
MW from gas), 4,780 MW nuclear based power plants and 24,503 MW from renewable energy sources
including wind. The region-wise and fuel-wise details of installed capacity in India as on 31st March 2012
is provided in Table 5:
Table 5 SUMMARY OF INSTALLED CAPACITY AS ON 31.03.2012
Nuc-
Thermal Rest Total
REGION Hydro lear
Steam * Gas Diesel Total
NORTHERN 15,123 28,358 4,421 13 32792 1,620 4,391 53,926
WESTERN 7,447 38,924 8,255 18 47,197 1,840 7,910 64,394
SOUTHERN 11,338 22,882 4,691 939 28,513 1,320 11,569 52,740
EASTERN 3,882 21,798 190 17 22,005 - 399 26,286
N-EASTERN 1,220 60 824 142 1,026 - 228 2,454
ISLANDS 0 - - 70 70 - 6 76
ALL INDIA 38,990 1,12,022 18,381 1,200 1,31,603 4,780 24,503 1,99,877
% OF TOTAL 19.4 56.4 9.1 0.5 66.0 2.4 12.1 100
* Generated with coal as fuel
18The power generation capacity based on gas in India stands highly concentrated in the western region.
The region accounts for 45% of the total gas based power capacity. Northern and Southern regions of the
country contribute about 25% to the total power generation based on gas. The region wise break up of
total gas based power generation capacity in India as of 31 March, 2012 has been provided in Figure 2.
Figure 2 Region wise gas based power generation capacity (%)
4%
1%
24%
26%
45%
NORTHERN WESTERN SOUTHERN EASTERN N‐EASTERN
The total gas demand for existing (as on 31st March 2012) gas based generating capacity of 18381 MW
5
(Annexure I) at 90% PLF works out to be about 88 MMSCMD . However, average gas
supply/consumption during 2011-12 for these power projects was only about 56 MMSCMD (including
RLNG), primarily due to lesser production/availability of gas in the country. In light of the reduced
production of KG basin and the likely availability of gas during 12th Plan from other sources, it may be
difficult to make available gas to power projects for operation at 90% PLF and therefore natural gas
supply for the capacity existing in the country has been considered at 68.4 MMSCMD (70-75% PLF) in
this report.
In order to meet the increasing demand for electricity and to reduce the CO2 emissions, a substantial gas
based capacity is desirable. Besides being environmentally benign, the gas projects have high efficiency,
have benefit of low gestation period, and require less land and water. Coal based stations have a long
gestation period and also the domestic coal production is not keeping pace with the requirements of the
power sector. Thus, promotion of gas based generating capacity in the country is essential. Keeping in
view the requirement and the increasing shortage of coal during the 12th plan period, there is an urgent
need to plan for additional gas based capacity to the tune of 25000 MW. This additional Gas Turbine (GT)
capacity will help in reduction of our Greenhouse Gas (GHG) emissions and meeting the shortfall which is
expected due to delay in commissioning of the ongoing thermal and hydro projects. Central Electricity
Authority (CEA) has received applications for allocation of gas for about 1,30,000 MW capacity from
5
Assuming 4.8MMSCMD for 100 MW at 90% PLF
19various states, Central Public Sector Undertaking’s(CPSU’s) and Independent Power Producers (IPPS)
for which about 600 MMSCMD gas is required. Out of these proposed projects, many projects can be
commissioned within next 2-3 years provided gas is made available. However, considering ground reality
of reduced gas availability in the country, it is difficult to presently plan for 25,000 MW gas based
generation capacity addition during the 12th Plan.
In view of above, during the 12th plan period gas capacity of only 2539 MW (comprising 1452 MW
slipped capacity from 11th Plan and 1087 MW for which gas is proposed from local sources) has been
considered. The gas requirement for these projects (Annexure II-(A)) is expected to be 9.47 MMSCMD.
In addition to above, many gas based power projects in private sector are under advance stage of
construction and awaiting gas supply for testing/commissioning and commercial operation. Some of these
projects were expected to be commissioning during the 11th Plan, if timely gas was made available.
However, these projects can be commissioned during 2013-14 if gas is made available. All these
projects (Annexure II-(B)) would require 28.56 MMSCMD. There are a few other projects for which
orders have been placed and are under construction/ construction delayed due to uncertainty of gas
availability. These projects (Annexure II-(C)) can also be commissioned during 12th Plan if gas
availability is ensured and would require around 16 MMSCMD gas. Ministry of Power has also
recommended for allocation of gas to certain projects (Annexure II-(D)) in State Sector, targeted for
commissioning during 12th Plan, if gas availability is assured. A gas requirement of about 24 MMSCMD
exists on account of these projects.
Also, it is proposed that during the 12th plan period at least 2000 MW gas based peaking power plants
and 2000 MW CCHP plants having higher efficiency above 70 % should be promoted. The combined
requirement of these plants would be about 12 MMSCMD (4 MMSCMD for peaking plants & 8 MMSCMD
for CCHP plants). These plants can be commissioned within a short span of about 2-3 year subject to gas
availability & policy reforms to promote peaking and CCHP plants.
Considering the gas requirement for power sector discussed above, the total gas demand of
power projects by the end of 12th Plan (2016-17) works out to be about 199 MMSCMD
(corresponding to 90% PLF ) and 159 MMSCMD if gas is made available at lower PLF of 75%/70%
for projects. Keeping in view the reduced production of KG basin and likely availability of gas during 12th
Plan from other sources, it is felt that it may be difficult to make available gas to power projects for
operation at 90% PLF. Therefore a demand of 157 MMSCMD at 75% PLF in 2016-17, which appears to
be more realistic for power sector, has been considered in this report. The break up of demand for natural
gas for power sector in the 12th five year plan has been provided in the Table 6.
20Table 6 Gas Demand for Power Projects by End of 12th Plan (2016-17)
Gas Demand at
Gas Demand at
S.No Project Category Capacity (MW) 90% PLF
75%/70% PLF
(MMSCMD)
(MMSCMD)
1 Existing Projects 18381.05 88.00 68.4
th
(end of 11 Plan as
on 31.03.2012)
Incremental Demand
2 for 12th Plan Projects
A: Planned Projects
for 12th Plan (Under
Construction/ Partly
commissioned) 2538.60 12.20 9.47
B: Projects Under
Advanced Stage of
Construction (Ready
for commissioning) 7346.5 35.34 28.57
C: Projects with
delayed construction
due to non availability
of gas 4201 20.16 16.18
D: Gas Requirement
of power projects
Recommended by
Ministry of Power 6450 30.96 24.26
E: Gas Requirement
for Peaking & CCHP 4000 12 12
plants **
Sub-Total (12th Plan
Demand) 24536.1 110.66 90.48
th
Total (End of 12
3 plan i.e 2016-17) 42917 198.66 158.88
** Considering daily operation of peaking plants for 5-6 hrs and CCHP operation at 75% PLF
The additional requirement in the generation capacity beyond 12th Plan is yet to be ascertained,
however keeping in view the growing demand for power in the country, it may be assumed that about
90,000 - 1, 00,000 MW incremental capacity would be required during each Five year plan beyond 12th
Plan out of which about 20,000 MW would be gas based capacity (given the low carbon growth strategy
of the country), during each 13th, 14th & 15th Plans. An incremental gas demand of about 75 MMSCMD
corresponding to 20,000 MW capacity has thus been assumed during each Plan beyond 12th plan till
year 2030. It should be noted however that actual demand of natural gas for power sector would depend
upon gas pricing, gas availability, power sector reforms and actual gas based capacity addition planned
during each subsequent plan.
21Natural gas demand for gas based power generation projected for the period 2012-13 to 2029-30 has
been provided in Table 7 and Table 8. The demand for gas for gas based power generation is expected
to grow at a CAGR of 8.6% over the projection period i.e. from 2012-13 to 2029-30.
Table 7 Power Sector Gas Demand - 12th and 13th five year plan
12th plan 13th plan
MMSCMD 2012-13 2013-14 2014-15 2015-16 2016-17 2017-18 2018-19 2019-20 2020-21 2021-22
Power
sector 86.50 104.59 122.69 140.78 158.88 173.88 188.88 203.88 218.88 233.88
demand
Table 8 Power Sector Gas Demand - 2023 to 2030
MMSCMD 2022-23 2023-24 2024-25 2025-26 2026-27 2027-28 2028-29 2029-30
Power sector demand 248.88 263.88 278.88 293.88 308.88 323.88 338.88 353.88
The year-on-year addition in natural gas demand for power sector has also been shown in Figure
3. An overall addition of 285 MMSCMD is expected to happen over the projection period, taking
the total demand to 353.8 MMSCMD in 2029-30.
Figure 3 Gas demand for power sector from 2012-13 to 2029-30
400.00
285.5
350.00 270.5
255.5
240.5
225.5
300.00
210.5
195.5
180.5
250.00 165.5
150.5
MMSCMD
135.5
200.00 120.5
105.5
90.5
150.00 72.4
54.3
36.2
100.00 18.1
68.4
50.00
0.00
Base demand Additional demand
222.2.3 Fertilizer Sector Demand
Fertilizer sector currently is the top priority gas user segment under the domestic gas allocation policy.
The sector consumed around 31% of total gas consumption in the country which is the highest in the list
of the biggest gas consuming sectors.
The fertilizer industry (Nitrogen based plants that consume gas) is regulated by the Ministry of Fertilizer,
GoI and its policies administer the production as well as price of fertilizer. Today, there are around 31
plants in India engaged in the manufacturing of urea. These plants have been categorized on the basis of
usage of various feed stocks used in urea production like natural gas, naphtha and fuel oil / LSHS. In
2010-11 the total gas requirement of urea plants (Annexure - III) in the country stood at 43 MMSCMD.
Switch over of plants (Annexure – IV (A)) based on substitute feedstock to natural gas is estimated to
generate an additional annual demand of 10-15 MMSCMD [out of which circa 4 mmscmd arising out of
switchover of fuel oil based plants is urgently required as huge investments have already been made for
these projects and these projects cannot shift to fuel oil /LSHS once converted to gas] and the revival of
closed urea units (Annexure – IV (B)) is expected to require annually another 14-15 MMSCMD , from
2012-13 to 2029-30. Planned expansions (Annexure – IV(C)) of existing urea units and Greenfield urea
projects (Annexure – IV (D)) that are at various stages of implementation and are awaiting favourable
fertilizer policy are also expected to contribute to the natural gas demand in future.
For projecting demand from 2012-13 to 2029-30, the gas requirement of 43 MMSCMD in 2010-11 has
been considered as the base demand. Annual addition in demand over and above this demand has been
estimated based on the gas requirement for the list of Revamp projects (Annexure – IV(E)), Naphtha
based plants, Fuel oil plants, planned expansions, closed units and Greenfield projects as provided in the
‘Plan Document’. However, the phasing of gas requirement against the revival of closed units, expansion
units and Greenfield projects has been adjusted to account for the ‘on-the-ground’ progress of revival,
expansion or commissioning of plants. It is important to note here that for the estimation of annual
addition in demand, constraints linked to affordable pricing, gas infrastructure and gas supply have not
been taken into consideration. The demand for this user segment is highly price sensitive in nature and
would depend on the affordable gas price as per the new fertilizer policy of Government of India.
In the long term, demand for fertilizer sector is expected to reach 97 MMSCMD by 2016-17 and 108
MMSCMD by 2021-2022. Future gas demand projection for fertilizer sector is provided in Table 9 and
Table10.
23Table 9 Fertilizer Sector Gas Demand - 12th and 13th five year plan
12th plan 13th plan
MMSCMD 2012-13 2013-14 2014-15 2015-16 2016-17 2017-18 2018-19 2019-20 2020-21 2021-22
Fertilizer sector
59.86 59.96 60.39 72.09 96.85 103.45 105.65 105.65 105.65 107.85
demand
Table 10 Fertilizer Sector Gas Demand - 2023 to 2030
MMSCMD 2022-23 2023-24 2024-25 2025-26 2026-27 2027-28 2028-29 2029-30
Fertilizer sector
110.05 110.05 110.05 110.05 110.05 110.05 110.05 110.05
demand
Post 2022-23, no further addition in demand is anticipated till 2030, but the same may change based
upon the drivers elaborated in Table 4.
Figure 4 Gas demand from fertilizer sector: 2012-13 to 2029-30
120.00
110 110 110 110 110 110 110 110
110.00 108
106 106 106
103
100.00 97
90.00
MMSCMD
80.00
72
70.00
60 60 60
60.00
50.00
40.00
242.2.4 CGD Sector Demand
City Gas Distribution (CGD) sector in India has seen rapid growth in recent years and consumes approx.
13.6 MMSCMD (Annexure – V) of natural gas. There are 15.22 lakh domestic connections, 10,631
commercial customers and 2974 industrial customers at present in India. In the City Transport Sector,
there are presently around 588 CNG filling stations servicing around 1.2 million vehicles6.
CGD sector has relatively high affordability and has the capacity to absorb prices of gas higher than
power and fertilizer sectors. Usage of natural gas has proved to be economical vis-a-vis competing fuels
for most of the user segments within the CGD space. Natural gas demand for CGD sector is expected to
rise steadily due to the addition of gas networks in new cities, price advantage of CNG and increased use
of PNG in domestic, industrial and commercial sectors. Environmental concerns will further push the use
of natural gas especially in the automotive and industrial segment (coal replacement).
For projecting the natural gas demand for this user segment a base demand of 13.6 MMSCMD has been
considered in 2010-11 which takes into account the gas consumption by all the existing CGD entities in
India. The cumulative sales volumes for three major CGD players IGL, MGL and GGCL grew at around
8%-9% form 2007 to 2011. However, this rate of growth is expected to slow down as the existing
businesses become mature on higher base effect. Therefore, the natural gas demand from the existing
CGD entities has been assumed to grow at a rate 20%-30% lower than their growth rate in the past five
years till the end of 13th five year plan.
Additional CGD network has been assumed to be set up in ten Geographical Areas (GA) (Annexure – VI)
every year from 2016-17 till the end of the 13th five year plan, considering that out of more than 240 GA’s
that are planned to have a CGD network, the most feasible 60 GA’s would have a CGD network by 2021-
22. The feasibility of a GA has been broadly assessed based on its population (more than 0.2 million) and
its proximity to an existing or a planned transmission pipeline. Natural gas demand of 0.3 MMSCMD has
been assumed for each of the 60 GAs in the first year of operation based on the experience of the
existing CGD networks. This demand has been assumed to grow at an annual rate of 5% considering that
the new CGD networks would have significantly lower demand to capture (due to high cost RLNG to be
used by CGD’s) when compared to the already established CGD.
Post 13th five year plan it has been assumed that the total demand for the CGD sector i.e. the demand
considering the CGD networks that exist today as well as those that would be setup till the end of 13th five
year plan, assumed to grow at a rate of 8% annually. The total demand from CGD sector is expected to
grow from 15.3 MMSCMD in 2012-13 to 85.6 MMSCMD in 2029-30 at a CAGR of 10.7%.
6
All figures as per Plan Document
25The cumulative year on year demand from 2012-13 to 2029-30 from CGD segment has been shown in
Figure 5.
Figure 5 Gas demand from CGD sector: 2012-13 to 2029-30
90.00
85.6
80.00 79.3
73.4
70.00 68.0
62.9
60.00 58.3
54.0
50.0
MMSCMD
50.00 46.3
41.0
40.00 35.9
31.2
30.00 26.6
22.3
20.00 18.2
15.3 16.2 17.2
10.00
0.00
Total projected demand
The above demand from the CGD sector includes demand from the Combined Heat and Power plants
which contract gas from the city gas companies operating in their area. Efforts are required to encourage
generation of power through these CCHP which are more efficient than centralized CCGT’s due to higher
efficiency (as high as 85%), low transmission losses, lower physical vulnerability and low gestation period.
26You can also read