Road Transport in the People's Republic of China - IRU
←
→
Page content transcription
If your browser does not render page correctly, please read the page content below
Road Transport in the
People’s Republic of China
Road Transport
in the People’s Republic of China

              December 2009

                 Geneva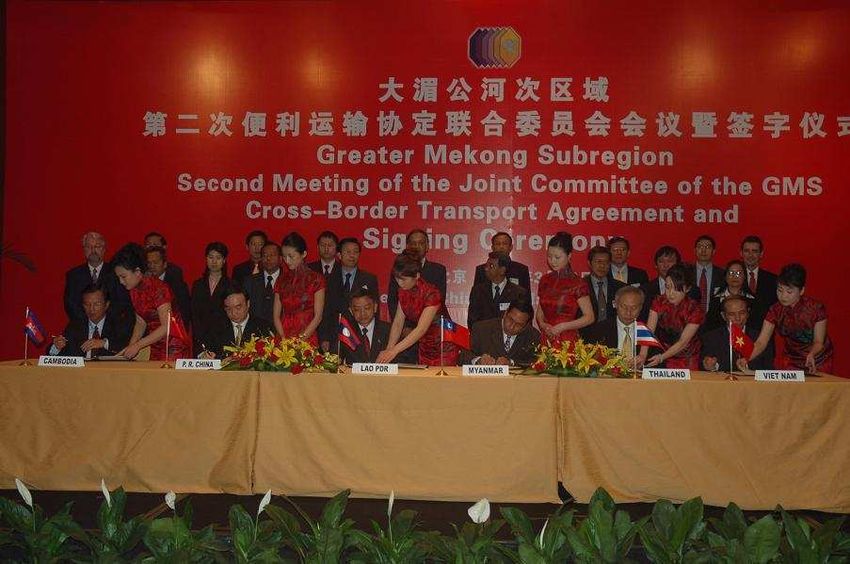
CONTENTS

Preface                                                                                   1
Chapter One: General Introduction                                                         2
1.1 Comprehensive Transport System                                                        4
1.2 Highway Infrastructure                                                                6
1.3 Transport Capacity Development                                                        9
Chapter Two: Road Transport Activities                                                    14
2.1 Road Passenger Transport                                                              15
2.2 Road Freight Transport                                                                18
2.3 Average Transport Distance                                                            20
2.4 Fuel Consumption                                                                      21
2.5 Road Transport’s Contribution to the GDP                                              22
Chapter Three: The Legal System                                                           24
3.1 General Introduction                                                                  24
3.2 Road Transport Ordinance (RTO)                                                        25
3.3 Key Regulations under RTO                                                             26
3.4 Criterion Documents                                                                   29
3.5 Industrial Standards                                                                  32
3.6 Vehicle Technical Regulations                                                         35
3.7 Effect of Market Management under the Regulations                                     38
3.8 Fiscal Regulations                                                                    39
3.9 Road Safety Regulations                                                               39
3.10 Staff Social Provisions                                                              40
Chapter Four: International Road Transport                                                42
4.1 International Road Transport Volume                                                   44
4.2 International Road Transport Enterprises                                              45
4.3 International Road Transport Vehicles                                                 47
4.4 International Vehicle Transport Agreements                                            48
4.5 Important Areas of International Road Transport                                       48
4.6 Measures adopted in International Road Transport                                      49
4.7 Conventions and Multilateral Agreements Covering International Road Transport         49
4.8 Major Road Border Crossing Points                                                     55
Chapter Five: Thematic Section One: Road Safety - International Comparison                57
5.1 Road Safety in 2008                                                                   58
5.2 Main Characteristics of Road Safety                                                   59
5.3 Measures Adopted to improve Road Safety                                               60
Chapter Six: Thematic Section Two: Sustainable Development                                61
Chapter Seven: Thematic Section Three: A Tough Year ahead for China’s Road Transport      63
Chapter Eight: Thematic Section Four: A Short Description of the Logistics Industry       67
Chapter Nine: Perspectives in Brief                                                       68
References                                                                                69
CONTENTS

Tables
Table 1: Proportion of diversified means of transport in volume and turnover from 2001 to 2008 (%)         4
Table 2: Highway density from 2001 to 2008                                                                 8
Table 3: Development of graded road passenger and freight stations in China from 2001 to 2007              13
Table 4: Composition of Chinese road passenger transport operators in 2007                                 16
Table 5: Composition of Chinese road freight transport business operators in 2007                          19
Table 6: Fuel consumption of various types of commercial vehicles (per 100 kilometres)                     22
Table 7: Contribution of Chinese road transport to the GDP                                                 22
Table 8: Status and influence of road transport in China                                                   23
Table 9: Key legislation in the road transport industry                                                    24
Table 10: Criterion documents in the road transport industry                                               24
Table 11: Industrial standards in the road transport industry                                              25
Table 12: Conditions of professional drivers involved in the road transport business                       25
Table 13: Number of vehicles required in road passenger transport                                          26
Table 14: The basic institutional conditions of carrying out vehicle driver training                       28
Table 15: Conditions of carrying out international road transport business                                 28
Table 16: Conditions of large-type coaches                                                                 31
Table 17: Diesel passenger vehicle fuel consumption limits (litre/100 km)                                  35
Table 18: Diesel ordinary truck fuel consumption limits (litre/100 km)                                     35
Table 19: Diesel semi-trailer fuel consumption limits (litre/100 km)                                       36
Table 20: Diesel tipper truck fuel consumption limits (litre/100 km)                                       36
Table 21: Basic requirements for vans                                                                      37
Table 22: Basic requirements for container vehicles                                                        37
Table 23: Axle limit for vehicles and trailers (kg)                                                        38
Table 24: Technical inspection of motor vehicles for road traffic safety                                   40
Table 25: Wages outside of working hours                                                                   41
Table 26: Public holidays in China                                                                         41
Table 27: Import and export volume of goods to/from major countries and regions in 2008 (billion USD)      42
Table 28: Bilateral & multilateral vehicle transport agreements between China and neighbouring
           countries                                                                                       48
Table 29: Distribution of international road passenger and freight transport volume and turnover in 2007   49
Table 30: Geographical coverage of major international conventions                                         51
Table 31: Comparison of the SCO Agreement and the GMS Cross-border Transport Agreement                     52
Table 32: Major road border-crossing points                                                                56
Table 33: Severe traffic accidents causing more than 10 fatalities at one time                             58
Table 34: Main contents of energy conservation and the reduction of emissions                              62
CONTENTS

Figures
Figure 1: Proportion of diversified means of passenger transport volume in 2008                      5
Figure 2: Proportion of diversified means of passenger transport turnover volume in 2008             5
Figure 3: Proportion of diversified means of freight transport volume in 2008                        5
Figure 4: Proportion of diversified means of freight transport turnover volume in 2008               5
Figure 5: Comparison of the growth rate of GDP, road passengers and freight                          6
Figure 6: Highway mileage and expressway mileage from 2001 to 2008                                   7
Figure 7: Highway administrative classification composition in 2008                                  7
Figure 8: Highway technical classification composition in 2008                                       8
Figure 9: The distribution of highways by technical standards in different areas (thousand km)       8
Figure 10: Certified road transport staff in 2008                                                    9
Figure 11: Total road transport staff from 2001 to 2008                                              10
Figure 12: Road transport staff composition in 2007                                                  10
Figure 13: The number of road transport enterprises from 2001 to 2008 (thousand)                     11
Figure 14: The trend of road passenger enterprises and passenger vehicle changes from 2001 to 2008
           (thousand)                                                                                11
Figure 15: The trend of road freight enterprises and passenger vehicle changes from 2001 to 2008
           (thousand)                                                                                11
Figure 16: The trend of road passenger vehicle and seat changes from 2001 to 2008                    12
Figure 17: The trend of road freight vehicle and tonnage changes from 2001 to 2008                   12
Figure 18: Road passenger transport volume and turnover from 2001 to 2008 (billion)                  15
Figure 19: Activities by various modes of passenger transport in 2008                                16
Figure 20: Activities completed within different transport distances in 2008                         16
Figure 21: Composition of road transport enterprises as per number of vehicles in 2007               17
Figure 22: Road freight transport volume and turnover from 2001 to 2008 (billion)                    18
Figure 23: Activities by various type of freight vehicles in 2008                                    19
Figure 24: Freight activities completed within different transport distances in 2008                 19
Figure 25: Composition of road transport enterprises by number of vehicles in 2007                   20
Figure 26: Change of road passenger and freight average transport distances                          21
Figure 27: Export & import volume and growth rate from 2004 to 2008                                  42
Figure 28: International road passenger volume from 2003 to 2007 (thousand)                          44
Figure 29: International road freight volume from 2003 to 2007                                       44
Figure 30: Use of international road transport permits in China from 2001 to 2007                    45
Figure 31: Composition of international road transport enterprises in 2006 and 2007                  45
Figure 32: Composition of international passenger road transport enterprises in 2006 and 2007        46
Figure 33: Composition of international freight road transport enterprises in 2006 and 2007          46
Figure 34: Changes in the international road transport vehicle fleet                                 47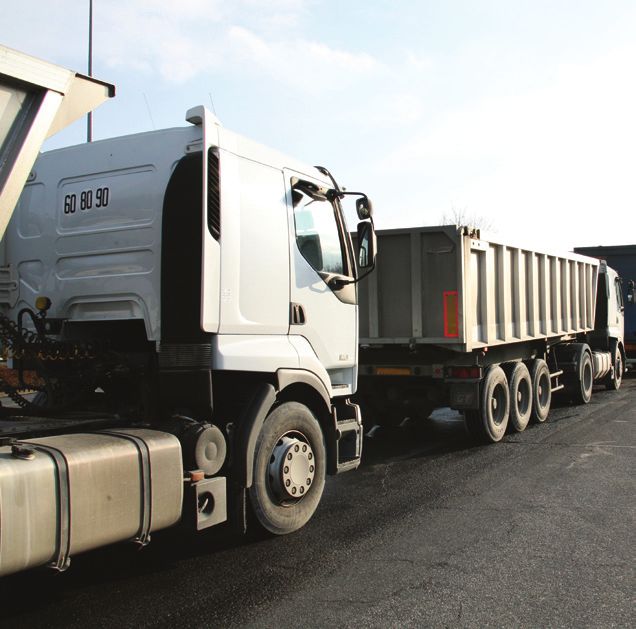

Preface

The International Road Transport Union (IRU) has produced several publications on the road
transport industry in China over the last few years. This IRU report presents the importance of
the industry for the Chinese economy, the development of road passenger and freight
transport capacities, the state of road infrastructure, the legal system governing access to the
profession and the market, including regulations on vehicle standards, road worthiness, fiscal
matters, traffic safety and social matters.
A full chapter is devoted to conditions and achievements in the field of international road
transport regulated by China's various bilateral and multilateral contractual obligations. Four
thematic chapters explain progress in road safety, sustainable development, latest challenges
for road transport operators and the logistics industry.
The IRU report, containing 68 tables and graphs, is rich in statistical and other factual
information on the development and achievements of the road transport industry in China.
The purpose of this IRU publication is self-explanatory. All the efforts made over several years
by international traders, road transport operators, logisticians and forwarders, under the
guidance of national IRU road transport Associations and the IRU, can only bear fruits if they
are based on the right vision and facts.
This report will help all concerned to learn more about road transport conditions in the
People’s Republic of China at the far-eastern gateway of the re-opened Silk Road. Such an
insight is vital for the further enhancement of transport operations across the Eurasian
landmass, notably within the framework of the IRU’s New Eurasian Land Transport Initiative
(NELTI).

Geneva, December 2009

                                               1
Chapter One

                            General Introduction
The development of the Chinese road transport industry is breathtaking, vigorous and
influential. Since the 1990s, the Chinese road industry has grown into the greatest and
fastest developing era in history. The scale of road infrastructure is continuing to expand; the
completed transport volume has been increasing steadily. Meanwhile, the transport capacity
and service quality are improving a great deal, thus forming a good market order to pave the
way for the sustainable, coordinated and healthy development of the national economy.

China’s Opening-Up Policy not only boosted economy, but also brought about great demand
for transport. The Chinese Government has made strategic policies to meet these urgent
demands. So far, an historical breakthrough has been made since a series of measures
were taken. Such feats have also in return contributed to economical growth and China’s
opening-up.

In 2008, although the Chinese road transport industry felt the pain and the hardship from the
global economic downturn, it contributed greatly to the development of the economy and
society with a high level of service and low cost. Up until now, China has built a large-scale
highway system. The total amount of roads has reached 3.7 million kilometres containing
60.3 thousand kilometres of expressways. The number of motor vehicles has reached more

                                               2
than 168 million (176 million in June 2009!), including 127.68 million privately-owned
vehicles.
There were 9.3 million commercial vehicles, among which commercial coaches/buses
amount to nearly 1.7 million and to 7.6 million commercial trucks. In 2008, the amount of
passengers transported by highway reached about 26.8 billion persons and the road
passenger transport sector performed about 1,247.6 billion passenger-kilometres, increasing
30.8% and 8.4% respectively compared to 2007. The volume of road freight transport
reached 19.2 billion tonnes and a corresponding amount of about 3,286.8 billion
tonne-kilometres, which respectively increased by 17.0% and 189.5% compared to the
previous year1.
1
The statistical data for 2008 are from the Special Investigation on National Road and Waterway Transport,
which was carried out by the Ministry of Transport (MOT). As compared with the 2007 statistics, statistical
standards were greatly adjusted.
There are minute differences between the statistics published by the National Bureau of Statistics (NBS) and
those issued by the MOT. The statistics of the MOT are accepted in this report.
31.1 Comprehensive Transport System
In recent years, the volumes of road passenger and freight transport steadily increased over
previous years, with its high figures ensuring first place in the comprehensive transport
system (Table 1).
2
Table 1: Proportion of diversified means of transport in volume and turnover from 2001 to 2008 (%)
Item 2001 2002 2003 2004 2005 2006 2007 2008
Highway 91.4 91.7 92.2 91.9 91.9 91.9 92.1 93.5
Passenger Waterway 1.2 1.2 1.1 1.1 1.1 1.1 1.0 0.7
volume Railway 6.9 6.6 6.1 6.3 6.3 6.2 6.1 5.1
Civil aviation 0.5 0.5 0.6 0.7 0.7 0.8 0.8 0.7
Highway 54.8 55.3 55.7 53.6 53.2 52.8 53.3 53.8
Passenger Waterway 0.7 0.6 0.5 0.4 0.4 0.4 0.4 0.3
turnover Railway 36.2 35.2 34.7 35.0 34.7 34.5 33.4 33.6
Civil aviation 8.3 9.0 9.1 10.9 11.7 12.4 12.9 12.4
Highway 75.4 75.3 74.3 73.0 72.1 72.0 72.0 74.1
Waterway 9.5 9.6 10.1 11.0 11.8 12.2 12.4 11.4
Freight
Railway 13.7 13.8 14.2 14.6 14.5 14.1 13.8 12.7
volume
Civil aviation 0.01 0.01 0.01 0.02 0.02 0.02 0.02 0.02
Pipeline 1.4 1.4 1.4 1.4 1.7 1.7 1.8 1.7
Highway 13.3 13.4 13.2 11.3 10.8 11.0 11.2 29.8
Waterway 54.6 54.4 53.3 59.7 61.9 62.4 63.3 45.6
Freight
Railway 30.6 30.7 32.0 27.8 25.8 24.7 23.4 22.5
turnover
Civil aviation 0.09 0.10 0.11 0.10 0.10 0.10 0.10 0.11
Pipeline 1.3 1.4 1.4 1.2 1.4 1.9 1.9 1.9
In 2008, the road transport share of the number of passengers and passenger-kilometres
respectively covered 93.5% and 53.8% of the total amount in the comprehensive transport
system.3
2
Sources: the figures for the highway and waterway are from www.mot.gov.cn; the figures for the railway from
www.china-mor.gov.cn; the figures for civil aviation from www.caac.gov.cn; the figures for the pipeline from
www.stats.gov.cn.
3
Source: Special Investigation on National Road and Waterway Transport.
4Waterw ay Railw ay Civil
Railw ay Civil
0.7% 5.1% aviation
33.6% aviation
0.7%
12.4%
Road
Transport
93.5%
Road
Waterw ay
Transport
0.3%
53.8%
Figure 1: Proportion of diversified Figure 2: Proportion of diversified
m eans of passenger transport volum e m eans of passenger transport
in 2008 turnover volum e in 2008
In the year 2008, Chinese road transport shares of freight volume and tonne-km respectively
accounted for 74.1% and 29.8% of the total amount in the Chinese comprehensive transport
system.4
Railway Civil Railway Civil
12.7% aviation 22.5% aviation
0.02% 0.11%
Waterway Pipeline Pipeline
11.4% 1.7% 1.9%
Road Road
Transport Transport
74.1% Waterway 29.8%
45.6%
Figure 3: Proportion of diversified means Figure 4: Proportion of diversified means of
of freight transport volume in 2008 freight transport turnover volume in 2008
In 2008, China carried on a tenacious fight against the impact of natural disasters and the
international financial crisis and the overall national economy realised the developing
momentum of faster growth. According to a preliminary estimation, the Gross Domestic
Product (GDP) for the year of 2008 was 30,067.0 billion RMB, up by 9.0 percent. In terms of
growth by sectors, the value added by the tertiary industry was 12,048.7 billion RMB, up by
9.5 percent. Playing an important role in the tertiary industry, the volumes of the Chinese
road passenger and freight transport that respectively increased 30.8% and 17.0% as
compared with 2007, were in balance with economic growth, and contributed greatly to the
national economy, especially in such a difficult international environment (Figure 5).5
4
Source: Special Investigation on National Road and Waterway Transport.
5
Sources: MOT and NBS.
In 2003, affected by SARS, the road passenger transport volume decreased.
As compared with the 2007 statistics, statistical standards of 2008 were greatly adjusted.
535
30
25
20
15
10
5
0
-5
2001 2002 2003 2004 2005 2006 2007 2008
Road passenger growth rate (%) 4.1 5.1 -0.7 11 4.5 9.6 10.2 30.8
Road freight growth rate (%) 1.6 5.7 3.9 7.3 7.8 9.3 11.8 17
GDP growth rate (%) 8.3 9.1 10 10.1 10.4 11.6 13 9
Figure 5: Comparison of the growth rate of GDP, road passengers and freight
1.2 Highway Infrastructure
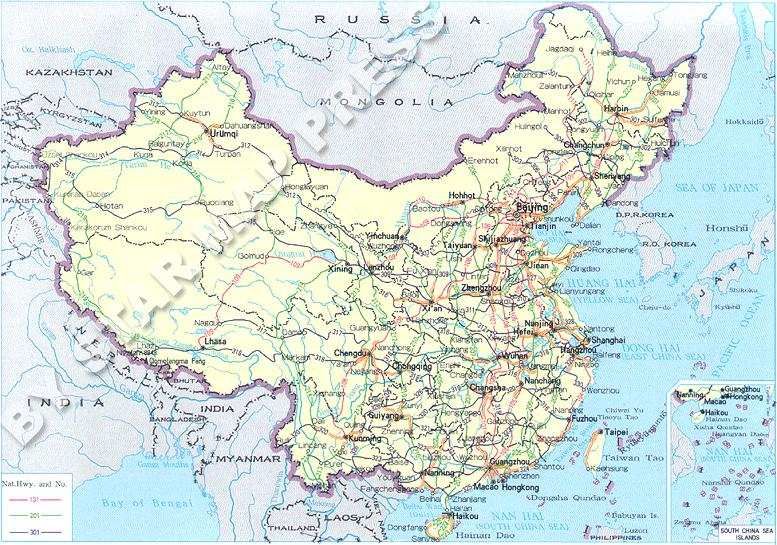
By the end of 2008, the Chinese road transport network comprised of 3.73 million kilometres
of public roads (of which 60,300 kilometres were expressways). In 2008, the additional
highway mileage reached 146,500 km, 4.1% more than that of the previous year (Figure 6).6
6
Source: China Road Transport.
Since 2006, village roads have been included in the total highway mileage.
64000 70
60
3000 50
40
2000
30
1000 20
10
0 0
2001 2002 2003 2004 2005 2006 2007 2008
Highway (thousand km) 1698 1765 1810 1871 1931 3457 3584 3730
Expressway (thousand km) 19.4 25.1 29.7 34.3 41 45.3 53.9 60.3
Figure 6: Highway mileage and expressway mileage from 2001 to 2008
In China, roads are classified by administrative responsibility: national, provincial, county,
township and special highway as well as village roads. In 2008, out of the 3.73 million
kilometres of highway mileage, there are 155,300 kilometres of national roads, 263,200
kilometres of provincial roads, 512,300 kilometres of county roads, 1,011,100 kilometres of
township roads, 67,200 kilometres of special highways and 1,721,000 kilometres of village
roads, which respectively took up 4.2%, 7.1%, 13.7%, 27.1%, 1.8% and 46.1% of the total
highway mileage (Figure 7).7
In accordance with technical classification, roads are classified by expressways, class I,
class II, class III, class IV and unclassified roads. In 2008, out of the total highway mileage,
there are 60,300 kilometres of expressways, 54,200 kilometres of class I roads, 285,200
kilometres of class II roads, 374,200 kilometres of class III roads, 2,004,600 kilometres of
class IV and 951,600 kilometres of unclassified roads, which respectively took up 1.6%,
1.5%, 7.6%, 10.0%, 53.7% and 25.5% of the whole 3.73 million kilometres of highway
mileage (Figure 8). 8
Village
National Provincial County
roads
road 4.2% road 7.1% roads
46.1%
13.7%
Township
Special roads
roads 27.1
1.8%
Figure 7: Highway administrative
classification composition in 2008
7
Source: Special Investigation on National Road and Waterway Transport 2008.
8
Source: 2008 Road and Waterway Transportation Industry Statistics Bulletin.
72500000
2000000
1500000
1000000
500000
0
Expressway Class I Class II Class III Class IV Unclassified
thousand km 60,300 54,200 285,200 374,200 2,004,600 951,600
Figure 8: Highway technical classification
composition in 2008
In 2008, the density of the Chinese highway reached 38.9 km/hundred square km, 1.5%
more than that of the previous year (Table 2).9
Table 2: Highway density from 2001 to 2008
Year 2001 2002 2003 2004 2005 2006 2007 2008
Highway density
17.7 18.4 18.9 19.5 20.1 36.0 37.3 38.9
(km/hundred sq. km)
At the present time, development of the different areas is still unbalanced, the highway
mileage in the Central area and West area are continuing to grow, and the technical state of
highways in the Central and West further improves. In 2008, the length of highways in the
East area reached 1.1 million kilometres and it increased by 28.8 thousand kilometres
compared with 2007; the highway mileage of the Central area reached 1.3 million kilometres
and it increased by 36.0 thousand kilometres; it reached 1.4 million kilometres in the West,
representing 81.7 thousand kilometres more than in 2007 (Figure 9).10
Total Expressway Class II and higher highway
99.5
West 16.5
1421.1
121.5
Central 18.3
1258.9
178.8
East 25.6
1050.1
0 200 400 600 800 1000 1200 1400 1600
Figure 9: The distribution of highways by technical standards in
different areas (thousand km)
9
Sources: 2008 Road and Waterway Transportation Industry Statistics Bulletin and Report on China Road
Transport Development in 2007.
10
Source: 2008 Road and Waterway Transportation Industry Statistics Bulletin.
81.3 Transport Capacity Development
In recent years, the rate of employees carrying certificates has increased steadily. By the end
of 2008, there were more than 21.2 million persons directly employed in the Chinese road
transport industry, including an increase of 1.5 million as compared to 2007. Altogether, 18.0
million employees held relevant certificates of professional competence, including 14.0
million professional drivers working for the road passenger and freight transport industry, 0.7
million in the dangerous goods transport industry, 1.5 million in the motor vehicle
maintenance industry and 0.4 million involved in driver training (Figure 10).11
As for the whole sector, road transport provides a numerous employment opportunities for
society (Figure 11).12 By the end of 2007, there was 19.7 million staff, as mentioned in the
previous paragraph, including 3.7 million staff in road passenger transport, 12.3 million in
road freight transport, 0.4 million in transport yards and terminals, 2.4 million in motor vehicle
maintenance, 0.4 million in driver training and 0.4 million in other transport-related service
operations (Figure 12).13 In recent years, new changes have taken place in the market
operation range of the road transport industry. The traditional loading and unloading
business reduced tremendously in contrast to the rapid increase of transport yard and
terminal operation and motor vehicle maintenance business, forming the various and more
intensive trends of development.
15
10
5
0
Vocational driver Dangerous Maintenance Driver training
Million 14 0.7 1.5 0.4
Figure 10: Certified road transport staff in 2008
11
Source: The Speech for the National Road Transport Forum on Work in Vocational Qualifications, by Feng
Zhenglin, Vice-Minister of the Ministry of Transport.
The number of employees in the urban public transport and urban truck traffic are not included.
12
Source: Special Investigation on National Road and Waterway Transport 2008, and www.moc.gov.cn.
13
Source: Report on China Road Transport Development in 2007.
925
20
15
10
5
0 2001 2002 2003 2004 2005 2006 2007 2008
million 14.2 14.8 15.4 16.5 18.0 18.6 19.7 21.2
Figure 11: Total road transport staff from
2001 to 2008
Driver Other
Maintenance training 2.0%
Terminals 12.2% 2.1%
2.2% Passenger
18.9%
Freight
62.7%
Figure 12: Road Transport staff composition
in 2007
Similar to the increase of road transport staff from 2001 to 2008, the number of road
transport enterprises increased steadily; however, by contrast with the increase in the total
road transport enterprises, the number of road passenger enterprises has been showing a
downward trend since 2001. In 2008, the number of road transport business enterprises was
6.1 million, representing an increase of 0.7 million. Meanwhile, the number of road
passenger transport business enterprises shrunk by more than 50% from 2001 (Figure 13).14
14
Sources: http://www.mot.gov.cn and the speech of Feng Zhenglin, Vice-Minister of the MOT, on 19 August
2009.
The figures for freight transport enterprises and passenger transport enterprises in 2008 is not yet available.
107000 600
6000 500
5000
400
4000
300
3000
200
2000
1000 100
0 0
2001 2002 2003 2004 2005 2006 2007 2008
Road transport enterprise, 1000 4627 4401 4603 4887 5095 4942 5189 6116
Freight transport enterprise, 4069 3937 4186 4510 4756 4684 4959
1000
Passenger transport enterprise, 558 464 417 377 339 258 230
1000
Figure 13: The number of road transport enterprises from 2001 to 2008 (thousand)
Up until 2008, there were 9,306.1 thousand commercial vehicles nationwide, of which there
were 1,696.4 thousand road passenger vehicles (buses and coaches), 50.4 thousand more
than in 2007; 7,609.7 thousand road freight vehicles, 771.7 thousand more than in 2007
(Figure 14 and Figure 15).15
600 2000 6000 8000
500 5000
1500 6000
400 4000
300 1000 3000 4000
200 2000
500 2000
100 1000
0 0 0 0
2001 2002 2003 2004 2005 2006 2007 2008 2001 2002 2003 2004 2005 2006 2007 2008
The amount of road passenger enterprise The amount of road freight enterprise
The amount of road passenger vehicle The amount of road freight vehicle
Figure 14: The trend of road passenger Figure 15: The trend of road freight
enterprises and passenger vehicle enterprises and passenger vehicle
changes from 2001 to 2008 (thousand) changes from 2001 to 2008 (thousand)
15
Source: 2008 Road and Waterway Transportation Industry Statistics Bulletin.
112000 30000
25000
1500
20000
1000 15000
10000
500
5000
0 0
2001 2002 2003 2004 2005 2006 2007 2008
Passenger vehicle (thousand) 1379 1409 1495 1532 1522 1620 1646 1696
Seats (thousand) 16912 17351 18217 18795 19576 23094 24265 25604
Figure 16: The trend of road passenger vehicle and seat changes from 2001 to 2008
The 1,696.4 thousand road passenger vehicles represented 25,603.6 thousand seats, on
average 15.1 seats per vehicle, 4.5 seats more than in 2001. The 7,609.7 thousand road
freight vehicles represented a total tonnage of 36862.0 thousand tonnes, on average 4.8
tonnes per vehicle (Figure 16 and Figure 17).16 From the figures, we can see that the seats
increased faster than the number of road passenger vehicles, the tonnage also increased
faster than the number of road freight vehicles. These trends show that large-scale coaches
and heavy-duty trucks have been given priority in China.17
8000 40000
35000
6000 30000
25000
4000 20000
15000
2000 10000
5000
0 0
2001 2002 2003 2004 2005 2006 2007 2008
Freight vehicle (thousand) 4585 4716 5108 5523 5872 6477 6838 7610
Tonnage (thousand) 15684 16181 17404 20789 23613 28676 31337 36862
Figure 17: The trend of road freight vehicle and tonnage changes from 2001 to 2008
From 2001 to 2008, with the rapid increase of road passenger and freight transport
operations nationwide, there have been altogether more than 160 thousand passenger and
freight transport terminals. According to technical classification, road passenger transport
yards and terminals are classified by first class, second class, third class, fourth class, fifth
class and convenient terminals, while road freight transport terminals are classified by class I,
class II, class III and class IV. Except for a few specific years, all the graded and unclassified
terminals developed steadily.
16
Source: Road and Waterway Transportation Industry Statistics Bulletins, from 2001 to 2008.
17
Source: Special Investigation on National Road and Waterway Transport in 2008.
12Up to 2007, there were altogether 156,294 road passenger transport terminals, including 521
first class, 2,133 second class, 1,960 third class, 3,892 fourth class, 5,339 fifth class and
142,449 convenient terminals and signposted stops, while there were altogether 2,585
freight transport stations, including 224 first class, 271 second class, 894 third class and
1,196 fourth class freight transport terminals (Table 3).18
Table 3: Development of graded road passenger and freight stations in China from 2001 to 2007
Passenger Terminals Freight Terminals
Year
First class Second class Third class Fourth class First class Second class Third class Fourth class
2001 357 2,008 2,303 2,387 94 251 404 639
2002 383 2,064 1,931 2,087 173 252 483 654
2003 361 2,111 1,922 1,996 98 264 524 768
2004 395 2,135 1,889 2,179 102 285 509 906
2005 447 2,123 1,940 2,314 137 332 478 893
2006 497 2,177 1,900 3,145 186 343 552 1,051
2007 521 2,133 1,960 3,892 224 271 894 1,196
18
Source: Report on China Road Transport Development in 2007.
13Chapter Two
Road Transport Activities
In order to make statistics scientifically more accurate, an investigation named Special
Investigation on National Road and Waterway Transport by the Ministry of Transport (MOT)
was commissioned. In this report, the numbers used for the year 2008 are from the 2008
Road and Waterway Transportation Industry Statistics Bulletin, in which the statistics
standard was greatly adjusted.
As mentioned in Chapter 1, although the Chinese road transport industry is suffering from
the impact of the global recession and the negative effect of high oil prices combined with the
fierce competition with other transport modes, it continued to develop greatly in 2008 and
played a major role in the comprehensive transport system, contributing to the whole
national economy. In 2008, the Chinese road transport industry carried 26.8 billion persons,
performing 1,247.6 billion passenger-kilometres and 19.2 billion tonnes, undertaking 3,286.8
billion tonne-kilometres.
The road passenger transport average distance was 46.5 kilometres, while the road freight
transport average distance was 171.5 kilometres.
To cope with present challenges,
the Chinese road transport
industry is changing the mode of
development, adjusting the
development structure,
introducing technical innovation
and sustainable development and
striving to advance public service
capacity. Through tireless
industry-wide efforts, the year of
2008 saw a steady increase of
both road transport efficiency and
service quality.
142.1 Road Passenger Transport
In 2008, road passenger transport grew continuously. Various modes of passenger transport
contributed to this development (Figure 18).1
30.0 1400.0
25.0 1200.0
1000.0
20.0
800.0
15.0
600.0
10.0
400.0
5.0 200.0
0.0 0.0
2001 2002 2003 2004 2005 2006 2007 2008
Passenger transport volume 14.0 14.8 14.6 16.3 17.0 18.6 20.5 26.8
Passenger turnover 720.7 780.6 769.6 874.8 929.2 1013.1 1150.7 1247.6
Figure 18: Road passenger transport volume and turnover from 2001 to 2008 (billion)
The passenger transport volume can be broken down to that completed by scheduled
passenger transport lines (52.5%), taxi (11.3%), urban public transport vehicles (buses)
(32.3%) and other commercial passenger transport (3.9%). The corresponding numbers of
road passenger turnover were 74.8%, 5.7%, 8.4% and 11.1% respectively (Figure 19).2
Broken down by transport distance, the passenger volume carried within 100 kilometres
amounted to 90.2%, 5.5% within 100-200 kilometres, 2.7% within 200-400 kilometres, 1.1%
within 400-800 kilometres and 0.5% more than 800 kilometres. The corresponding numbers
of road passengers turnover were 43.2%, 14.2%, 14.9%, 13.1% and 14.6% respectively
(Figure 20).3
1
Source: magazine.
2
Source: Special Investigation on National Road and Waterway Transport in 2008.
3
Source: Special Investigation on National Road and Waterway Transport in 2008.
15100%
80%
60%
40%
20%
0%
Passenger Passenger
transport volume transport turnover
Other 3.9% 11.1%
Urban transport 32.3% 8.4%
Taxi 11.3% 5.7%
Scheduled lines 52.5% 74.8%
Figure 19: Activities by various modes of
passenger transport in 2008
100%
90%
80%
70%
60%
50%
40%
30%
20%
10%
0%
Passenger Passenger
transport volume transport turnover
Less than 100 km 100-200 km
200-400 km 400-800 km
More than 800km
Figure 20: Activities completed within
different transport distances in 2008
By the end of 2007, there were about 230 thousand operators engaged in the road
passenger transport business, reduced by about 27 thousand operators as compared to
2006. Among the total number of operators, there were about 21 thousand enterprises and
about 209 thousand individual operators. (Table 4).
4
Table 4: Composition of Chinese road passenger transport operators in 2007
Type Total Enterprise Individual operator
Coach line 71,251 9,020 62,231
Taxi 126,131 6,498 119,633
Tourism 2,175 1,956 219
Other
4
Source: Report on China Road Transport Development in 2007.
16The declining trend of bus line passenger transport enterprises and individual operators, as
well as taxi operators, shows that the traditional road passenger transport development
structure has been adjusting steadily. The growth trend of tourist passenger transport
individual operators shows that tourism is becoming a new economic and profit growth point
for the Chinese road passenger transport industry, accompanied by the support of national
and industrial policies. Up to now, this trend in tourism has become more evident and the
competition has become more intense than ever.
In total, most road passenger transport enterprises own a fleet of around 10-49 passenger
vehicles. Among bus line transport enterprises, there were 1,592 enterprises with over 100
passenger vehicles, accounting for 17.6% of the total, 1,985 enterprises with 50-99
passenger vehicles accounting for 22.0%, 3,138 enterprises with 10-49 passenger vehicles
accounting for 34.8%, 2,305 enterprises with less than 10 passenger vehicles accounting for
25.6%. Among taxi passenger transport enterprises, there were 2,063 enterprises with over
100 taxis accounting for 31.7%, 1,687 enterprises with 50-99 taxis accounting for 26.0%,
2,144 enterprises with 10-49 taxis accounting for 33.0%, 604 enterprises with less than 10
taxis accounting for 9.3%. Among tourist passenger transport enterprises the numbers were
respectively 182 enterprises with over 100 vehicles for 11.4%, 166 enterprises with 50-99
vehicles for 10.4%, 985 enterprises with 10-49 vehicles for 61.7%, and 623 enterprises with
less than 10 vehicles for 16.5% (Figure 21).5
less than
over 100 less than over 100
10
vehicles 10 vehicles
vehicles
17.6% vehicles 31.7%
9.3%
25.6%
50-99 10-49
vehicles 10-49 vehicles
22.0% vehicles 33.0%
50-99
34.8%
vehicles
26.0%
Composition of bus line passenger Composition of taxi passenger transport
transport enterprises enterprises
over 100
vehicles less than
11.4% 10
50-99 vehicles
vehicles 16.5%
10.4%
10-49
vehicles
61.7%
Composition of tourist passenger
transport enterprises
Figure 21: Composition of road transport enterprises as per number of vehicles in 2007
5
Source: China Communications Yearbook of 2008.
172.2 Road Freight Transport
In recent years, although the oil price continued to rise, the road freight transport industry in
China continued to develop. In 2008, the total road freight volume reached 19.2 billion
tonnes, while freight turnover reached 3,286.8 billion tonne-kilometres (Figure 22).6
25.0 3500.0
3000.0
20.0
2500.0
15.0 2000.0
10.0 1500.0
1000.0
5.0
500.0
0.0 0.0
2001 2002 2003 2004 2005 2006 2007 2008
Freight transport volume 10.6 11.2 11.6 12.5 13.4 14.7 16.4 19.2
Freight turnover 633.0 678.3 710.0 784.1 869.3 975.4 1135.5 3286.8
Figure 22: Road freight transport volume and turnover from 2001 to 2008 (billion)
Divided according to vehicle type, the freight transport volume, completed by general freight
vehicles, special freight vehicles, dangerous goods vehicles, farm vehicles, tractors and
other freight vehicles, amounted to 63.2%, 17.0%, 2.8%, 9.4%, 5.1% and 2.4% respectively.
The corresponding figures for road freight turnover were 63.8%, 26.7%, 3.5%, 3.2%, 1.0%
and 1.6% respectively (Figure 23).7
Divided according to transport distance, the freight transport volume completed within 100
kilometres, 100-400 kilometres, 400-800 kilometres, 800-1,200 kilometres and over 1,200
kilometres, amounted to 62.6%, 25.5%, 6.6%, 2.3% and 3.0% respectively. The
corresponding numbers of road freight turnover were 12.0%, 27.2%, 19.8%, 11.9% and
29.1% respectively (Figure 24).8
6
Source: Special Investigation on National Road and Waterway Transport in 2008.
7
Source: Special Investigation on National Road and Waterway Transport in 2008.
8
Source: Special Investigation on National Road and Waterway Transport in 2008.
18100%
90% 100%
80% 90%
70% 80%
60% 70%
50% 60%
40% 50%
30%
40%
20%
30%
10%
20%
0%
Freight volume Freight turnover 10%
Other vehicle 2.4% 1.6% 0%
Tractor 5.1% 1.0% Freight transport Freight transport
Farm vehicle 9.4% 3.2% volume turnover
Dangerous vehicle 2.8% 3.5% Less than 100 km 100-400 km
Special vehicle 17.0% 26.7% 400-800 km 800-1200 km
Common vehicle 63.2% 63.8% More than 1200km
Figure 24: Freight activities completed
Figure 23: Activities by various type of freight
within different transport distances in
vehicles in 2008
2008
By the end of 2007, there were about 4,959 thousand operators engaged in the road freight
transport business, increased by about 275 thousand operators as compared to 2006,
showing a more and more decentralised trend in the Chinese freight business. Among the
total number of operators, there were about 568 thousand enterprises and about 4,391
thousand individual operators.
9
Table 5: Composition of Chinese road freight transport business operators in 2007
Operator type Total Enterprise Individual operator %
General freight transport 4,354231 549,927 3,804,304 87.4%
Special freight transport 31,039 14,295 16,744 53.9%
Container transport 7,313 5,823 1490 20.4%
Heavy duty goods transport 1,814 1,075 739 40.7%
Dangerous goods transport 7,885 7,675 210 2.7%
other
In the Chinese road freight transport market, most enterprises own less than 50 vehicles.
Due to high capital and technical requirements, the numbers of heavy duty goods transport
and dangerous goods transport individual operators declined compared to those of 2006.
Except for these, the number of both enterprises and individual operators increased further
(Table 5).
Among the special freight transport enterprises, there were 1,217 enterprises with over 100
vehicles, accounting for 8.5% of the total, enterprises with 50-99 vehicles, enterprises with
9
Source: Report on China Road Transport Development in 2007.
1910-49 vehicles and enterprises with less than 10 vehicles can be seen as follows. The
composition of container, heavy duty freight and dangerous goods transport enterprises are
also as follows (Figure 25).10
over 100 over 100
vehicles vehicles
8.5% 3.9%
50-99
50-99 vehicles
vehicles less than 5.3% less than
5.7% 10 10
vehicles 10-49 vehicles
10-49 54.0% vehicles 53.5%
vehicles 37.3%
31.7%
Composition of special freight transport Composition of container transport
enterprises enterprises
50-99 over 100 50-99 over 100
vehicles vehicles vehicles vehicles
4.1% 5.5% 7.7% 5.2%
10-49 less than
vehicles 10
10-49
less than 50.5% vehicles
vehicles
10 36.6%
23.9%
vehicles
66.5%
Composition of heavy duty freight Composition of dangerous goods
transport enterprises transport enterprises
Figure 25: Composition of road transport enterprises by number of vehicles in 2007
2.3 Average Transport Distance
In 2008, the road freight average transport distance was 171.5 kilometres. This number was
identified by a new statistics standard which was different from the one used in 2007 and the
years before. However, without taking into consideration the 2008 figures, the road freight
and passenger average distances were increasing slightly (Figure 26).11
10
Source: Report on China Road Transport Development in 2007.
11
Source: www.moc.gov.cn.
2060 200
180
50 160
40 140
120
30 100
80
20 60
10 40
20
0 0
2001 2002 2003 2004 2005 2006 2007 2008
Road passenger distance 51.4 52.9 52.6 53.9 54.7 54.5 56.1 46.5
Road freight distance 59.9 60.8 61.2 63.0 64.8 64.5 69.3 171.5
Figure 26: Change of road passenger and freight average transport distances
2.4 Fuel Consumption
Since January 1, 2009, China started to implement the fuel tax reform program. This
program introduced the abolition of the road maintenance fee, transport management fee,
passenger and freight transport surcharge. All fuel users must pay 0.8 RMB per litre instead
of paying the fixed fees. As the result of the fuel tax reform, the costs for road transport
enterprises increased significantly. More and more road transport enterprises began to seek
ways of energy-saving and emission reduction to reduce additional costs. The technical
condition of commercial vehicles gradually improved.
According to a special investigation carried out by the Ministry of Transport (MOT) in 2008,
the road passenger transport petrol vehicles with less than 7 seats, 7-15 seats and more
than 15 seats, respectively consumed 8.6 litres, 11.3 litres and 21.9 litres of gasoline over
100 kilometres, the road passenger transport diesel vehicles with less than 7 seats, 7-15
seats, 15-30 seats and more than 30 seats, respectively consumed 8.1 litres, 14.4 litres, 18.4
litres and 25.5 litres, and the road passenger transport natural gas vehicles consumed
0.0239 m3, and the corresponding number of liquefied petroleum gas vehicles was 0.0225
m3.12
According to the investigation, in 2008 the road freight transport petrol vehicles with less
than 2 tonnes and more than 2 tonnes respectively consumed 13.0 litres and 25.1 litres,
while the road freight transport diesel vehicles with less than 2 tonnes, 2-4 tonnes, 4-8
tonnes, 8-20 tonnes and more than 20 tonnes respectively consumed 15.1 litres, 20.2 litres,
25.1 litres, 30.7 litres and 35.0 litres (Table 6).13
12
Source: Special Investigation on National Road and Waterway Transport for the Year of 2008.
13
Source: Special Investigation on National Road and Waterway Transport for the Year of 2008.
21Table 6: Fuel consumption of various types of commercial vehicles (per 100 kilometres)
Less than 7 seats 7-15 seats More than 15 seats
Passenger gasoline
8.6 L 11.3 L 21.9 L
vehicle
Less than 7 seats 7-15 seats 15-30 seats More than 30 seats
Passenger diesel vehicle
8.1 L 14.4 L 18.4 L 25.5 L
3
Natural gas vehicle 0.0239 m
Liquefied petroleum gas 3
0.0225 m
vehicle
Less than 2 t More than 2 t
Freight gasoline vehicle
13.0 L 25.1 L
Less than 2 t 2-4 t 4-8 t 8-20 t More than 20 t
Freight diesel vehicle
15.1 L 20.2 L 25.1 L 30.7 L 35.0 L
2.5 Road Transport’s Contribution to the GDP
As the main component of an integrated transport system, road transport is the foundation of
the national economy. Road transport can and should adapt to the level and pace of
development of the national economy. Therefore, road transport is highlighted in the strategy
of “building a harmonious society”, which is being promoted to the whole society at the
present time.
At the end of 2007, the contribution of road transport to the national economy developed
steadily and achieved a significant improvement within the integrated transport system. By
the end of 2006, its contribution to the GDP reached 2.10% (Table 7 and Table 8).14
15
Table 7: Contribution of Chinese road transport to the GDP
Road Transport
Year Added Value Growth rate Proportion in GDP Growth rate Staff Growth rate
(billion RMB) (%) (%) (%) (million) (%)
2001 185.87 1.70 14.16
2002 217.16 16.83 1.80 5.88 14.80 4.55
2003 240.39 10.70 1.77 -1.67 15.35 3.74
2004 307.85 28.06 1.93 9.04 16.51 7.51
2005 367.34 19.33 2.01 4.15 17.89 8.95
16
2006 436.37 18.79 2.10 4.48 18.58 3.86
Forecast added value (billion RMB) Proportion in GDP (%) Forecast staff (%)
14
Source: http://www.yzjd.sztb.gov.cn/ShowSubject.asp?Newsid=1609.
15
Source: “Development of Modern Communications and Transportation”, China Communications Press, 2008.
16
Source: Feng Zhenglin’s speech on the National Road Transport Conference in 2007.
222010 669.74 2.46 24.54
2012 792.15 2.66 27.49
2020 1281.76 3.56 41.41
17
Table 8: Status and influence of road transport in China
Staff in the Chinese road Population of China Freight volume per 100 million RMB of
Year
transport industry (million) (million) GDP (tonne)
2001 14.16 1,276.27 108,546
2002 14.80 1,284.53 106,529
2003 15.35 1,292.27 99,402
2004 16.51 1,299.88 90,958
2005 17.89 1,307.56 73,594
2006 18.58 1,314.48 69,192
2007 19.67 1,321.29 63,715
18
2008 24.00 1,328.02 63,750
The development situation in different areas of China varies because of the different
economic and social conditions. In order to analyse the contribution of road transport in
different areas to the GDP, Jilin Province which is located in the east, Henan Province which
is located in the central area and Gansu Province which is located in the west have been
selected.
In Jilin Province, from 2001 to 2005, the road transport industry of accounted for 1.16 billion
passenger and 48 billion passenger-kilometres, 1.4 billion tonnes and 51.55 billion tonne-km
in freight; in the international road transport sub-industry, 1,769 thousand passengers were
transported and the corresponding turnover was 97,359 thousand passenger-km, 4,553
thousand tonnes goods were transport and the corresponding turnover was 170 million
tonne-km. As for the whole road transport industry, the volumes of passenger and freight
share 83.7% and 75.8% of total transport respectively. Road transport added value
reached 12.8 billion RMB, a direct contribution to the GDP rate of 2.5%.19
In 2006, the road transport industry of Henan Province operated 593.7 thousand commercial
road vehicles, increasing by 143% compared to the year 2000. The road passenger and
freight transport volumes, as well as the road passenger and road freight transport turnover
increased by 8.12%, 10.73%, 7.8% and 10.66% respectively on average from 2000 to 2006.
Road transport added value reached 4.84 billion RMB in 2006 and its contribution to the
GDP of Henan Province accounted for 2.63%.20
In Gansu Province, in 2007, the province's road transport industry's added value accounted
for 5.3% of the total value of the province's GDP, for 13.4% of the tertiary industry and for
71.2% of the value added of the whole transport industry.21
17
Source: P186, Supplement of in 2009.
18
Source: Interview with Li Gang, the General Director of the Road Transport Department of the Ministry of
Transport: http://www.moc.gov.cn/zhuzhan/zaixianfangtan/jiaotongxunli/daoluyunshusixunli/.
19
http://www.iicc.ac.cn/jtzt/jtfz/cjzs/gl/200808/24747.html.
20
http://www.sxyzw.com/news_zw.asp?ID=2385&cid=4.
21
http://sei.gov.cn/ShowArticle.asp?ArticleID=157230.
23Chapter Three
The Legal System
3.1 General Introduction
Together with the Highway Law and the Road Traffic Safety Law, the Road Transport
Ordinance (RTO) is the key piece of legislation on the Chinese road transport industry. It
came into force in July 2004. Its stated aims are to establish order in the transport markets,
safeguard public safety and people’s rights, while promoting the development of a healthy
market for road transport services. In the framework of the RTO, according to the various
levels, Chinese legislation in the road transport industry can be divided as follows:
The first level is the Road Transport Ordinance of the People’s Republic of China, the
second level includes ten pieces of legislation (before 1 September 2009), which are key
pieces of legislation governing the Chinese road transport industry (Table 9).1
Table 9: Key legislation in the road transport industry
Date of
Name
implementation
Provisions on the Administration of Road Passenger Transport and Passenger Terminals April 20, 2009
Provisions on the Administration of Road Freight Transport and Terminals April 20, 2009
Provisions on the Administration of the Road Transport of Dangerous Goods August 1, 2005
Provisions on the Administration of Motor Vehicle Maintenance August 1, 2005
Provisions on the Management of Motor Vehicle Driver Training April 1, 2006
Provisions on the Administration of Road Transport Personnel March 1, 2007
Provisions on the Administration of International Road Transport June 1, 2005
Provisions on the Administration of Foreign Investment in Road Transport November 20, 2001
Supplementary Provisions for the “Provisions on Foreign Investment” January 1, 2004
Provisions on the Administration of Road Transport Prices September 1, 2009
Following on from the above two levels, the third level includes “criterion documents”
concerning road transport, which are also important to the Chinese road transport industry
and are still implemented at present (Table 10).2
Table 10: Criterion documents in the road transport industry
Name
Credit Examination Regulations on Road Transport Enterprises (trial)
Credit Examination Regulations on Motor Vehicle Maintenance Enterprises (trial)
Classification Regulations on Road Transport Coaches
1
Source: http://www.moc.gov.cn/zizhan/siju/daoluyunshusi/zhengceguiding.
2
Source: http://www.crta.org.cn.
24Besides the regulations and criterion documents issued by government departments, there
are some industrial standards used in the road transport industry. Although they are not
mandatory, some of them evolved from the relevant regulations, while some of them were
issued by the related industrial association for the purpose of industry self-regulation. As an
important reference, the various levels of government take into account the enterprises’
compliance with these standards when the enterprises apply for increasing new business.
Among these standards is the “Classification of Road Transport Enterprises” which holds an
important position (Table 11).
Table 11: Industrial standards in the road transport industry
Name
Classification of Road Passenger and Goods Transport Enterprises
3.2 Road Transport Ordinance (RTO)
The RTO enshrines the principle of fair competition between service providers and prohibits
restricted or monopolised road transport markets. The MOT, representing the State Council,
is the authority for the overall administration of road transport, while the transport
departments of local governments are responsible for transport affairs in their respective
provinces. At the province level there is a road transport management bureau under the
leadership of the transport department, which is responsible for the provincial road transport
industry management. The transport departments and road transport management bureaus
at county level are respectively under the leadership of the authorities at province level.
The RTO sets out the provisions for the road passenger and freight transport enterprises.
The road passenger transport enterprises must meet the requirements and conditions for the
vehicles, professional drivers (Table 12) and other necessary matters when they apply for
carrying out the related business. For both passenger and freight transport, it sets limits to
drivers’ working hours; requires the operators to have procedures for dealing with accidents,
natural disasters or emergencies; limits the numbers of passengers, freight loads and
lengths, widths and heights of vehicles to authorised maxima; requires operators to carry
liability insurance; and specifies that infringements will be punished according to the Road
Traffic Safety Law by the traffic authorities of public security agencies. In order to ensure the
regulation of the road transport industry, the RTO specifies arrangements for the supervision
and enforcement of regulations governing road transport administration and sets out fines
and penalties for infringement.
Table 12: Conditions of professional drivers involved in the road transport business
Road passenger transport drivers
Obtain the corresponding motor vehicle driving license
Under 60 years old
Without major traffic accident records within three years
Pass the examination of related laws and regulations, including vehicle maintenance and basic knowledge of first aid
for passengers
Road freight transport drivers
25Obtain the corresponding motor vehicle driving license
Under 60 years old
Pass the examination of related laws and regulations, including vehicle maintenance and basic knowledge of loading,
unloading and safekeeping the goods
The RTO also sets out the conditions for the management and operation of road transport
(passenger and freight) terminals, motor vehicle repair services, training services for motor
vehicle drivers and international (cross-border) transport operations. Among other
supplementary matters, it permits foreign investment in road transport and related road
transport business and authorises road transport authorities to recover the costs of issuing
permits.
3.3 Key Regulations under RTO
“Provisions on the Administration of Road Passenger Transport and Passenger Stations”
aims mainly at reinforcing road passenger transport management, regulating market
operations so as to maintain market order and guarantee legal rights protection for
passengers and enterprises. It sets out the conditions of applying for carrying out road
passenger transport business, the conditions of operating enterprises and passenger
terminals, and specifies arrangements for supervision and enforcement of the regulation
governing road passenger transport administration, the fines and penalties for infringement.
It defines the number of vehicles required by various types of operators (Table 13).
3
Table 13: Number of vehicles required in road passenger transport
Type of operators Number of vehicles required
100 vehicles with 3,000 seats at least, in which 30 high class
4
Operators which operate class I routes vehicles with 900 seats at least; or 40 high class vehicles with
1,200 seats
50 vehicles with 1,500 seats at least, in which 15 high class
Operators which operate class II routes vehicles with 450 seats at least; or 20 high class vehicles with
600 seats
Operators which operate class III routes 10 vehicles with 200 seats at least
Operators which operate class IV routes 1 vehicle at least
The most important regulation in the road freight transport sector is “Provisions on the
Administration of Road Freight Transport and Stations”. Meanwhile, China stipulated other
related administrative regulations, rules and standards, such as “Provisions on the
Administration of the Road Transport of Dangerous Goods”, “Mark for Road Transport
Vehicles Carrying Dangerous Goods” (GB13392-2005), “Safety Monitoring of Vehicle
Terminals for Dangerous Chemicals” (AQ 3004-2005) and so on to establish a relatively
3
Source: Provisions on the Administration of Road Passenger Transport and Passenger Stations.
4
Note: Class I routes mean inter-provinces or the distance more than 800 kilometres, within a province for class
II routes, inter-counties for class III routes and class IV routes are the ones which are between neighbouring
counties or within a county.
Source: “Provisions on the Administration of Road Passenger Transport and Passenger Stations”.
26complete legal system governing road freight transport. These regulations provide a firm
legal ground for promoting the supervision on road freight transport and protecting legitimate
interests and rights of cargo owners and road freight operators. They set out the conditions
of applying for carrying out road freight transport business, the conditions of operating
enterprises, and freight terminals, as well as specify arrangements for the supervision and
enforcement of the regulation governing road freight transport administration, fines and
penalties for infringement.
The “Provisions on the Administration of Road Transport Personnel” were put into effect for
the purpose of improving the comprehensive quality of road transport staff, meanwhile the
MOT abolished the “Regulations of Vocational Training for Service Road Transport Drivers”
issued on 6 September 2001. It is composed of general principles, service qualification
management, service qualification license management, service performance stipulations,
legal liabilities and supplementary articles, altogether six chapters and fifty three articles. In
contrast to the old regulations, the new ones further clarify the working responsibilities and
obligations of transport authorities at all levels, as well as road transport management
institutions. Meanwhile, the working responsibilities and obligations for road transport staff
are clearly stipulated.
It classifies road transport staff as road service passenger and freight drivers, dangerous
goods transport staff, motor maintenance technicians, motor vehicle driving trainers, road
transport administrators and other road transport staff, and performs the whole process of
inspection and supervision on the basis of trade admittance, employment behaviour and exit
for road transport staff. Furthermore, it stipulates credit and credit score examination, as well
as their cycle periods. Road transport staff should be tested by both credit and score
examinations once every twelve months, the date of examination counted from the day when
the employment license is required. The grading of credit examination is classified by
excellent, very good, good, fair, pass and fail, which are denoted by level AAA, AA, A, and B
respectively. Professional road passenger and freight drivers and dangerous goods transport
staff who work outside the place of license issuance and whose time of employment is over
three months, should inform the local service administration department; administrators and
other staff who engage in the transport of dangerous goods by road or in related loading and
unloading should have qualifications above a secondary school diploma.
The “Provisions on the Management of Motor Vehicle Drivers Training” comprise of seven
chapters and sixty articles, including general principles, business admittance, trainers’
management, business management, supervision and inspection, legal obligations and so
on.
The regulation stipulates stricter conditions of access to the business, higher standards of
management of driving schools, as compared to the old regulations. It is the first time that the
regulation stipulates the classification of vehicle drivers training business in accordance with
training capacity and training contents. The business operation of vehicle drivers training
falls into three categories: common vehicle drivers training, road transport driver’s operation
qualification training and vehicle drivers training facilities. The common vehicle drivers
27training is classified in three grades with which the enterprises carry out the corresponding
business. In addition, licenses for vehicle drivers training are classified in four-year and
six-year validity time periods. Licenses should be renewed 30 days before the expiration
date. It requires that trainers for vehicle drivers training should pass the national unified
examination and obtain the “Trainer Certification of the People’s Republic of China”. The
basic institutional conditions of carrying out vehicle drivers training are as follows (Table 14).
5
Table 14: The basic institutional conditions of carrying out vehicle driver training
Application materials submitted by operators
Traffic administrative license application
ID license of applicants and a copy
Certificate of property rights of establishment and a copy
Certificate of property rights of training place and a copy
Description of technical conditions of training place
Evidence of technical condition, models and quantity of training vehicles
Training vehicle purchase proof
List of various facilities and equipment
List of the names of the personnel who are about to recruited and the corresponding certificates of qualification and
working title
Other relevant material
The “Provisions on the Administration of International Road Transport” were implemented on
1 June 2005. It is composed of general principles, service qualification management, service
qualification license management and service performance stipulations, international
transport permits management, legal liabilities and supplementary articles, altogether seven
chapters and forty-seven articles. In contrast to the old regulations, the updated one further
clarifies that the international road transport industry does not simply carry out cross-border
transport of passengers and goods, but the multilateral and extended international transport
in the framework of regional transport agreements and international conventions (Table 15).6
7
Table 15: Conditions of carrying out international road transport business
Application material submitted by operators
Corporation with the business license of domestic road transport
Engaging in domestic road transport business in at least three years, and without a major road traffic accident caused
by negligence in the last three years or more (“road traffic accident” means that the driver bears equal or higher
responsibility for traffic accidents)
Drivers should comply with the following conditions:
Obtain the corresponding motor vehicle driving license
Under the age of sixty
Pass the examination of related international road transport laws and regulations, foreign affairs provisions,
5
Source: “Provisions on the Management of Motor Vehicle Drivers Training”.
6
Note: In order to raise the level of access to the international road transport market, some local transport
authorities have developed specific implementation methods of this regulation.
7
Source: “Provisions on the Administration of International Road Transport”.
28You can also read