STEEL MARKET DEVELOPMENTS - Q2 2021 - OECD
←
→
Page content transcription
If your browser does not render page correctly, please read the page content below

STEEL MARKET DEVELOPMENTS

          Q2 2021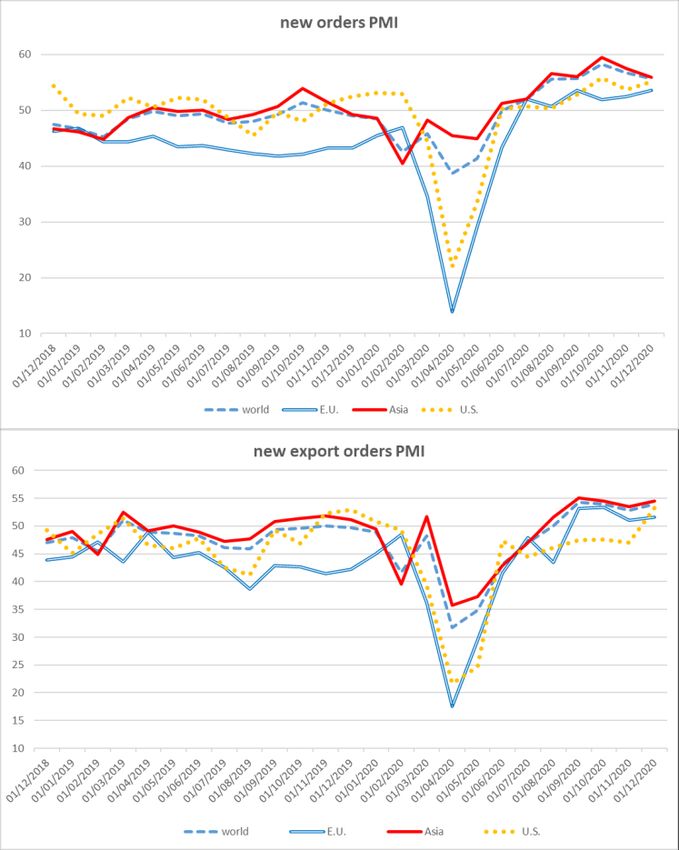
2 STEEL MARKET DEVELOPMENTS – Q2 2021
This paper was authored by Fabien Mercier, Tomohiro Hijikata, Valentina Burrai and Luciano Giua from
the OECD Directorate for Science, Technology and Innovation (STI). It was approved and declassified by
written procedure by the OECD Steel Committee on 18 March 2021 and prepared for publication by the
OECD Secretariat.
Note to Delegations:
This document is also available on O.N.E under the reference code:
DSTI/SC(2021)1/FINAL
This document, as well as any data and any map included herein, are without prejudice to the status of or
sovereignty over any territory, to the delimitation of international frontiers and boundaries and to the
name of any territory, city or area.
©OECD (2021)
The use of this work, whether digital or print, is governed by the Terms and Conditions to
be found at http://www.oecd.org/termsandconditions.
________________________________________________________________________
STEEL MARKET DEVELOPMENTS – Q2 2021 3 Table of contents Recent market developments in the global steel industry 5 1. Executive summary 6 2. The OECD Economic outlook 8 2.1. Global prospects 8 2.2. Regional prospects 10 3. Steel consumption 14 3.1. Americas 14 3.2. Africa and the Middle East 15 3.3. Asia and Oceania 15 3.4. Europe and CIS Economies 16 4. Steel production 18 4.1. Americas 18 4.2. Africa and the Middle East 19 4.3. Asia and Oceania 19 4.4. Europe and CIS Economies 21 5. World steel trade 22 6. Steel and raw material prices 23 6.1. Steel prices 23 6.2. Steel raw material prices 26 7. The global steelmaking capacity situation 30 8. The steel market outlook 32 8.1. Global steel market outlook 32 8.2. Regional steel market outlook 32 Endnotes 48 FIGURES Figure 1. Markit Steel Index: new orders and new export orders among Steel-Intensive Sectors PMI 10 Figure 2. Consumption of hot-rolled steel products, major economies (aggregate) 14

4 STEEL MARKET DEVELOPMENTS – Q2 2021 Figure 3. Aggregate flat and long steel price averages (latest month January 2021) 23 Figure 4. Steel price for flat products, by region 24 Figure 5. Steel price for rebar, by region 25 Figure 6. Steel futures prices (as of 01/02/2021) 26 Figure 7. Prices for key steel-making raw materials (as of January 2021) 28 Figure 8. The upward trend in Chinese scrap prices has recently stabilised (last data point is January 2021) 28 Figure 9. Margin between steel and raw material prices 29 Figure 10. Evolution of crude steelmaking capacity in OECD/EU economies and non OECD/EU economies 30 Figure 11. Global crude steelmaking capacity and crude steel production 31 TABLES Table 1. The latest OECD Economic Projections (December 2020) 9 Table 2. World crude steel production developments in 2020 18 Table 3. Steel trade developments across major steel-producing economies 22
STEEL MARKET DEVELOPMENTS – Q2 2021 5
Recent market developments in the global steel industry
This document is part of a regular monitoring exercise to provide the Steel Committee with
timely information on steel market developments during the year 2020. It provides an
update on recent developments in steel markets, based on the latest information available
at the time of writing (as of January 2021). Given that the data for regional aggregates
presented in the tables throughout this paper extend until the end of 2020, the United
Kingdom is no longer included in the EU aggregate.6 STEEL MARKET DEVELOPMENTS – Q2 2021
1. Executive summary
This document provides an overview of recent steel market developments - including
demand, supply, and prices - and the outlook by region based on information available until
December 2020. To summarise, the following key developments are discussed in this
report:
The economic situation: In its December 2020 Economic Outlook, the OECD projects
world GDP growth to rebound to 4.2% in 2021 and 3.7% in 2022, following a 4.2%
GDP contraction in 2020. Nevertheless, the economic outlook remains exceptionally
uncertain due to unknowns concerning the successful rolling out of vaccines, the
effectiveness of vaccines and the potential resurgence of the virus. Upside risks relate
to the positive impacts on growth from faster-than-expected developments of vaccines
around the world, and to the slowing down and quasi-disappearance of the disease in
a number of countries. Downside-risks relate to the resurgence of the pandemic in
many countries, as well as to a potential loss of confidence, should logistical issues
concerning the distribution of vaccines prove more challenging than foreseen.
Steel consumption: The October 2020 forecasts of the World Steel Association
(henceforth, “worldsteel”) pointed to a global steel consumption decline of 2.4% in
2020. This moderate decrease despite the outbreak of COVID-19 was mainly attributed
to growth in the People’s Republic of China (hereafter “China”), which accounted for
around 57% of the global steel demand in 2020. Turkey was also projected to
experience steel demand growth in 2020, after a sharp contraction in 2019.
Steel production: Global crude steel production declined by 0.9% in 2020, with
plunging output in the first half of the year being partly offset by a recovery in the
second half. Steel production increased significantly in Asia (+6%), mainly led by a
strong rebound in China (+9.5%), in Other Europe (+13.7%), in the CIS (+6.4%) and
in the Middle East (+5.6%), and moderately in South America (+3.7%), Africa (+1.3%)
and Oceania (+0.5%). In contrast, steel production dropped in both the European Union
(-5.0%) and North America (-13.8 %).
World steel trade: The decline of steel exports accelerated for most economies during
the first nine months of 2020. During this period, steel exports decreased (in year-on-
year terms) in the European Union (18.5%), China (16.0%), the United States (13.1%),
Turkey (10.4%), Brazil (9.2%), Chinese Taipei (8.4%), Korea (4.6%), and Japan
(3.1%). On the other hand, steel exports from India and Russia increased by 45.2% and
12.4%, respectively, during in the first three quarters of 2020.
Steel and steelmaking raw material prices: Steel prices have risen sharply during
the second half of 2020, following weakness earlier in the year. As of January 2021,
monthly flat steel prices and rebar prices are 47% and 39% higher than one year earlier,
respectively. A significant amount of steelmaking capacity idled during the heights of
the pandemic could not be brought online quickly enough to meet recovering steel
demand and restocking, leading to the rapid rise in global steel prices. As most of the
plants that idled capacity during 2020 should have resumed production by March 2021,
the recent global rally in steel prices could be short-lived. The sharp increase in prices
has not translated into an increase of the average steel firm margin profit. Strong
increases in raw materials needed to produce steel have reduced the margin. As of
February 2021 prices of iron ore, coking coal and scrap were up 97%, 53% and 56%,
respectively, from their levels one year earlier.STEEL MARKET DEVELOPMENTS – Q2 2021 7
Capacity: Global steelmaking capacity increased to 2 452.7mmt at the end of 2020,
i.e. by 1.6% from the level at the end of 2019. World steel production as a share of
capacity declined from 76.5% in 2019 to 74.5% in 2020.
Steel demand outlook: In its October 2020 outlook, worldsteel forecast that Chinese
finished-steel demand would stagnate in 2021 following growth of 8% in 2020.
Recoveries are expected elsewhere, with projections of steel demand growth of 22.7%,
8.1%, 11.0% and 6.6% for India, Japan, the European Union and the United States,
respectively. In most jurisdictions, however, the level of finished-steel demand in 2021
is expected to remain below pre-pandemic levels.8 STEEL MARKET DEVELOPMENTS – Q2 2021
2. The OECD Economic outlook
2.1. Global prospects
Global growth prospects have improved significantly since the height of the COVID-19
crisis, which led to plummeting output in the first half of 2020 as strict containment
measures aimed at slowing down the spread of the virus were implemented. While
economic prospects have improved recently, the economic outlook remains exceptionally
uncertain. Smaller firms and entrepreneurs are bearing most of the burden of the restrictions
implemented to address the pandemic, and many continue to be out of business. This
increases unemployment and causes long-lasting damage to the socio-economic fabric of
many countries. Upside risks to the outlook relate to the positive impacts on economic
growth from faster vaccine development and deployment around the world and the slower
spread of COVID-19. Downside risks identified are the resurgence of the pandemic and
its impacts on economic activity, as well as the potential loss of confidence should logistical
issues concerning the distribution of vaccines prove more challenging than foreseen. A
significant decline in business confidence would raise the risk of financial market turmoil,
given the historically high level of corporate and sovereign debt worldwide.
In its December 2020 Economic Outlook, the OECD estimated world GDP to have dropped
by 4.2% in 2020, with growth rebounding to 4.2% in 2021 and 3.7% in 2022. Fiscal
balances are set to deteriorate considerably, as governments around the world have adopted
significant support measures in an attempt to mitigate the damage to the corporate sector
and workers caused by the restrictions and the lock-downs to contain the virus.
Nevertheless, governments borrowing costs are historically low, as monetary authorities
have stepped in to reduce the cost of funding.
Table 1 below presents the GDP growth forecasts according to the OECD’s December
2020 Economic Outlook. As alluded to above, there is considerable uncertainty around the
projections presented in this table, due to the challenge of predicting the speed and the
success of the vaccines in the face of a rapidly evolving situation.STEEL MARKET DEVELOPMENTS – Q2 2021 9
Table 1. The latest OECD Economic Projections (December 2020)
Real GDP growth (%)
2018 2019 2020 2021 2022
1
World 3.4 2.7 -4.2 4.2 3.7
United States 3.0 2.2 -3.7 3.2 3.5
Euro area 1.9 1.3 -7.5 3.6 3.3
Germany 1.3 0.6 -5.5 2.8 3.3
France 1.8 1.5 -9.1 6.0 3.3
Italy 0.8 0.3 -9.1 4.3 3.2
Spain 2.4 2.0 -11.6 5.0 4.0
Japan 0.3 0.7 -5.3 2.3 1.5
United Kingdom 1.3 1.3 -11.2 4.2 4.1
Mexico 2.2 -0.3 -9.2 3.6 3.4
Korea 2.9 2.0 -1.1 2.8 3.4
Canada 2.0 1.7 -5.4 3.5 2.0
Turkey 3.0 0.9 -1.3 2.9 3.2
Australia 2.8 1.8 -3.8 3.2 3.1
China 6.7 6.1 1.8 8.0 4.9
India 2 6.1 4.2 -9.9 7.9 4.8
Russia 2.4 1.3 -4.3 2.8 2.2
Brazil 1.2 1.1 -6.0 2.6 2.2
Indonesia 5.2 5.0 -2.4 4.0 5.1
South Africa 1.4 0.2 -8.1 3.1 2.5
OECD 1 2.3 1.6 -5.5 3.3 3.2
Non-OECD 1 4.4 3.6 -3.0 5.1 4.2
World real GDP growth 3.4 2.7 -4.2 4.2 3.7
Note: 1. Moving nominal GDP weights using purchasing power parities.
2. Fiscal years starting in April.
Source: OECD Economic Outlook, December 2020, available at: http://www.oecd.org/eco/outlook/economic-
outlook
Manufacturing activity has rebounded worldwide. The IHS-Markit index for new export
orders of steel-intensive sectors, a forward-looking component of the overall Purchasing
Managers’ Index (PMI), indicates that a recovery in global manufacturing activity among
steel-intensive sectors has taken place since July 2020 (Figure 1). Indeed, in July 2020 the
above-mentioned Markit indices all jumped to levels higher than 50, which indicates
expectations of an increase in new orders from steel-intensive sectors over the previous
month, and have increased further thereafter. The indices have continued to increase in
spite of the recent resurgence of the pandemic in many places, possibly reflecting better-
targeted restriction measures, or comparatively strong growth in China and some other
economies.10 STEEL MARKET DEVELOPMENTS – Q2 2021
Figure 1. Markit Steel Index: new orders and new export orders among Steel-Intensive Sectors
PMI
Latest data point: December 2020
Note: An index reading of less than 50 indicates that more purchasing managers expect a decrease over the next
month than an increase. The last data point represents expectations for the month of December 2020
Source: Markit economics, via Datastream
2.2. Regional prospects
In the euro area, GDP is expected to have decreased by 7.5% in 2020 and is forecast to
increase by 3.6% in 2021 and 3.3% in 2022. Activity declined in 2020 due to the strong
resurgence of the virus and the resulting widespread containment measures put in place by
governments. Although retail sales had caught up during the summer, reflecting delayed
demand, industrial production had not yet fully recovered, especially in capital goods, due
to considerable weakness in investment. Private consumption and investment will be
affected the most by pervasive uncertainty and low confidence, while unemployment will
continue to rise until mid-2021, and fall only gradually afterwards. Investment will remain
significantly below its pre-pandemic levels, but also the recovery of private consumption
is projected to be sluggish, held back by the historically high unemployment rate and weak
real wage growth. Though a bit more dynamic, export growth will be constrained by the
subdued recovery in international trade. Differences in sectoral specialisation, as well as in
the length and the extent of discretionary fiscal support, explains asymmetries in the size
of the economic impact felt across euro area countries. The European Central Bank (ECB)
has continued to provide abundant liquidity, in particular by keeping rates unchanged and
conducting wide-scale asset purchases. The European instrument for temporary Support toSTEEL MARKET DEVELOPMENTS – Q2 2021 11 mitigate Unemployment Risks in an Emergency (SURE), an EU lending facility to support national short-time work schemes, has become operational and witnessed strong take-up, with loans approved to 17 Member States thus far, almost exhausting the facility’s EUR 100 billion envelope. 1 Furthermore, in July 2020 the European Council reached an agreement on the Next Generation EU recovery plan, which envisages EUR 750 billion of financing (about 5.5% of EU27 GDP in 2019), mainly in the form of loans (EUR 360 billion) and grants (almost EUR 380 billion) to member states. A substantial part of these grants will be allocated to member states most affected by the pandemic, thus increasing their fiscal space. The Next Generation EU recovery plan complies with the objective of EU climate neutrality by 2050 and would thus contribute to achieving the EU's climate targets. In the United States, GDP is expected to have decreased by 3.7% in 2020 and is forecast to increase by about 3.2% in 2021 and 3.5% in 2022. An upside risk to the U.S. outlook, according to the OECD’s projections, is greater fiscal stimulus than currently assumed, such as one including provisions for a new infrastructure package. Downside risks include a smaller or delayed fiscal package and a higher-than-expected number of large-scale firm insolvencies, given the high indebtedness of the non-financial corporate sector in general, and of businesses in the sectors most impacted by the restrictions in particular. Unemployment is expected to decrease gradually but to remain above its pre-pandemic level. New COVID-19 cases started to rise again towards the end of 2020, which may dampen the recovery of the economy. A general rollout of an effective vaccine in the latter half of 2021 would allow an easing of containment measures and strengthen confidence. The Federal Reserve cut interest rates to 0-0.25% and announced the resumption of large- scale asset purchases, while adopting a new and more flexible average inflation targeting strategy. Furthermore, new credit facilities were introduced and capital and reserve requirements adjusted to limit the possibility of financial institutions restricting access to finance. Financial conditions thus became, overall, highly accommodative. Fiscal policy also helped temper the impact of the crisis as it provided comprehensive support, including supplementary unemployment insurance, one-off payments to families, financial assistance to state governments, as well as forgivable loans with a Treasury backstop to small businesses that retain workers or for increasing the health sector capacity. In Japan, the economy is gradually strengthening, although growth remains sluggish. The pandemic shock in early 2020 triggered a major recession and real GDP is expected to have decreased by 5.3% in 2020. The OECD forecasts that GDP will increase by about 2.3% in 2021 and 1.5% in 2022. Although household consumption is expected to recover, as well as export growth, private investment will likely remain subdued. Confronted with the first wave of COVID-19 infections in March, the Japanese government declared a state of emergency from 7 April to 25 May, which enabled prefectural governors to order school closures, restrict the use of public facilities and request non-essential businesses to close. Although confinement was not legally imposed, many households chose to shield themselves. The Bank of Japan took steps to support the economy, expanding its policy to ensure financial stability by providing smooth and ample financing through enhanced purchases of various assets and introducing interest-free loans against private debt as collateral. In addition, some public financial institutions have provided interest-free loans to firms. The fiscal stance of the government also contributed to cushioning the impact of the crisis, with a wide range of measures to support households and protect businesses and employment. These include cash handouts of JPY 100 000 to every resident, cash transfers to heavily affected business owners, expanding the Employment Adjustment Subsidy which provides firms with financial support to cover the cost of special paid leave, additional cash benefits for single-parent households and a rent subsidy to help heavily affected firms. Although this fiscal support seems to have been successful in preventing a
12 STEEL MARKET DEVELOPMENTS – Q2 2021
significant increase in the unemployment rate, real wages have decreased and may take
some time to recover, while new job creation has remained anaemic. Notwithstanding a
recovery in industrial production due to export growth picking up, forward-looking
indicators suggest continued weakness in investment, due to a low capacity utilisation rate
and significant uncertainty about future growth.
In China, GDP is expected to have grown moderately in 2020, increasing by 1.8%. The
OECD forecasts show GDP growth picking up to 8.0% in 2021 and settling at a robust
4.9% in 2022. While the COVID-19 outbreak originally started in China’s Hubei province,
containment of the virus, besides some occasional and sporadic new cases, appears to have
allowed for a strong recovery. Although household consumption has still not completely
reached its pre-COVID levels, investment, in particular in infrastructure and real estate, has
been robust and significantly boosted growth in 2020. Government-induced infrastructure
investment spending in particular has lifted the output of many midstream-manufacturing
industries and prompted imports of raw materials such as iron ore or copper. Exports also
contributed strongly to the country’s growth, as they boomed on the back of demand for
masks and other COVID-19-related materials and equipment, as well as teleworking-
related goods. Nevertheless, the pandemic has increased households’ precautionary savings
and eroded consumer confidence. Monetary and financial policy authorities, in addition to
the support provided earlier in the year such as lower reserve requirements and lower loan-
loss provisioning coverage ratios, have enabled smaller banks, which were hit harder during
the outbreak, to use part of the special treasury bonds2 to replenish their capital. Shadow
banking has increased again after several years of decrease, which has helped ease the
financing conditions of private businesses. Monetary policy is reverting to a more neutral
stance to avoid overheating in the real estate market. Fiscal policy has continued to support
the recovery. Special and general local bonds, as well as special treasury bonds, are
financing an infrastructure investment boom, in which local government investment
vehicles are still playing an important role. Fiscal policy will remain supportive, with a
number of tax cuts and extensions of social benefits promoting consumption amid weak
consumer confidence.
In India, GDP is expected to have fallen sharply in 2020, by about 9.9%, according to the
latest OECD Economic Outlook. The forecasts show Indian GDP growth resuming to rates
of 7.9% in 2021 and 4.8% in 2022. However, economic activity in India is still below pre-
pandemic levels, and indicators such as power demand, car sales, railway freight and the
manufacturing PMI are all pointing towards weakness in the momentum of the recovery.
Upstream industries, such as producers of capital equipment, are continuing to contract.
The Reserve Bank of India cut the policy repo rate from 5.15% to 4%, and introduced
mandatory credit repayment moratoria and one-off debt restructuring, but household
consumption and investment have remained largely unresponsive to the resulting easier
monetary conditions. Fiscal support has been significant, initially amounting to about 6.9%
of GDP, of which 4.9% consisted of off-budget measures designed to support businesses
and shore up credit. This was followed by a package focused on household consumption
amounting to 0.2% of GDP ahead of the Diwali festivities, and a third intervention in
November 2020 amounting to about 1.4% of GDP that will span over several fiscal years.
Fiscal support in the near future is projected to be moderate, as the fiscal deficit amounting
to about 16% of GDP (mainly caused by lost tax revenue) limits possibilities for
expansionary fiscal policy. Monetary conditions are projected to remain accommodative,
but further monetary relaxation is currently limited by a headline inflation rate that exceeds
the central bank’s target range. There are upside risks in inflation, should some supply
chain bottlenecks persist as producers in the informal sector fail to restart activity after the
pandemic. Inequality is set to increase, and school closures, if protracted, will hamper long-
term growth in knowledge-intensive, high added-value sectors. On the upside, a successfulSTEEL MARKET DEVELOPMENTS – Q2 2021 13 rollout of a vaccine or effective treatment or an uptick in global growth would translate into faster domestic growth. The immunisation campaign will be an immense logistical and operational challenge with substantial cost. In Brazil, economic activity has started to recover across a wide range of sectors. GDP is projected to have dropped by 6.0% in 2020 but growth is forecast to recover to a rate of 2.6% in 2021 and 2.2% in 2022. The monetary policy response, with rate cuts of 250 basis points in 2020, have led to historically low interest rates, which should boost private investment once the recovery strengthens and credit demand increases. The fiscal policy response to the pandemic has been one of the largest in the region, with discretionary fiscal measures exceeding 8% of the country’s GDP and focusing on the most vulnerable households. New temporary emergency benefits have been paid to over 67 million informal, self-employed or unemployed workers since April 2020, amounting to about BRL 600 (USD 120) per month3, or 57% of the federal minimum wage. Policy support for small firms includes a publicly guaranteed low-interest credit line to cover wages for employees earning up to twice the minimum wage. Additional new corporate credit lines have been provided by the national development bank. Exports will benefit from recovering global demand for food and minerals, but manufacturing exports are limited by continuously weak prospects in neighbouring Argentina. The unemployment rate will peak in 2021 at almost 14%, before receding slowly as previously discouraged workers return to the labour market.
14 STEEL MARKET DEVELOPMENTS – Q2 2021
3. Steel consumption
Global steel consumption was hit hard by the Covid-19 pandemic in 2020, particularly in
the first half of the year, with some improvements registered since then. Figure 2 below
presents the year-on-year (y-o-y) percentage change in the combined consumption of hot-
rolled steel products for 10 of the world’s largest steel-consuming economies in Asia, the
CIS region, Europe, North America and South America. Together, these economies
account for approximately 75% of global steel demand. Aggregate steel consumption, as
measured by this indicator, decreased by 2.1% during the first eight months of 2020
compared to the same period in 2019, albeit with considerable volatility and significant
regional differences.
In the spring of 2020, global steel consumption plunged due to the severe lockdowns
measures and production disruptions in downstream steel-using industries. While many
economies appear to have suffered double-digit declines in steel consumption during 2020,
relatively strong demand developments in China have counterbalanced the overall global
decline in steel consumption. The latest World Steel Association (worldsteel) projections
point to a global steel consumption decline of 2.4% in 2020, with growth resuming to 4.1%
in 2021.
Figure 2. Consumption of hot-rolled steel products, major economies (aggregate)
Y-o-y % changes
15%
10%
5%
0%
-5%
-10%
-15%
Note: Total represents the combined consumption of hot-rolled steel products of the following economies:
Brazil, China, Germany, India, Italy, Japan, Korea, Mexico, Russia and the United States.
The consumption of hot-rolled products is defined as the sum of production and net imports.
Source: OECD calculations based on data from ISSB (International Steel Statistics Bureau) (ISSB, 2021[1]).
3.1. Americas
The U.S. monthly steel consumption indicator decreased by 17.9% y-o-y during January to
August 2020. Steel demand in the United States is expected to have declined by 15.8% in
2020, according to worldsteel’s October 2020 Short-Range Outlook (hereafter “SRO”).STEEL MARKET DEVELOPMENTS – Q2 2021 15
Since the end of the lockdown the recovery has been strong, aided by substantial
government support measures. However, according to worldsteel, the United States are still
struggling to control the virus's spread, and the recovery momentum might taper off.
(worldsteel, 2020[2]).
Steel demand in Mexico is expected to have decreased by 13.4% in 2020, continuing the
downward trend of 2019 (worldsteel, 2020[2]). According to the Mexico National Institute
of Statistics and Geography (INEGI), automotive production in Mexico declined by 20.2%
to 3.04 million units in 2020 (Metal Expert, 2021[3]). In addition, shipments to the United
States (representing around 80% of Mexican automotive production) decreased by 20% to
2.1 million units in 2020, according to INEGI (Metal Expert, 2021[3]).
According to worldsteel forecasts, steel demand in Central and South America is expected
to have declined by 10.1% in 2020 (worldsteel, 2020[2]). In November 2020, Alacero (the
Latin American Steel Association) revised its forecast for Latin American steel
consumption, expecting a 11% drop in 2020 compared to a 14.5% decline forecast in
September 2020, with a V-shaped recovery in steel demand expected for some countries,
especially Brazil (Metal Expert, 2020[4]). In Brazil, steel demand increased by 1.2% to 21.2
mmt in 2020, according to the local steelmakers’ association Instituto Aço Brasil (IAB). In
December 2020, consumption rose sharply by 30.2% to 2.0 mmt compared with the same
month of 2019 (Kallanish, 2021[5]). However, automotive production decreased by 31.6%
to 2.01 million units in 2020 in Brazil, the first decline following four years of consecutive
growth (Kallanish, 2021[6]).
3.2. Africa and the Middle East
Steel demand in Africa is expected to have contracted by 16.0% in 2020, the second- worst
rate of decline by region, according to worldsteel’s October 2020 SRO (worldsteel,
2020[2]). Apparent steel consumption in the Middle East is expected to have also fallen
sharply, by 19.5%, which is the worst rate of decline projected by region in 2020
(worldsteel, 2020[2]).
3.3. Asia and Oceania
According to worldsteel forecasts, steel demand in China is expected to have increased by
8.0% in 2020 (worldsteel, 2020[2]). Growth in Chinese steel demand had been driven by the
large government’s infrastructure stimulus. Chinese steel demand accounted for around
57% of global demand in 2020 as a result of the sharp contraction in steel demand
experienced in other regions and the relatively stable growth in China, according to
worldsteel’s October 2020 SRO (worldsteel, 2020[2]). By steel-consuming sector,
investment in real estate increased by 7% to about USD 2.2 trillion in 2020, according to
the National Bureau of Statistics (NBS) (Kallanish, 2021[7]). Automotive sales fell by 1.9%
to 25.3 million units in 2020, according to the China Association of Automobile
Manufacturers (hereafter “CAAM”). Although passenger vehicle sales decreased by 6%,
the sales of commercial vehicles increased by 19% thanks to government investment in
infrastructure and as buyers upgraded to comply with tougher emissions policies (Reuters,
2021[8]).
India, is expected to experience one of the sharpest percentage declines in steel demand
(20.2%) in 2020, also in light of the strict lockdown measures implemented at the height
of the Covid-19 pandemic (worldsteel, 2020[2]). Analysis by the Investment Information
and Credit Rating Agency of India Limited (ICRA) notes that that key steel-consuming
provinces have a sizeable portion of their population living in districts marked as red zones
(the districts with substantial numbers of positive cases of Covid-19). For this reason, steel16 STEEL MARKET DEVELOPMENTS – Q2 2021
demand from the construction sector could take some time to return to the pre-COVID-19
levels (The economic times, 2020[9]).
In Japan, steel consumption decreased by 23.3% y-o-y in the first eight months of 2020.
According to worldsteel forecasts, steel demand in Japan is expected to have decreased by
19.6% in 2020 (worldsteel, 2020[2]). Steel demand from the construction, industrial
machinery, and automobile sectors decreased to the levels of the financial crisis in 2009,
while demand from the shipbuilding sector has been stagnant (JISF, 2020[10]). Steel
consumption in Korea is expected to have decreased by around 9% in 2020. (KOSA,
2020[11]). Automotive production in Korea, a key steel-using industry, fell by 11% to 3.51
million units in 2020. Although domestic sales increased by 5.8% to 1.89 million units
because of new model releases and government tax cuts, exports decreased by 21.4% to
1.89 million units in 2020 (Platts, 2021[12]). Within the local market, support came from the
sale of eco-friendly vehicles, sales of which surged by 58.7% to 226,668 vehicles while
exports rose 6.8% to 276,439 vehicles (Platts, 2021[12]).
According to the South East Asia Iron and Steel Institute (hereafter “SEAISI”), apparent
steel consumption in the Association of Southeast Asian Nations region (ASEAN-6, i.e.
Indonesia, Malaysia, Philippines, Singapore, Thailand and Viet Nam) decreased by 15.7%
y-o-y during January-June 2020 (SEAISI, 2021[13]). By country, steel demand in Indonesia,
Malaysia, Philippines, Singapore, Thailand and Viet Nam declined by 18.5%, 43%, 18%,
2.5%, 13.7% and 5%, respectively during the same period (SEAISI, 2021[13]). However,
the decreases in production in the region amounted to 4% only, supported by an increase
in exports in the first half of 2020 (SEAISI, 2021[13]).
In Indonesia, automotive production declined by 46.5% in 2020, according to the
Association of Indonesian Automotive Industries (GAIKINDO) as many Indonesian
automotive manufacturers were forced to halt production due to the COVID-19 pandemic.
(Metal Expert, 2021[14]). Domestic automotive sales decreased by 45% to 578,327 units,
and automotive exports also declined by 30.1% to 232,175 units in 2020.
3.4. Europe and CIS Economies
In October 2020, the European Steel Association (EUROFER) forecast EU steel demand
to decline by 11.5% in 2020. The COVID-19 outbreak and the related industrial and
economic lockdowns experienced since March 2020 have had a massive impact on steel-
using sectors’ output, with plant closures, capacity reductions (permanent and temporary)
and huge supply chain disruptions (Eurofer, 2020[15]).
In the automotive sector, EU passenger car sales dropped by 23.7% to 9.9 million units in
2020 compared to the previous year, according to the European Automobile Manufacturers
Association (ACEA) also due to the Covid-19 pandemic and the associated containment
measures (ACEA, 2021[16]).
According to worldsteel’s October 2020 SRO, apparent steel consumption in Turkey is
expected to have increased by 10.0% in 2020, after contracting by 15.4% in 2019
(worldsteel, 2020[2]). Looking at steel-consuming sectors, automotive production fell by
11% to 1.3 million units in 2020, because export sales declined sharply by 27% to 916,543
units, according to the Turkish Automotive Manufacturers' Association (OSD) (Platts,
2021[17]). However, domestic automotive sales rose by 61.3% to 772,788 units in 2020 after
falling to their lowest level in the past sixteen years in 2019, despite the negative effect of
the COVID-19 pandemic, according to Turkish Automotive Distributors Association
(ODD) (Platts, 2021[18]).STEEL MARKET DEVELOPMENTS – Q2 2021 17 According to the Russian Steel Association (Russian Steel), steel demand in Russia is expected to have decreased by 10.8% in 2020 (Russian Steel, 2020[19]). In November 2020, NLMK forecast steel demand to drop by 7- 9% in 2020 in Russia. They also noted that it could have fallen further if not for the mortgage interest rate cuts, which stimulated residential property demand (Platts, 2020[20]). In Ukraine, apparent steel consumption decreased by 8.6% in the first nine months of 2020, mainly due to a 20.6% drop in machinery output and a 19.4% reduction in pipe production, according to Metinvest (METINVEST, 2020[21]).
18 STEEL MARKET DEVELOPMENTS – Q2 2021
4. Steel production
The COVID-19 pandemic has led to a significant reduction in steel production in a number
of jurisdictions. Overall, world crude steel production decreased by 5.4% during the first
half of 2020 compared to the same period one year earlier, but then started to recover in
the second half of the year. For 2020 as a whole, global steel production fell by 1.0%
compared to 2019, albeit with significant regional discrepancies.
Table 2 below highlights steel production growth rates across regions. According to the
data provided by worldsteel, crude steel production for the 2020 compared to the previous
year increased in Asia (+1.7%), led by China (+5.9%), Other Europe (+3.9%) and in the
Middle East (+2.7%). In contrast, steel production dropped sharply in the European Union
(-12.2%), North America (-15.6 %), South America (-8.4%), and Africa (-10.1%).
Table 2. World crude steel production developments in 2020
Level, thousand tonnes % change, year-on-year
Jul-Dec 2020
Dec 2020 2020 Dec 2020 2020 / 2019
/Jul-Dec 2019
EU 27 11,161 131,915 10.3 -5.2 -12.2
Other Europe 3,036 38,782 -4.7 13.7 3.9
CIS 8,242 100,231 -2.3 3.3 -0.2
North America 6,906 101,017 -29.5 -13.9 -15.6
South America 2,565 38,158 -18.4 3.7 -8.4
Africa 997 12,600 6.7 1.3 -10.1
Middle East 3,264 40,744 -3.2 5.6 2.7
Asia, of which: 113,667 1,349,973 1.6 6.0 1.7
China 91,579 1,054,429 8.1 9.5 5.9
Oceania 528 6,076 4.4 0.5 -1.4
World 149,520 1,827,806 -1.6 3.8 -1.0
Source: worldsteel data, as released on 6 February 2021.
Note: 1. Data are based on monthly production data and can differ from annual data published after December
of each year. Furthermore, monthly production data can be revised at any time.
2. The present publication presents time series which extend beyond the date of the United Kingdom’s
withdrawal from the European Union on 1 February 2020. In order to maintain consistency over time, the
“European Union” aggregate presented here excludes the UK for the entire time series.
4.1. Americas
In North America, total crude steel production collapsed by about 13.9% during the second
half of 2020 compared to the same period in 2019 (henceforth, “year-on-year”), mainly
driven by the decline in the United States and Canada, where steel production contracted
by 16.4% and 15.7% year-on-year respectively. The Mexican steel industry experienced a
small 0.1% year-on-year production decrease in the second half of 2020.
In South America, steel production increased by 3.7% during the second half of 2020, year-
on-year. Production declined sharply year-on-year during the second half of 2020 in
Argentina (-6.2%), Colombia (-3.9%) and Chile (-3.6%), but increased in Brazil (8.2%).STEEL MARKET DEVELOPMENTS – Q2 2021 19
4.2. Africa and the Middle East
African steel production increased by 1.3% during the second half of 2020, year-on-year.
This average growth rate for the continent hides a sharp contrast between South Africa,
which registered a 25.9% production decline, reflecting the impacts of the economic
recession as well as lockdowns, and Egypt, which saw production increase by 28.1%.
In the Middle East, steel production increased by 5.6% year-on-year, though with large
disparities among countries. Iran’s steel production increased sharply (+16.4%), while
Saudi Arabia’s production increased more moderately (+2.7%). Other smaller producing
countries in the region experienced sharp declines.
4.3. Asia and Oceania
Crude steel production in Asia increased by 6.0% year-on-year during the second half of
2020, with a large divergence between China, where steel output increased by 9.5% year-
on-year, and the rest of Asia. Changes in steel production in China were driven by
infrastructure and manufacturing developments, with most steel-using sectors having
already returned to pre-COVID production levels by early May 2020. The resumption of
infrastructure investments and quantitative easing supported the recovery of the Chinese
steel industry in the second half of 2020 (Jiemian, 2020[22]). Furthermore, an important
trend in Chinese steel production is the concentration of production through mergers and
acquisitions (M&A) (see Box 1 below).
Box 1. Production and consolidation trends in China
Following strong growth in steel production that raised China’s share in global steel output to
57.6% in 2020, there is considerable interest in how production trends will evolve in 2021 and
thereafter. The China Metallurgical Industry Planning and Research Institute (MPI), a
government consulting agency, predicted that China's steel production will increase by 1.4% in
2021 to about 1.065 billion tonnes (Investment express, 2020[23]). However, according to a report
by the Xinhua News Agency, the Minister of Industry and Information Technology, Xiao
Yaqing, called on the steel industry to accelerate green development and "resolutely" reduce
production to ensure that steel output will decline year-on-year in 2021 (Xinhua, 2020[24]).
Overall, the consensus is that production growth will still continue in 2021, albeit at a moderate
pace. The China Iron and Steel Association (CISA) mentions imports of primary steel products,
especially billets, as a possible way to meet rising domestic demand without increasing domestic
steel output (Russell - Reuters News, 2021[25]). In addition to the uncertainty of future production
trends, another main trend in the Chinese steel industry seems to be consolidation, with an
increasing part of the production controlled by a reduced number of firms.
In China, the authorities and steel companies have been ramping up their efforts to consolidate
the steel industry to meet the official target of 60% of total Chinese production concentrated in
the hands of the top ten Chinese steelmakers by 2025. As the top 10 Chinese steelmakers
currently account for about 37% of total Chinese steel production, this consolidation trend is
likely to continue. The large state-owned steel producer, Baowu Steel Group, which emerged in
2016 from the merger of Baosteel and Wuhan Iron and Steel (Wugang), has been leading the
way in Chinese steel mergers and acquisitions (M&As), consolidating its position as the top
Chinese steel producer, but there were also significant M&A activities among other SOE and
private Chinese steel firms.
The Baowu Steel Group engaged in a series of acquisitions and takeovers in 2020 and early
2021, which will make China's State-owned Assets Supervision and Administration Commission20 STEEL MARKET DEVELOPMENTS – Q2 2021
(SASAC) the indirect shareholder in a number of other steel firms due to its complete ownership
of Baowu (Reuters News, 2020[26]):
- Baowu signed an agreement with the Yunnan provincial government on 1 February 2021 to
reorganize Kunming Iron and Steel Co. (Kungang) after announcing the consolidation of its
control over Kungang in January 2021. Kungang is 48.41% owned by Wuhan Iron and Steel and
47.41% owned indirectly by Kunming Steel Holdings. Baowu took control of Kungang by taking
90% of the shares of Kunming Steel Holdings, which effectively brings Kungang steelworks into
Baowu official crude steel count which thus increased to a total of approximately 141.64 million
metric tons per year (Kallanish, 2021[27]).
- In February 2021, Baowu was rumored to be considering taking over Shandong Iron & Steel
Group (Argus, 2021[28]).
- In November 2020, Baowu's Xinjiang unit said it would acquire a 77% stake in Xinjiang Yili
Iron & Steel Co Ltd to consolidate steel capacity in southwest Xinjiang region. The unit also
outlined a plan to buy Xinxing Ductile Iron Pipes Xinjiang (Xinjiang Bayi, 2020[29]).
- In August 2020, Baowu agreed to take a controlling stake in Taiyuan Iron & Steel Co Ltd
(TISCO). The 51% stake is estimated to be worth 14.5 billion yuan (USD 2.10 billion), based on
an audit of TISCO's net assets, but Baowu will not have to make any payment as the deal is
considered a state-backed restructuring (Reuters News, 2020[26]). This acquisition made Baowu
the world’s largest stainless steel producer (Kallanish, 2021[27]).
- In September 2020, Baowu signed a deal to take control of Chongqing Iron & Steel Co Ltd
(Argus, 2021[28]).
- In October 2020, Baowu took over Sinosteel Group, a developer and processor of metallurgical
mineral resources with two listed units: Sinosteel Engineering and Technology and Sinosteel
New Materials (Shenzhen Stock Exchange, 2020[30]).
Other M&A activity among SOEs include the following:
- In September 2020, Beijing Shougang said it will buy a 19.2% stake in Shougang Jingtang Iron
& Steel United via a share issue, giving it full ownership of the company (Shougang Steel,
2020[31])
- In August 2020, Liuzhou Iron & Steel said it will increasing its voting rights stake in Guangxi
Iron & Steel Group to 91.41% (Liuzhou Iron and Steel, 2020[32])
- In June 2020, Sansteel Minguang said it agreed to buy Fujian Luoyuan Minguang Iron and
Steel Co., Ltd. (Shenzhen Stock Exchange, 2020[33]).
-In January 2019, Daye Special Steel finished a restructuring by acquiring 86.5% of Xingcheng
Special Steel for 23.2 billion yuan via a share issue (CITIC, 2019[34]). It then changed its name
to CITIC Pacific Special Steel Group Co Ltd (LGMI, 2019[35]).
- CITIC Steel bought the remaining 13.5% stake in Xingcheng in November 2019 and now has
special steel capacity at over 13 million tonnes per year (Citic Pacific Special Steel Group,
2019[36]).
There was also significant M&A activity amongst private steel firms in China in 2020,
including:
- In November 2020, China's biggest private steel producer, Jiangsu Shagang Group, said it will
invest 14.8 billion yuan (USD 2.25 billion) in buying up and modernising steel mills in central
Henan province in a project to create a high-end manufacturing base for construction materials
(Reuters News, 2020[37]).
- In March and September 2020, the Jingye Group, the Hebei-based private steelmaker which
took over British Steel in 2020, acquired two steel mills; one in southwest Yunnan province and
one in south Guangdong province (Jingye Group, 2020[38]).STEEL MARKET DEVELOPMENTS – Q2 2021 21
- In August 2020, Jianlong Group, another large private steel company with annual capacity of
over 35 million tonnes, spent 1.04 billion yuan ($161 million) to restructure Harbin Bearing
Manufacturing Ltd (Jianlong Group, 2020[39]) It also bought a 5.89% stake in state-owned
Sinosteel Luoyang Technology under China's "mixed-ownership" reforms (Jianlong Group,
2020[40]).
- In July 2020, Nanjing Iron & Steel completed a deal to buy stakes in two steel firms for 4.6
billion yuan (Nanjing Iron and Steel, 2020[41]; Nanjing Iron and Steel, 2019[42]).
Production contracted in India during the first half of the year, and recovered moderately
during the second half, resulting in a 1.9% increase over the second half of 2020 year-over-
year. Japan steel production contracted by 15.5% year-on-year over the second half of
2020, while Korean steel production contracted more moderately (-2.2%). Chinese Taipei
contracted by 6.4% year-on-year over the same period.
In Oceania, crude steel production growth was anaemic, with Australian crude steel
production increasing at 0.5% year-on-year and New Zealand, a much smaller steel
producer, at 0.7% year-on-year.
4.4. Europe and CIS Economies
In the European Union, steel production experienced a decline of 5.2% over the second half
of 2020 year-on-year. 4 Amongst the larger steel producers, the contraction was more
profound in France (-12.0%), Spain (-11.4%), Poland (-8.6%), Germany (-3.7%) and Italy
(-3.4%).
The United Kingdom steel production, on the contrary, increased by 6.0% over the period
year-on-year.
In the “Other Europe” region, steel output increased by 13.7% over the second half of 2020
year-on-year, essentially explained by Turkey’s significant increase in steel production
(+16.2%). In the CIS region, steel output increased by 3.3% due to an increase in both
Russia (+2.8%) and Ukraine (+6.1%).22 STEEL MARKET DEVELOPMENTS – Q2 2021
5. World steel trade
Global steel trade had been on a moderate decline in the past few years, but the downturn
accelerated sharply in 2020, as the impacts of the Covid-19 pandemic depressed steel
demand around the world. Some major steel exporters registered double-digit declines in
their outward shipments during 2020, while several others have weathered the downturn
somewhat better.
China experienced a 16% contraction in steel exports in January-September 2020, and a
temporary shift to a net import trade balance for several months after June. More recently,
steel exports have started to rebound, steel imports have fallen, and the trade balance
appears to be moving back into surplus.
Steel exports from the European Union contracted sharply in 2020, plunging by 18.5% in
January-September, relative to the same period in 2019, with a slightly lower rate of decline
in imports. Elsewhere in Europe, Turkish steel exports declined by slightly more than 10%
during the same period 2020, while steel imports increased.
Amongst other major steel exporting economies, Japan and Korea have experienced lower
percentage declines in their steel exports during 2020 compared to many other economies.
In the Americas, the United States and Brazil recorded steep declines in steel trade in 2020.
Brazil is the larger exporter of the two, but its export performance has weakened over the
last few years.
Major steel exporters with positive growth in outward shipments during 2020 include India
and Russia, amounting to 45.2% and 12.4%, respectively, during the first nine months of
the year.
Table 3. Steel trade developments across major steel-producing economies
2016-20 (Jan.-Sep.)
Thousands of metric tonnes 2016 2017 2018 2019 2020 2020 (ann.) % (2019-20)
China (People's Republic of) Exports 100 511 68 049 61 621 56 294 35 472 47 296 -16.0%
Imports 13 211 13 535 13 954 15 168 29 068 38 757 155.5%
E.U.27 Exports 29 819 30 712 28 505 27 483 16 800 22 400 -18.5%
Imports 40 745 40 358 44 945 39 995 25 261 33 681 -15.8%
India Exports 8 967 14 769 9 895 12 277 13 368 17 824 45.2%
Imports 9 259 8 379 8 312 8 140 3 467 4 623 -43.2%
Japan Exports 38 312 35 248 33 794 31 111 22 616 30 155 -3.1%
Imports 5 822 6 042 5 841 6 279 3 705 4 940 -21.3%
United States Exports 8 364 9 469 7 875 6 608 4 306 5 742 -13.1%
Imports 27 797 30 938 27 168 23 440 14 103 18 804 -19.8%
Russian Federation Exports 30 077 29 247 31 246 27 793 23 433 31 245 12.4%
Imports 3 971 5 763 5 735 5 726 3 656 4 874 -14.9%
Korea Exports 29 696 30 168 29 056 29 058 20 788 27 718 -4.6%
Imports 22 574 18 676 14 278 15 697 8 952 11 936 -24.0%
Turkey Exports 14 952 15 985 19 297 19 200 12 901 17 201 -10.4%
Imports 16 539 15 342 13 644 12 018 9 494 12 658 5.3%
Brazil Exports 13 143 14 903 13 298 12 248 8 337 11 116 -9.2%
Imports 1 638 2 058 2 158 2 120 1 283 1 710 -19.3%
Chinese Taipei Exports 12 165 12 039 12 209 11 167 7 674 10 233 -8.4%
Imports 7 654 7 242 7 478 7 106 5 470 7 293 2.6%
Source: OECD based on ISSB data.STEEL MARKET DEVELOPMENTS – Q2 2021 23
6. Steel and raw material prices
6.1. Steel prices
Steel prices have all risen sharply during the second half of 2020. In January 2021, flat steel
prices and rebar prices stood 47% and 39% higher than one year earlier, respectively
(Figure 3). However, the price upswing is very recent, and steel prices were, on average,
quite weak in 2020. Monthly prices of flat steel products and long steel products were, on
average, 3% lower relative to 2019. Vast steelmaking capacity idled during the heights of
the pandemic could not be brought online quickly enough to meet recovering steel demand
and restocking, leading to the rapid rise in global steel prices (Fitch Ratings, 2021[43]). Most
of the plants that idled capacity during 2020 have already resumed production or will restart
by March 2021, according to OECD Secretariat’s desk research. According to Fitch
Ratings, this implies that the recent global rally in steel prices could be short-lived, and that
prices may start to decline towards the end of the first quarter of 2021 (Fitch Ratings,
2021[43]).
Figure 3. Aggregate flat and long steel price averages (latest month January 2021)
Note: The flat price and long price indices are defined as the arithmetic average of the individual regional Platts
price series for the United States, North Europe, China, Japan, India and Russia, when available. This indicator
had the closest fit to the two global Platts price indices used in Steel Market Developments reports prior to
being discontinued (in September 2017). The coefficients of variation (CV) are the ratio of the standard
deviation of the regional Platts price series making up the indices to their mean, thus capturing price dispersion
across regions.
Source: Platts Steel Business Briefing.
All regions displayed similar dynamics with respect to both flat and long steel prices. Flat
steel prices increased more rapidly in the United States than in other economies during the
second half of 2020 (Figure 4), when the intensity of the demand rebound surprised steel
users with low steel inventories, spurring advanced orders (World Steel Dynamics,
2020[44]). Additionally, some reports suggest that the domestic production response to24 STEEL MARKET DEVELOPMENTS – Q2 2021
rising demand was slow, while Buy America provisions may have slowed the speed at
which imports were able to respond to rising demand (World Steel Dynamics, 2020[44];
Wood Mackenzie, 2021[45]). Further support to steel prices in the United States came from
the December spike in scrap prices caused by disruptions in scrap collection compounded
by harsh winter conditions (Wood Mackenzie, 2021[45]). However, the persistence of such
high price levels—in the United States and elsewhere—remains to be seen, as steel supply
is widely expected to catch up with orders by the end of the first quarter of 2021 (Wood
Mackenzie, 2021[45]; World Steel Dynamics, 2020[44]). Furthermore, U.S. flat steel prices
have had a tendency in the past to react more quickly to the upside yet revert to lower levels
afterwards, as experienced in 2018.
Long steel products showed similar price dynamics, exhibiting a significant increase during
the second half of 2020 (Figure 5).
Figure 4. Steel price for flat products, by region
Note: Latest price: 1 February 2021, with the exception of India and Russia (1 January 2021)
Source: Platts Steel Business Briefing.STEEL MARKET DEVELOPMENTS – Q2 2021 25
Figure 5. Steel price for rebar, by region
Note: The latest price is 1 January 2021, with the exception of South East Asia (1 December 2020) and Japan
(1 February 2021)
Source: Platts Steel Business Briefing.
Steel futures prices tend to move slightly in advance of spot prices, suggesting that they are
able to predict steel spot price dynamics at the daily frequency by quickly incorporating
new market information. Figure 6 below shows three steel futures continuous contracts, as
provided by Thomson Reuters Datastream (Refinitiv). Steel futures prices seem to have
recently stabilised at their high levels and have started decreasing slightly in the U.S. and
European markets.26 STEEL MARKET DEVELOPMENTS – Q2 2021
Figure 6. Steel futures prices (as of 01/02/2021)
Indices of three continuously rolled steel futures contract prices, USD per tonne
Note: NYMEX US Midwest futures prices were converted to correspond to metric tonnes rather than short tons.
SHFE Steel rebar futures prices were converted from RMB to USD using daily exchange rates at closing. For
more information on contract specifications, please refer to https://www.lme.com/en-GB/Metals/Ferrous/Steel-
Rebar#tabIndex=0 for LME steel rebar contracts; to
http://www.shfe.com.cn/en/products/SteelRebar/contract/9220216.html for SHFE steel rebar continuous
contracts, and to https://www.cmegroup.com/education/files/hot-rolled-coil-steel-index-futures-options.pdf for
NYMEX US Midwest HRC contracts. For a more detailed description of steel futures market, see (OECD,
2018[46]).
Source: Thomson Reuters, Datastream.
6.2. Steel raw material prices
Prices of the main steelmaking raw materials increased dramatically during the second half
of 2020, and as of February 2021 benchmark prices for iron ore, coking coal and scrap were
up 97%, 53% and 56%, y-o-y, respectively (Figure 7).
Chinese scrap prices also increased, albeit to a lesser extent, ending 2020 about 6% higher
y-o-y. The increase, although not as sharp, is noticeable given that Chinese scrap price had
remained roughly stable from February 2018 to mid-2020 (Figure 8). Most of the increase
in Chinese scrap prices came after October 2020. The October increase was due to the
conjunction of an increase of demand from Chinese steel mills, which needed to replenish
their inventories of scrap metal ahead of the October 1-8 Golden Week holiday, and of a
temporary restriction of supply due to rain and environmental inspections in several
regions, which caused a drop in stocks at scrapyards (American Metal Market, 2020[47]).
Going forward, scrap metal supply is expected to expand to better meet domestic demand
since in February 2020 Chinese regulators allowed new companies to supply processed
ferrous scrap, bringing the total number of such companies to 478, according to the China
Association of Metalscrap Utilization (American Metal Market, 2021[48]). The companies
obtaining those new permits are located mainly in steel production hubs such as the
provinces of Hebei, Shandong and Jiangsu. Others are in provinces that typically have a
high output of ferrous scrap such as Guangdong and Hubei (American Metal Market,STEEL MARKET DEVELOPMENTS – Q2 2021 27 2021[48]). Additionally, in January 2021 new regulations entered in force in China. These lay out standards for steel scrap grades, classifying scrap as a recycled raw material and permitting imports (BIR, 2020[49]; BIR, 2021[50]). Imports that were previously not allowed as steel scrap were classified as waste (Reuters, 2020[51]). The new regulations may lead to an increase in Chinese scrap imports, supporting international scrap prices (Fastmarkets, 2020[52]). Iron ore prices increased sharply from August 2020 onwards due to strong demand from Chinese steel mills and concerns over China's portside iron ore inventories, which had decreased significantly, as well as over iron ore deliveries (Zhang, 2020[53]). Although China's record steel output was a main driver of iron ore prices in 2020, global iron ore supply has also been hit by a series of issues in the second-largest exporting economy, Brazil, which has suffered disruptions from the coronavirus pandemic, mine closures on safety grounds and a recent fire at an export terminal (Russell - Reuters News, 2021[25]). Australia managed to keep its iron ore shipments at robust levels, yet this was not enough to completely offset the losses of supply from Brazil and still meet China's increasing demand. Going forward, iron ore dynamics may depend significantly on whether China moderates its steel production, which is an unknown, and depends on whether ongoing stimulus spending in China will result in the authorities prioritising economic growth over pollution and energy consumption concerns (Russell - Reuters News, 2021[25]). Coking coal prices have been rising globally, except in Australia where the pullback in prices was due to China curbing its coal imports from the country (Russel, 2020[54]). Australia is the world’s largest coal exporting economy, and it sends a third of its total exports to China. The unofficial ban on Australian coal imports was known in the commodity market as early as October 2020, with many major Chinese steel mills diverting their orders of Australian coking coal to other countries (The South China Morning Post, 2020[55]). On 18 November 2020 the foreign ministry spokesperson Zhao Lijian officially confirmed that "many" Australian coal shipments had “failed to pass environmental standard tests” (Muju, 2020[56]). China's coking coal imports from Australia slumped in October 2020 to 1.53 million tonnes, or about 26% of its total imports of the fuel, according to customs data, down from 78% in March, with imports from the U.S., Mongolia and Russia rising to compensate the short-fall. 5 This explains the divergence between the price of Australian coking coal and the Chinese price of coal (Russel, 2020[54]), and would continue to put upward pressure on international coal prices until other iron ore importing economies take advantage of the lower Australian prices for their own steel production (Russel, 2020[54]).
You can also read