Strategic passenger-oriented timetable design - Diva-portal.org
←
→
Page content transcription
If your browser does not render page correctly, please read the page content below
DEGREE PROJECT IN THE BUILT ENVIRONMENT,
SECOND CYCLE, 30 CREDITS
STOCKHOLM, SWEDEN 2021

Strategic passenger-oriented
timetable design
Long-term timetable design with minimised
passenger inconvenience

YARI DE GRAAF

KTH ROYAL INSTITUTE OF TECHNOLOGY
SCHOOL OF ARCHITECTURE AND THE BUILT ENVIRONMENT

Strategic passenger-oriented timetable design with minimised passenger inconvenience

             This page is left intentionally blank.

                                                                                       2/82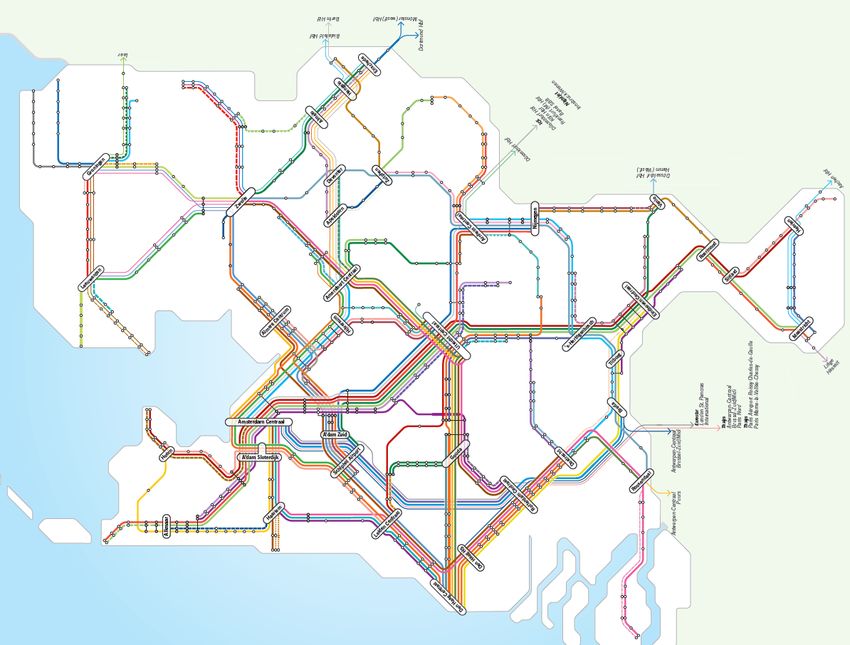
Strategic passenger-oriented timetable design with minimised passenger inconvenience

  Strategic passenger-oriented timetable design
  Long-term timetable designs with minimised passenger inconvenience

                                      MASTER THESIS

Author
Name:                                        Yari de Graaf
Email address:                               yari.degraaf@ns.nl
Programme:                                   MSc Railway Engineering (TJVTM)
Course:                                      AH204X
Institute:                                   KTH Royal Institute of Technology
                                             Department of Transportation
                                             Stockholm, Sweden

Graduation Committee
KTH Royal Institute of Technology
Examiner:                         Erik Jenelius
Supervisors:                      Anders Lindahl
                                  Emil Jansson
                                  Hans Sipilä

Nederlandse Spoorwegen (NS)
Formal supervisor:                           Dennis Huisman
                                             Bart de Keizer
Daily supervisors:                           Gábor Maróti
                                             Gerwin van Dijk

Date:                                        June 18th 2021

                                                                                                        3/82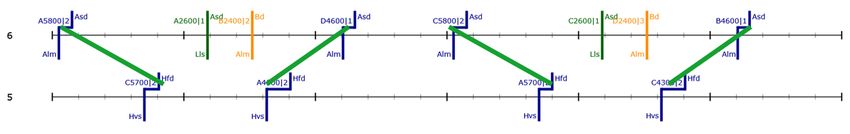
Strategic passenger-oriented timetable design with minimised passenger inconvenience

             This page is left intentionally blank.

                                                                                       4/82
Strategic passenger-oriented timetable design with minimised passenger inconvenience
Acknowledgements
Almost 25 years ago, I was born in Vleuten, a relatively small village in the centre of The
Netherlands. Our house was next to the local railway station and every time a train passes,
we could hear the bells of the level crossing, followed by the train running over it. My
granddad went for a walk with me to the station when he noticed that I was fascinated
by all the vehicles passing by. It was the start of an interest in railway operations that has
remained until today.
Even though The Netherlands has one of the most sophisticated railway networks and
operations in the world, there is surprisingly no bachelor study which focuses on this field
of activity. That is why I decided to go for a Bachelor of Science in Aviation Operations,
since the logistical process of aviation is more or less comparable to the one of railways.
To complete this study, I wrote my bachelor thesis at NS about optimising the short-term
rolling stock planning process, after which I kept working for NS as rolling stock planner
until today. However, at the same time I felt that I wanted to continue my educational
career by specialising in railway operations. That is why I chose to follow the master’s
programme in Railway Engineering at KTH. I am proud to present you the thesis that is
currently in front of you as the proof of finishing this programme!
I am thankful for the support and advice that I have received while writing this master
thesis. First, I would like to thank my KTH supervisors Anders Lindahl, Emil Jansson and
Hans Sipilä for their continuous feedback. I really enjoyed the discussion sessions that we
have had, which helped me to choose the right directions to successfully complete this
thesis project. I would also like to thank my supervisors from NS, Gábor Maróti and
Gerwin van Dijk, for their guidance and support throughout the process. Especially the
help and assistance when working with the SPOT model was really welcome. Finally, I
would to thank my NS colleagues Dennis Huisman, Bart de Keizer and Bart
Kleinlangevelsloo for providing me with this interesting subject on long-term timetabling
problems and for giving me the opportunity to combine my work as rolling stock planner
with the writing of this master thesis.
Utrecht, June 2021
Yari de Graaf
5/82Strategic passenger-oriented timetable design with minimised passenger inconvenience
Abstract
Timetable development and design is a complex process that is crucial for safe and
efficient railway operations. The combination of steel wheels and steel rails makes it
possible to create trains and to transport many vehicles, thus passengers and freight, at
the same time, but it also results in longer braking distances. These braking distances
often exceed sight distance, which means that sufficient distance between trains must
be maintained. This requires a thorough planning of train movements in order to prevent
conflicting train paths and trains stopping for red signals. This is done by creating a time
schedule for different train paths along the track, the so-called timetable.
The timetable forms the backbone of railway operations, because a timetable informs a
passenger when a train departs and arrives. However, in order to attract passengers, the
timetable should be aligned with customer demand. Unfortunately, railway operation
tends to deal with great demand variations over time and within the network. In order
to make clear how passenger demand is distributed, the demand is often expressed in
an origin-destination matrix. Each cell of the matrix corresponds to the number of
expected passengers between an origin and destination. Based upon the demand
distribution, a line design is created. A line design determines the route of a train, and
consists of a stopping pattern and frequency per train. Although the line plan is important
for the timetabling process, an optimal line plan does not automatically result in an
optimal or feasible timetable.
In the past, timetable design focused on a minimisation of the total travel time in conflict-
free timetables only. Nevertheless, several studies confirmed the need for periodic and
symmetric timetables that come with equal levels of service throughout the day, which
are easily memorisable for the passenger. These timetables must be robust, so that a high
punctuality can be achieved. Additionally, an ideal timetable also takes into account
factors like in-vehicle time, waiting time and number of transfers, summarised in the
perceived travel time (PTT). It is, however, impossible to include all these elements in a
manual timetable design. This emphasises the need for a timetabling model that
combines passenger demand and line design to calculate a timetable with a minimal PTT.
Several different timetable models have been developed in the past, where each model
has its own area of focus. Some models focus on the optimisation of line plans, so that
the line design connects most important origin-destination pairs and travel time between
these pairs is minimised. However, these models do not take into account specific arrival
and departure times. It might thus be that the travel time will be high for passengers that
have to change trains. Other models focus on the development of conflict-free
timetables, in which the infrastructure governs the timetable. Although this might result
in a feasible timetable, it may not always be an optimal timetable since passenger
demand is often not included. The final category of timetabling models focuses on the
improvement of passenger satisfaction. These models minimise waiting time or the total
journey time for instance. Nevertheless, the resistance to change trains is usually high,
but often not included in the calculation.
In contrary to other timetabling models, the Strategic Passenger Oriented Timetabling
(SPOT) model, developed by Polinder (2020) and NS, is able to create a timetable with a
minimal PTT. However, the model is currently not used within the timetable development
process. Therefore, this research has investigated to what extent the SPOT model can be
used in this process, and hence support and speed up the design of new timetables.
6/82Strategic passenger-oriented timetable design with minimised passenger inconvenience
The SPOT model includes the resistance to change trains in the calculation of the PTT. In
the model it is assumed that each minute of in-vehicle time counts as 1 passenger-
minute, each minute of waiting time corresponds to 2 passenger-minutes, and each
transfer is awarded with a penalty of 20 passenger-minutes. A lower PTT is thus achieved
through an optimisation of waiting times and transfer penalties. It means that the model
can especially be used for determining arrival and departure times at transfer nodes.
Despite the fact that the model is unable to include infrastructural limitations, the results
are useful for determining which transfer possibilities are important at each node.
In order to validate this hypothesis, two case studies have been performed for the transfer
nodes Weesp and Zwolle. These cases have been selected based upon recent problems
during the development of post-COVID-19 timetable scenarios for NS. For each case
study, several elements of the current timetable and proposed scenarios have been
included in the input of the model, in order to analyse the effect on the timetable at the
specific node. The output of the model, consisting of the PTT, improvement potentials
for origin-destination pairs and dwell-time graphs, provided a clear overview of how each
experiment scored.
In the end, this study concludes that the SPOT model is especially applicable for studies
in which different timetable scenarios must be compared with each other. It can help to
illustrate the impact of decisions and trade-offs, so that different ideas on timetable
design can be assessed before making specific, conflict-free timetables. The model can
thus be used in the stage of exploratory research.
7/82Strategic passenger-oriented timetable design with minimised passenger inconvenience
Sammanfattning
Tidtabellsutveckling är en komplex process som är avgörande för en säker och effektiv
järnvägsdrift. Kombinationen av stålhjul och stålräl gör det möjligt att skapa tåg och
transportera många vagnar, med passagerare eller gods, samtidigt, men det leder också
till längre bromssträckor. Dessa bromssträckor överskrider ofta siktavståndet, vilket
innebär att tillräckligt avstånd mellan tågen måste bibehållas. Detta kräver en grundlig
planering av tågrörelser för att förhindra motstridiga tågvägar. Detta görs genom att
skapa ett tidsschema för olika tåg längs spåret, den så kallade tidtabellen.
Tidtabellen utgör ryggraden i järnvägsverksamheten, eftersom en tidtabell informerar en
passagerare när ett tåg avgår och anländer. För att attrahera passagerare bör tidtabellen
dock anpassas till kundernas efterfrågan. Tyvärr tenderar järnvägsoperationer att hantera
stora efterfrågevariationer över tid och inom nätverket. För att klargöra hur
passagerarefterfrågan fördelas uttrycks efterfrågan ofta i en matris för
ursprungsdestination. Varje cell i matrisen motsvarar antalet förväntade passagerare
mellan ett ursprung och en destination. Baserat på efterfrågefördelningen skapas ett
linjeupplägg. Ett linjeupplägg bestämmer tågets rutt och består av ett stoppmönster och
frekvens per tåg. Även om linjeplanen är viktig för tidtabellprocessen, resulterar ett
optimalt linjeupplägg inte automatiskt i en optimal eller genomförbar tidtabell.
Tidigare fokuserade tidtabellsutformningen på att minimera den totala restiden endast i
konfliktfria tidtabeller. Ändå har flera studier bekräftat behovet av periodiska och
symmetriska tidtabeller som har samma servicenivåer hela dagen och som är lätta att
minnas för passageraren. Dessa tidtabeller måste vara robusta så att en hög punktlighet
kan uppnås. Dessutom tar en ideal tidtabell också hänsyn till faktorer som fordonstid,
väntetid och antal byten, sammanfattade i den upplevda restiden (PTT). Det är dock
omöjligt att inkludera alla dessa element i en manuell tidtabellsplanering. Detta betonar
behovet av en tidtabellsmodell som kombinerar passagerares efterfrågan och
linjeupplägg för att beräkna en tidtabell med minimal PTT.
Flera olika tidtabellmodeller har utvecklats tidigare, där varje modell har sitt eget
fokusområde. Vissa modeller fokuserar på optimering av linjeplaner, så att linjeupplägget
ansluter de viktigaste ursprung-destinationsparen och att restiden mellan dessa par
minimeras. Dessa modeller tar dock inte hänsyn till specifika ankomst- och avgångstider.
Det kan alltså vara så att restiden blir hög för passagerare som måste byta tåg. Andra
modeller fokuserar på utvecklingen av konfliktfria tidtabeller, där infrastrukturen styr
tidtabellen. Även om detta kan resultera i en genomförbar tidtabell, kanske det inte alltid
är en optimal tidtabell eftersom passagerarefterfrågan ofta inte ingår. Den sista kategorin
av tidtabellmodeller fokuserar på förbättring av passagerarnöjdheten. Dessa modeller
minimerar till exempel väntetiden eller den totala restiden. Ändå är motståndet mot
tågbyte ofta högt, men ingår inte i beräkningen.
I motsats till andra tidsplaneringsmodeller kan SPOT-modellen, utvecklad av Polinder
(2020) och NS (den största persontågsoperatören i Nederländerna), skapa en tidtabell
med minimal PTT. I denna beräkning ingår motståndet mot byte av tåg. I modellen antas
att varje minut i fordonstiden räknas som 1 passagerarminut, varje minut väntetid
motsvarar 2 passagerarminuter och varje byte tilldelas ett straff på 20 passagerarminuter.
En lägre PTT uppnås således genom en optimering av väntetider och överföringsstraff.
Det betyder att modellen särskilt kan användas för att bestämma ankomst- och
avgångstider vid överföringsnoder. Trots det faktum att modellen inte kan inkludera
8/82Strategic passenger-oriented timetable design with minimised passenger inconvenience
infrastrukturella begränsningar är resultaten användbara för att bestämma vilka
bytesmöjligheter som är viktiga vid varje nod.
För att validera denna hypotes har två fallstudier utförts för bytesnoderna Weesp och
Zwolle. Dessa fall har valts ut baserat på de senaste problemen under utvecklingen av
tidtabellsscenarier efter COVID-19 för NS. För varje fallstudie har flera delar av den
aktuella tidtabellen och föreslagna scenarier inkluderats som indata till modellen för att
analysera effekten på tidtabellen vid den specifika noden. Utdata fran modellen,
bestående av PTT, förbättringspotentialer för par ursrungs- och detinationspar och grafer
för uppehållstid gav en tydlig översikt över resultatet från varje experiment.
Slutligen drar denna studie slutsatsen att SPOT-modellen är särskilt användbar för studier
där olika tidtabeller måste jämföras med varandra. Den kan hjälpa till att visa effekterna
av beslut och kompromisser, så att olika idéer om tidtabellsupplägg kan utvärderas innan
man gör specifika, konfliktfria tidtabeller. Modellen kan alltså användas i ett tidigt skede.
9/82Strategic passenger-oriented timetable design with minimised passenger inconvenience
Samenvatting
Het ontwikkelen en ontwerpen van dienstregelingen is een complex proces dat cruciaal
is voor een veilig en efficiënt vervoer per spoor. De combinatie van stalen wielen op stalen
spoorstaven zorgt ervoor dat het mogelijk is om meerdere voertuigen te combineren en
treinen samen te stellen, en zodoende veel reizigers of goederen op hetzelfde moment
te verplaatsen. Echter, de combinatie van staal op staal zorgt ook voor lange remwegen.
Doordat deze remwegen de zichtafstand vaak overschrijden, moet er gewaarborgd
worden dat treinen altijd op voldoende afstand van elkaar rijden. Hiervoor is een strakke
en uitvoerige planning benodigd, waardoor conflicten worden voorkomen en treinen niet
voor een rood sein tot stilstand komen. Deze planning definieert voor elke trein het
tijdspad over een bepaald traject, de zogenaamde dienstregeling.
De dienstregeling vormt de ruggengraat van de treindienst, onder andere omdat deze de
reizigers informeert wanneer een trein vertrekt en aankomt. Echter, om reizigers te
werven is het belangrijk dat de dienstregeling overeenkomt met datgene wat de reiziger
wil. Het nadeel is dat vervoer per spoor vaak te maken heeft met een variërende vraag.
Om inzicht te geven hoe deze reizigersvraag zich verhoudt tot het netwerk, wordt de
reizigersvraag vaak uitgedrukt in een herkomst-bestemmingsmatrix. Elke cel in de matrix
correspondeert met het aantal verwachte reizigers tussen een specifieke vertrek- en
aankomstlocatie. Op basis van de verdeling van de reizigersvraag wordt vervolgens een
lijnvoeringsontwerp gemaakt. De lijnvoering bepaalt de route, frequentie en het
stoppatroon van een trein. Hoewel een lijnvoering belangrijk is in het ontwerpproces,
garandeert een optimale lijnvoering niet automatisch een optimale dienstregeling.
In het verleden werd er bij het maken van het dienstregelingsontwerp vooral gefocust op
het minimaliseren van de pure reistijd binnen een conflictvrije dienstregeling. Meerdere
studies hebben echter aangetoond dat de reiziger vooral behoefte heeft aan een
repeterende en symmetrische dienstregeling, waarbij de reiziger de dienstregeling
eenvoudig kan onthouden en de reiskwaliteit constant is. Deze dienstregeling moet
robuust zijn, zodat een hoge punctualiteitsgraad behaald kan worden. Bovendien richt
het ontwerp zich niet enkel op het minimaliseren van de pure reistijd, maar wordt er
gekeken naar het totaalplaatje van in-treintijd, wachttijd en aantal keer overstappen. Dit
is de zogenaamde gegeneraliseerde reistijd (GRT). In een handmatig ontworpen
dienstregeling is het onmogelijk om al deze factoren in acht te nemen. Er is dan ook
behoefte aan een dienstregelingsmodel dat reizigersvraag en lijnvoering combineert,
zodat een ontwerp gemaakt kan worden waarbij de GRT wordt geminimaliseerd.
Door de jaren heen zijn er diverse modellen ontwikkeld, waarbij de meeste modellen zich
richten op een specifiek onderdeel van het dienstregelingsprobleem. Sommige modellen
hebben als doel om de lijnvoering te optimaliseren, zodat het ontwerp altijd de
belangrijkste herkomsten en bestemmingen met elkaar verbindt. Een nadeel is dat op dit
niveau er nog geen specifiek vertrek- en aankomsttijden bepaald kunnen worden,
waardoor uiteindelijk de reistijd enorm kan toenemen voor reizigers die moeten
overstappen. Andere modellen focussen juist op het genereren van conflictvrije
dienstregelingen, waarbij de aanwezige infrastructuur leidend is voor de dienstregeling.
Hoewel dit de uitvoerbaarheid van de dienstregeling garandeert, is dit veelal niet de
meest wenselijke dienstregeling omdat de reizigersvraag hierin niet wordt meegenomen.
Tenslotte zijn er modellen die de klantbeleving proberen te verbeteren door bijvoorbeeld
de totale wacht- of reistijd te minimaliseren. Desalniettemin is hierin de weerstand om
over te stappen vaak niet inbegrepen, terwijl dit wel van grote invloed kan zijn.
10/82Strategic passenger-oriented timetable design with minimised passenger inconvenience
In tegenstelling tot andere modellen is het door Polinder (2020) en NS ontwikkelde SPOT-
model in staat om een dienstregeling te berekenen met een minimale GRT en dus tot
een beter ontwerpvoorstel te komen. Echter, het SPOT model wordt momenteel nog niet
gebruikt in het daadwerkelijke dienstregelingsontwerpproces. Dit onderzoek richt zich
daarom op de vraag in hoeverre het SPOT model kan worden gebruikt bij het ontwerpen
van nieuwe dienstregelingen, en zodoende het proces te ondersteunen en te versnellen.
In de berekening van de GRT is de weerstand om over te stappen inbegrepen. In het
model wordt aangenomen dat elke minuut aan in-treintijd telt voor 1 reizigersminuut,
elke minuut aan wachttijd telt voor 2 reizigersminuten, en er voor elke overstap een boete
van 20 reizigersminuten wordt opgelegd. Een lagere GRT wordt dus behaald bij het
optimaliseren van de wachttijd en het aantal overstapboetes. Dit betekent dat het model
gebruikt kan worden voor het bepalen van de ideale aankomst- en vertrektijden op
overstapstations. Hoewel het SPOT-model geen rekening houdt met infrastructurele
beperkingen, kunnen de resultaten worden gebruikt om per station te bepalen welke
overstaprelaties van belang zijn.
Om deze hypothese te bevestigen zijn in dit onderzoek twee experimenten uitgevoerd
voor de overstapstations Weesp en Zwolle. Deze locaties zijn gekozen op basis van
recente studies binnen NS op het gebied van een post-corona dienstregeling. Voor elk
experiment zijn bepaalde elementen van de huidige dienstregeling alsmede van de
voorgestelde post-corona dienstregeling in het model geladen. Op deze manier kunnen
de effecten op de dienstregeling voor de specifieke locatie in kaart worden gebracht en
geanalyseerd. De uitkomsten van het model bestaan uit de GRT, verbeterpotentie per
herkomst-bestemmingspaar en halteertijdgrafieken, welke vervolgens een duidelijk
beeld geven van hoe ieder experiment scoort.
Uiteindelijk is op basis van deze experimenten geconcludeerd dat het SPOT-model
geschikt is voor langetermijnstudies waarbinnen verschillende dienstregelingsvoorstellen
met elkaar moeten worden vergeleken. Het model kan daarbij inzicht bieden in de impact
en afwegingen die in het ontwerp gemaakt moeten worden. Op deze manier kunnen
verschillende gedachtegangen al beoordeeld worden voordat er een gedetailleerde,
conflictvrije dienstregeling ontworpen wordt. Daarmee is het model dus toepasbaar in
de fase van het verkennend dienstregelingsonderzoek.
11/82Strategic passenger-oriented timetable design with minimised passenger inconvenience
Table of contents
Acknowledgements 5
Abstract 6
Sammanfattning 8
Samenvatting 10
List of figures 14
List of tables 17
1 Introduction 18
1.1 Background 18
1.2 Project description 18
1.3 Objectives, scope and limitations 19
1.4 Research questions 20
1.5 Methodology 21
1.6 Thesis structure and reading guide 22
2 Tactical timetable development and validation 23
2.1 The history and basic elements of the timetable 23
2.2 The requirements and variables of timetables 25
2.3 Current line plan and timetable design models 29
2.3.1 Models that optimise line plans 29
2.3.2 Models that create conflict-free timetables 30
2.3.3 Models that improve passenger satisfaction 30
2.3.4 Strategic Passenger Oriented Timetabling (SPOT) model 31
2.4 General output of the SPOT model 31
2.4.1 Improvement potential per origin-destination pair and per passenger 32
2.4.2 Total perceived travel time 33
2.4.3 Optimal arrival and departure times 33
3 Case studies based on post-COVID-19 scenarios 35
3.1 Post-COVID-19 scenarios 35
3.1.1 Optimisation of running times: ‘faster over longer distances’ 36
3.1.2 Optimisation of connections: ‘direct links’ 36
3.1.3 Optimisation of frequencies: ‘flat timetable’ 36
3.2 Case selection and generalisation 37
3.2.1 Selection of the Weesp case study 39
3.2.2 Selection of the Zwolle case study 40
3.3 Data collection and preparation 42
3.3.1 Input data for the network and passenger distribution 42
3.3.2 Input data for the line design of the Weesp case study 43
3.3.3 Input data for the line design of the Zwolle case study 46
3.4 Internal validation of the results 49
12/82Strategic passenger-oriented timetable design with minimised passenger inconvenience
4 Transfer stations Weesp and Zwolle: optimal arrival and departure times 50
4.1 Experimental results for the smaller transfer node Weesp 50
4.1.1 Current line design with current arrival and departure times 51
4.1.2 Current line design with no arrival and departure time restrictions 53
4.1.3 Proposed line design with proposed arrival and departure times 55
4.1.4 Proposed line design with no arrival and departure time restrictions 57
4.2 Experimental results for the greater transfer node Zwolle 60
4.2.1 Current line design with perfect node 61
4.2.2 Current line design with no transfer restrictions 63
4.2.3 Proposed line design with no transfer restrictions 65
5 Conclusion 68
5.1 Research questions 68
5.2 Recommendations 70
6 Discussion 71
6.1 Limitations 71
6.2 Future research 72
7 References 74
List of Appendices 77
Appendix A List of station abbreviations – Weesp 78
Appendix B List of station abbreviations – Zwolle 79
Appendix C List of excluded OD-pairs – Weesp 80
Appendix D List of excluded OD-pairs – Zwolle 81
13/82Strategic passenger-oriented timetable design with minimised passenger inconvenience
List of figures
Figure 2.1: Timetable performance indicators as Feasibility, Customer-Attractiveness
and Financial Result can be displayed as a triangle where each factor is
dependent on another.
Figure 2.2: List of origin-destination pairs, displaying the highest improvement
potential for one passenger (IPPP) and for all passengers (IP) traveling
between the two specific stations.
Figure 2.3: Output for the total perceived travel time, either calculated for when
passengers take the next train, or wait for the best train.
Figure 2.4 Output for the optimal timetable, in which the specific train, location,
activity (arrival or departure) and the minute the activity takes place is
listed.
Figure 2.5 Dwell-time graph for Amersfoort Schothorst (Amfs).
Figure 3.1: Railway map of The Netherlands, pointing out the locations of Zwolle and
Weesp, and why these places are important transfer stations (Nederlandse
Spoorwegen, 2021).
Figure 3.2: Platform occupation diagram of Weesp, showing the current transfer
possibilities in green for one hour. Approximately every 15 minutes there
is the possibility to transfer from Hilversum (Hvs)/Almere Centrum (Alm)
to Amsterdam Centraal (Asd)/Hoofddorp (Hfd) and vice versa.
Figure 3.3: Platform occupation diagram of Weesp, showing the proposed transfer
possibilities in green for one hour. For this scenario, there are only two
possibilities per hour to transfer from Hilversum (Hvs)/Almere Centrum
(Alm) to Amsterdam Centraal (Asd)/Hoofddorp (Hfd) and vice versa.
Figure 3.4: The transfer station of Zwolle is defined by its possibility to change trains
around 15 and 45 minutes past the hour.
Figure 3.5: The (intermediate) stations on the railway line between Leeuwarden and
Zwolle.
Figure 3.6: Map of railway stations that are included for the Weesp (Wp) experiment.
Figure 3.7: Map of railway stations that are included for the Zwolle (Zl) experiment.
Figure 4.1: Dwell-time graph for Weesp, according to the current line design and
timetable. It illustrates that transfers between the 4300 and 5800 series
are assured, similar to the 4600 and 5700 series.
Figure 4.2: List of origin-destination pairs, sorted by highest improvement potential
per passenger (IPPP) and highest improvement potential for all passengers
(IP), corresponding to the current line design and timetable.
14/82Strategic passenger-oriented timetable design with minimised passenger inconvenience
Figure 4.3: Dwell-time graph for Weesp, according to the current line design, but
without any time restrictions. It illustrates that most transfers are still
ensured, except for the T4300 to T5800, but that the times have shifted
to create 15/15 and 14/16 intervals.
Figure 4.4: List of origin-destination pairs, sorted by highest improvement potential
per passenger (IPPP) and highest improvement potential for all passengers
(IP), corresponding to the current line design, but without arrival or
departure time restrictions.
Figure 4.5: Dwell-time graph for Weesp, according to the proposed line design and
timetable. It illustrates that the possibilities to quickly change trains have
more or less disappeared.
Figure 4.6: List of origin-destination pairs, sorted by the highest improvement
potential per passenger (IPPP) and highest improvement potential for all
passengers (IP), corresponding to the proposed line design and timetable.
Figure 4.7: Dwell-time graph for Almere Centrum, where direct trains towards
Amsterdam Centraal (T2600, T4600 and T5800) depart with intervals of
respectively 4, 8 and 18 minutes, resulting in a greater improvement
potential per passenger.
Figure 4.8: Dwell-time graph for Weesp, according to the proposed line design, but
without any departure or arrival restrictions. It illustrates that even with a
modified line design the most optimal timetable consists of a transfer
node at Weesp.
Figure 4.9: List of origin-destination pairs, sorted by the highest improvement
potential per passenger (IPPP) and highest improvement potential for all
passengers (IP), corresponding to the proposed line design, but without
arrival or departure time restrictions.
Figure 4.10: Dwell-time graph for Zwolle, according to the current line design and
timetable. It illustrates the symmetric transfer opportunities at :15/:45,
except for the 4600 series.
Figure 4.11: List of origin-destination pairs, sorted by the highest improvement
potential per passenger (IPPP) and highest improvement potential for all
passengers (IP), corresponding to the current line design and timetable.
Figure 4.12: Dwell-time graph for Zwolle, according to the current line design, but
without any transfer restrictions. It illustrates that most trains are
scheduled so that symmetric transfers are still offered at :15 and :45.
Figure 4.13: List of origin-destination pairs, sorted by highest improvement potential
per passenger (IPPP) and highest improvement potential for all passengers
(IP), corresponding to the current line design, but without transfer
restrictions.
Figure 4.14: Dwell-time graph for Zwolle, according to the proposed line design
without transfer restrictions.
15/82Strategic passenger-oriented timetable design with minimised passenger inconvenience
Figure 4.15: List of origin-destination pairs, sorted by highest improvement potential
per passenger (IPPP) and highest improvement potential for all passengers
(IP), corresponding to the proposed line design without transfer
restrictions.
Figure 4.16: Dwell-time graph for Assen, showing unequally distributed intervals
between successive trains.
16/82Strategic passenger-oriented timetable design with minimised passenger inconvenience
List of tables
Table 3.1: List of series, frequencies and routes for the Weesp case, according to the
current line design.
Table 3.2: List of series, frequencies and routes for the Weesp case, according to the
proposed line design.
Table 3.3: List of series, frequencies and routes for the Zwolle case, according to the
current line design.
Table 3.4: List of series, frequencies and routes for the Zwolle case, according to the
proposed line design.
Table 4.1: Summary of the results for the four experiments performed for Weesp.
Table 4.2: List of transfer possibilities at Weesp, current arrival and departure times,
and the modified arrival and departure times used in the SPOT model.
Table 4.3: List of transfer possibilities at Weesp, proposed arrival and departure
times, and the modified arrival and departure times used in the SPOT
model.
Table 4.4: Summary of the results for the three experiments performed for Zwolle.
Table 4.5: List of transfer possibilities at Zwolle, current arrival and departure times,
and the modified arrival and departure times used in the SPOT model.
17/82Strategic passenger-oriented timetable design with minimised passenger inconvenience
1 Introduction
1.1 Background
The Netherlands has one of the busiest passenger railway networks in the world.
Netherlands Railways, known as Nederlandse Spoorwegen and abbreviated as NS, is the
major passenger operator on the Dutch railway network. With the operation of
approximately 5,000 trains per day, 30 shunting yards and more than 6,000 crew
members (Nederlandse Spoorwegen, 2020), a good organisation of the logistical
framework is required. This logistical framework is mainly determined by the timetable.
Long-term timetable designs will often place demands on the infrastructure, and
influence the number of vehicles and number of crew members required. The opposite
is true for the short-term timetable design, which is governed by the infrastructure,
number of vehicles and crew members available. Long-term timetables are thus less
constrained and should be designed according to passenger forecasts and demand
estimations, although reality with respect to infrastructure must be kept in mind. Despite
many studies and models that have proven to be of useful help in the design process, the
designs are primarily made based on history, expert judgement and experience.
The timetable is basically a summary of the product NS is offering to their customer: train
services for the railway passenger. The demand for railway transportation forms the input
for the design of the different lines that are operated. Nevertheless, due to the COVID-
19 pandemic, passenger behaviour is most likely expected to change permanently. For
example, people will work from home more often and do not travel by train during rush
hour anymore (Petersen, 2020). This change in behaviour has a direct impact on
passenger demand predictions and hence on the timetable, since current line designs do
not longer represent the actual situation. However, the current design process does not
allow to respond to passenger demand changes quickly, for instance because of
unavailability of supporting computer tooling. This emphasises the need for new models
that can assist in assessment and decision making with respect to the timetable design
processes.
1.2 Project description
NS has developed several possible scenarios that might facilitate the expected structural
change in passenger demand after COVID-19. In the current design process, a timetable
design must be complete and free of conflicts (i.e. trains are not scheduled at the same
time at the same specific location) before it can be evaluated on its performance. This
assessment takes place by doing a Treno-test, in which a timetable can be assessed on
customer-attractiveness, financial result and feasibility (a more detailed explanation of
Treno is included in §2.2). Since this process requires a lot of time and effort, not all
possible designs can always be assessed.
On behalf of the NS department Process Quality & Innovation (PI), Gert-Jaap Polinder
(2020) has developed a Strategic Passenger Oriented Timetabling (SPOT) model in which
a timetable for one repeating hour (corresponding to a certain line design) is generated,
based on the input of lines and passenger demand. The SPOT model is designed in such
a way that it minimises the perceived travel time for the passenger. A lower perceived
travel time means less ‘pain’ (passenger inconvenience) for the passenger, hence the
company’s performance and attractiveness will improve. An extensive description of the
SPOT model, its functions and the output produced can be found in §2.3.
18/82Strategic passenger-oriented timetable design with minimised passenger inconvenience
The SPOT model is able to create a timetable based on the input of lines and passenger
demand. This raises the question whether the SPOT model may allow NS to calculate the
productivity, expressed as perceived travel time, of a certain line design before timetables
have been developed in detail. In theory, this enables a more efficient design process and
selection in case of multiple timetable proposals, because the alternatives can be
evaluated beforehand. Nevertheless, the SPOT model has originally been developed for
research purposes only and has not been tested yet on real timetabling problems. The
primary goal was to come up with methods that contribute to the development of
timetables long before the actual operation of the timetable takes place, which has
resulted in the SPOT model. Although the underlying aim of Polinder’s research was to
support and speed up the timetable design process, the applicability on specific
timetabling problems and implementation within the this process were not considered
at that time. That is why this master thesis project focuses on the role the SPOT model
can play within the development and assessment of timetables, and whether the model
can assist in this process.
First, a literature study on timetable development and relevant variables will be
performed. This study should make clear which variables influence the timetable design.
Another aspect that will be investigated is generic timetable requirements. For instance,
cyclic timetables, where headways of trains with the same pattern are equally distributed,
might sound attractive for the passenger, but may not result in an optimal timetable. The
literature study will therefore dive into the role and influence of generic timetable
requirements. Besides, current models used for line design and timetabling will be
discussed. This will exemplify why the SPOT model differs from other timetable models.
The next step is to investigate to what extent the SPOT model can be of use within the
timetable design process. Problems originating from the different post-COVID-19
scenarios will be used as case studies. For each scenario certain assumptions have been
made during the design process that have led to the current design. These assumptions
were primarily based on outputs from line planning studies and expert judgement. During
the case study it will be investigated how the timetable generated by the SPOT model
will perform if other assumptions are being been made. The results will be evaluated with
respect to the generated number of passenger-minutes (total perceived travel time). The
results from the literature study will be used to analyse the different designs and propose
improvements based on the different variables and requirements identified.
1.3 Objectives, scope and limitations
In general, the aim of the research is to contribute to an efficient timetable development
and planning process. A good timetable increases the attractiveness of railway
transportation and allows to make optimal use of the available railway capacity. In the
end, this leads to a better utilization of the assets, a reduction of (perceived) travel time
and a reduction of costs. The railway system will therefore be able to better compete
with other transport modes, like the automotive and aviation business. It means that an
improved timetable design can lead to more sustainable form of transportation.
The current design process is mainly driven by the line planning studies, experience and
expert judgement. With increasing complexity of the network, this may not always lead
to an optimal solution. The objective of this master thesis is therefore to make clear
whether and to what extent the SPOT model can be used in the design and development
process for timetables at NS. The research aims to investigate:
19/82Strategic passenger-oriented timetable design with minimised passenger inconvenience
• What factors influence timetable design and the design process;
• Why the SPOT model differs from other timetabling models; and
• How the SPOT model can be used to assess and value different timetable designs.
The literature study will therefore describe generic design requirements of a timetable
and the corresponding development process. For this research, the focus will be on the
tactical design phase only, i.e. timetable designs for one to five years ahead. The SPOT
model may perhaps assist in the strategic and operational as well, but that will be out of
scope for this research. Besides, the goal of this research is not to investigate how the
SPOT model can be optimised and, for example, deliver a complete and feasible
timetable. The study will focus on how the current model can assist in the current
development process only. In order to investigate this role, two design problems from
post-COVID-19 studies are used. The development of the scenarios has already finished.
Therefore, it is not the objective to see how these designs can be improved, but to use
the COVID-19 situation as a cause for needing alternative timetable designs.
1.4 Research questions
The SPOT model is a newly developed tool that might be able to assist in the decision
making process for long-term timetable designs. The model was originally developed for
academic purposes only, but the question has been raised whether the model could be
implemented in daily operations as well. That is why the objective of this research is to
investigate the possibilities for implementing the SPOT model in the process of timetable
development. Accordingly, the following research question has been formulated:
To what extent can the SPOT model be used in the long-term timetable design process?
In order to investigate the utility of the model within the timetable design process, it is
important to identify and analyse relevant factors that contribute to this process. This will
require a better grasp on the development process of railway timetables, by asking
questions like ‘Where does the need for railway timetables originate from?’, ‘Why is a
railway timetable important for safe railway operations?’ and ‘How do timetables
contribute to a better utilisation of railway capacity?’. After defining the need for
timetables in general, it is important to define the needs and elements of a specific
timetable. ‘What is the difference between periodic and aperiodic timetables?’, ‘Why is it
important for a timetable to be robust?’, ‘How does passenger demand influence the
timetable?’ and ‘What are the advantages of timetables that are cyclic, symmetric and
reliable and how can this be achieved?’ are questions of which the answers will help to
increase understanding the timetabling problem.
Although the SPOT model might be recently developed, many other studies have already
investigated timetable-related problems. It is useful to look into the conclusions of these
studies to see what are the unexplored areas within this field of research. This is achieved
by asking questions such as ‘What timetabling models have already been developed and
how do they contribute in the timetabling design process?’, ‘What is the difference
between the SPOT model and existing timetabling models?’ and ‘What are the limitations
and opportunities of the SPOT model?’.
20/82Strategic passenger-oriented timetable design with minimised passenger inconvenience
After investigating the theoretical framework of timetabling and the SPOT model, the
practical applicability of the model should be examined and validated as well. In order to
check for this applicability, it is preferred to use realistic problems to see whether the
SPOT model can contribute in finding solutions. For this purpose, problems of the recent
post-COVID-19 scenarios will be used. However, this raises the question ‘Which timetable
trade-offs and considerations have been dealt with during the development of timetables
for the post-COVID-19 scenarios?’. When the problems have been selected, the following
questions should be answered: ‘Why are these problems relevant to consider for the
validation of the SPOT model?’, ‘To what extent is the model able to deal with these
problems and what changes need to be made to improve this ability?’ and ‘When is a
solution considered to be valid and what are the costs of a solution?’.
1.5 Methodology
The answer to timetabling problem investigated in this research is not evident, especially
because the main research question has been formulated relatively broad. This is,
however, done on purpose. Since the SPOT model is currently not used in any of the
timetable design stages, the options of implementing the model are all unexplored. To
know how the model can contribute to the design process, it is important to have a better
understanding of timetable design in general first. This knowledge is gathered through
a literature study, focusing on basic information, requirements and variables of the
timetable, supplemented with a study on existing timetabling models. The study should
provide qualitative answers on the theoretical research questions introduced in the
previous section (§1.4).
This qualitative data is primarily collected through extensive analyses of other scientific
studies on timetable design processes, timetable optimisation and timetable modelling,
thus through using secondary data. The main reason for this is that several studies have
investigated more or less similar topics, which means that the data is easily accessible
and already validated. For the data selection, two important criteria were used. First of
all, the data should in general not be older than 2010, so that it takes into account the
recent developments on railway capacity scarcity and the inherent need for timetable
optimisation. Studies older than 2010 do not always emphasise the need for these
developments, because railway traffic was not as frequent as it is today. A second criteria
is that the data is preferably generated through studies of Japanese, Swiss, German or
Dutch railway problems, because these countries operate a railway network that is similar
to the network of NS. Nevertheless, for some specific questions, information older than
2010 and/or studies on other countries than the ones mentioned above have been used,
because of similar cases and/or significant conclusions.
The second part of the research consists of quantitative data collection through
experiments with the SPOT model. The selection of experiments is based on the problems
that occurred during the development of the post-COVID-19 scenarios, because these
problems reflect actual situations that need to be dealt with during the timetable design
process. After considering several options, the problems of Weesp and Zwolle station
have been used as case studies. A detailed explanation of why these stations have been
selected to investigate is included in §3.2, but both nodes are considered as important
transfer nodes in the overall network design. Nevertheless, this is primarily based on
experience and expert judgement. It is therefore interesting to investigate the actual
relevance of the transfer function by using the SPOT model for these cases.
21/82Strategic passenger-oriented timetable design with minimised passenger inconvenience
The output of the model is the perceived travel time (PTT), hence the PTT will form the
basis for the analysis of the results. Since the model is not constrained by the
infrastructure, the model is not able to calculate the PTT for the current design proposal.
However, the line design, frequencies and stopping patterns are available. That is why
the model is ran with the same input as the design proposal and without any
modifications, to establish a reference PTT. The reference can be used to analyse and
validate the effects of modifications. A more detailed methodology on how data is
collected and analysed is included in §3.3.
1.6 Thesis structure and reading guide
This thesis follows the structure as provided by the methodology. First of all, the literature
study on tactical timetable development and validation is presented in Chapter 2. This
study starts with an investigation of the history and basic elements of a railway timetable
(§2.1). Based upon the basic elements of a timetable, the requirements and variables that
influence timetable design are studied (§2.2). Subsequently, different existing
timetabling models have been examined, followed by a comparison between these
models and the recently developed SPOT model (§2.3). Finally, the output of the SPOT
model is presented and described (§2.4).
In order to investigate the role of the SPOT model in future timetabling studies, two case
studies have been performed. Chapter 3 forms the start of the experiments. The chapter
starts with an introduction of the post-COVID-19 scenarios, which are the reason of this
research (§3.1). Based upon the timetabling decisions encountered during the scenario
development processes, two problems have been selected to be used as case studies
(§3.2). The process of data collection and preparation for the model and each of the case
studies is described (§3.3). In the end, the internal validity of the results is discussed
(§3.4). Chapter 4 continues with a description of how the experiments are executed and
which results are obtained. First of all, the results of the case study on the smaller transfer
node Weesp are presented (§4.1), followed by the results of the case study on the greater
transfer node Zwolle (§4.2).
The results from the literature study and the experiments are used to draw final
conclusions in Chapter 5. The conclusion starts with answering the research questions
that were presented in this introduction (§5.1), followed by listing the recommendations
bases on the conclusions (§5.2). In line with the conclusion, the discussion in Chapter 6
presents the limitations of the research (§6.1) and what topics can be investigated in
future research (§6.2). In the end, a list of references used for this research is included in
Chapter 7.
22/82Strategic passenger-oriented timetable design with minimised passenger inconvenience
2 Tactical timetable development and validation
Timetable development is a process that is spread over several time periods. Strategic
timetables are usually developed between 5 to 20 years ahead and the primary goal is to
investigate how demand for rail transportation will change (and often grow) and what
infrastructural changes are required in order to fulfil this demand in the most efficient
manner. In contrary, operational timetable designs are made within one year before the
actual day of operation and focus on how the available infrastructure and assets (rolling
stock, crew, shunting yards, etc.) can be used effectively. Tactical timetable designs form
the connection between the two and play an important role in the transformation from
rough sketches in the strategic phase to a feasible planning in the operational phase
(Robenek et al., 2015).
This chapter focuses on the timetable development process in this tactical stage by
pointing out the history and need for timetables first (§2.1), followed by an extensive
literature review on timetable requirements and variables (§2.2), and how the SPOT
model differs from other models that are currently used in timetable design and
validation processes (§2.3). Finally, the general output of the SPOT model is presented
and discussed with respect to how the output can be used for analysing the results (§2.4).
2.1 The history and basic elements of the timetable
The history of railway traffic goes back to approximately 200 years ago, when the first
public railway was opened in the United Kingdom. Many things have changed since then,
for example steam locomotives have been replaced by electric multiple units and different
track gauges have mostly been uniformed into normal gauge track (1.435 mm).
Nevertheless, the fundamental concept of rail transportation has not changed: vehicles
with steel wheels are being moved over steel rails. Each pair of wheels is connected
through a rigid axle to form a wheelset. This ensures that both wheels will roll in parallel
at the same rotational velocity. Besides, each wheel is equipped with a wheel flange and
a conical profile on the tread. A conical profile results in different wheel diameters,
dependent on the point of contact on the wheel tread. This allows the wheelset to
compensate for lateral displacements in curves and hence to follow the track. The two
rails are installed with a fixed distance from each other, the so-called track gauge. Instead
of most other vehicles, trains are guided by the infrastructure, i.e. the track. This means
that trains do not have the ability to avoid obstacles or other trains on the (same) track.
In other words, the route of the train is pre-determined (Andersson et al., 2018).
The combination of steel wheels and steel rails comes with a lot of benefits. First of all,
the ability for wheelsets to steer itself makes it possible to couple many vehicles together
and thus to form trains. Since trains are guided by the tracks, higher operational speeds
are allowed, which results in a high throughput capacity. The greatest advantage is,
however, that steel wheels on steel rails result in a very small contact patch, hence a low
friction between the two. This low friction is the reason why railway transportation is
successful, because it comes with a low rolling resistance. This allows heavy goods to be
transported easily with a relatively low less energy consumption.
On the other hand, the low friction comes with a downside as well since friction is
necessary to transfer wheel-rail longitudinal forces. This type of friction is referred to as
adhesion and is required for transferring traction forces (acceleration) and braking forces
23/82Strategic passenger-oriented timetable design with minimised passenger inconvenience
(deceleration). A low adhesion thus means that longer distances for acceleration and
deceleration are required. For acceleration this is not that much of a problem, but for
deceleration it comes with a safety issue, knowing that trains do not have the ability to
steer aside any other objects or vehicles on the track. Additionally, at higher speeds
braking distance often exceeds sight distance. This means that sufficient distance
between trains must be maintained and that trains that (partially) use the same tracks
are dependent on each other.
To maintain sufficient distance between following trains and prevent collisions with
opposing traffic, traffic control systems have been introduced. The basic elements of
these systems are signals and switches that are necessary to assure safe train movements.
In order to do so, tracks can be divided into stations and lines. A station is a location
where at least one switch is installed, so that trains can take different paths. Since
stations may not be located closely to each other, stations are connected through lines.
The lines have been divided into (several) sections, also known as blocks. Each block is
separated by signals and only one train per block is allowed. The signals provide the train
with a movement authority and indicate the maximum speed that is necessary to
maintain sufficient distance. Since braking distances are long, signals do not only provide
the driver with information about the following block, but sometimes up to four blocks
ahead. This allows a train to brake safely and stop before the first occupied block. These
braking distances are thus dependent on the location of signals, i.e. the length of the
blocks. The block length and number of blocks therefore determine the capacity of a line.
To maximise use of the available railway capacity on both lines and stations, a thorough
planning of train movements is needed. The main goal is to prevent conflicting train paths
and to make sure that trains will not have to stop for red signals. In order to do so, trains
must be separated with regard to location and time (Andersson et al., 2018). This is done
by creating a time schedule for different train paths along the track, the so-called
timetable. The timetable design dependents on three factors: the available infrastructure,
the possibilities with respect to other trains and the characteristics of the actual train.
The available infrastructure determines which tracks can be used and what interval time
or headway between trains must be applied. It is important to notice that headways will
increase when stops, for instance at intermediate stations, are included. If a preceding
train stops at a certain location this means that a following train is being prevented from
proceeding. The same accounts for when the preceding train operates at a lower speed
than the following train. The introduction of switches and hence the possibility of
different train paths allow the infrastructure to be used more flexible. For instance, slower
trains can be overtaken by faster trains. The slower train will be diverted onto a another
track (usually at a station) while a faster train overtakes. The slower train will continue its
way after the faster train has passed. This will result in a delay for the slower train, but
does not slow down the faster train and reduces the mutual headway. Another example
is when trains on single track stop at a station with multiple tracks to pass each other.
The infrastructure also determines the permitted speed for each train. The speed is a key
factor in creating timetables because it determines the required running time between
two stations. Besides the infrastructural limitations (usually curves, switches and grades),
the performance characteristics for each train should be taken into account. Different
type of trains (intercity trains, commuter trains, freight trains, etc.) have different
operational characteristics. The performance of each train is mainly determined by the
permitted speed for the actual train, the tractive force, the running resistance, and the
braking performance (Andersson et al., 2018).
24/82You can also read