ESMA Working Paper No. 1, 2020 Market impacts of circuit breakers - Evidence from EU trading venues - europa.eu
←
→
Page content transcription
If your browser does not render page correctly, please read the page content below
ESMA Working Paper
 No. 1, 2020
Market impacts of circuit breakers – Evidence from EU
 trading venues
 Cyrille Guillaumie, Giuseppe Loiacono, Christian Winkler, Steffen Kern

 January 2020| ESMA/2020/ WP-2020-1
ESMA Working Paper No. 1, 2020 2

 ESMA Working Paper, No. 1, 2020

 Authors: Cyrille Guillaumie, Giuseppe Loiacono, Christian Winkler, Steffen Kern
 Authorisation: This Working Paper has been approved for publication by the Selection Committee and reviewed by
 the Scientific Committee of ESMA.

 © European Securities and Markets Authority, Paris, 2020. All rights reserved. Brief excerpts may be reproduced or
 translated provided the source is cited adequately. Legal reference of this Report: Regulation (EU) No 1095/2010 of the
 European Parliament and of the Council of 24 November 2010 establishing a European Supervisory Authority
 (European Securities and Markets Authority), amending Decision No 716/2009/EC and repealing Commission Decision
 2009/77/EC, Article 32 “Assessment of market developments”, 1. “The Authority shall monitor and assess market
 developments in the area of its competence and, where necessary, inform the European Supervisory Authority
 (European Banking Authority), and the European Supervisory Authority (European Insurance and Occupational
 Pensions Authority), the ESRB and the European Parliament, the Council and the Commission about the relevant micro-
 prudential trends, potential risks and vulnerabilities. The Authority shall include in its assessments an economic analysis
 of the markets in which financial market participants operate, and an assessment of the impact of potential market
 developments on such financial market participants.” The charts and analyses in this report are, fully or in parts, based
 on data not proprietary to ESMA, including from commercial data providers and public authorities. ESMA uses these
 data in good faith and does not take responsibility for their accuracy or completeness. ESMA is committed to constantly
 improving its data sources and reserves the right to alter data sources at any time.

 European Securities and Markets Authority (ESMA)
 Risk Analysis and Economics
 201-203, rue de Bercy
 FR–75012 Paris
 risk.analysis@esma.europa.eu

ESMA Working Paper Number 1, 2020 3

 Market impacts of circuit breakers –
 Evidence from EU trading venues1

Cyrille Guillaumie2, Giuseppe Loiacono3, Christian Winkler4, Steffen Kern5
 January 2020

 Abstract

Sudden and drastic price swings in financial markets can be a source of market instability and
are a concern for market participants, supervisors and regulators. Circuit breakers (CBs) are
key instruments for trading venues to interrupt excessive price movements. Using a unique
database of CBs, which were triggered between 1 April 2016 and 31 December 2016 on a
sample of 10,000 financial instruments traded on EU trading venues, we analyse market
impacts of CBs. We find that price volatility is significantly lower after the CB, while bid-ask
spreads widen and the price discovery process is not negatively affected by the CB. We take
advantage of the cross-venue character of our database to contribute to the discussion on cross-
venue CB coordination. Cross-listed instruments traded in continuous trading on satellite
markets during a CB on the reference market experience a “hidden CB”. Despite being in
continuous trading, trading activity on the satellite market decreases drastically and liquidity
dries up as investors refrain from trading waiting for the reference market to set the CB auction
price.
JEL Classifications: G10, G11, G14
Keywords: Circuit breaker, trading halt, flash crash, price discovery

1
 The views expressed are those of the authors and do not necessarily reflect the views of the European Securities and Markets
 Authority. Any error or omissions are the responsibility of the authors. The authors would like to thank in particular Frank
 Hatheway and Hans Degryse for the extensive feedback provided, and also Alberto Garcia, Martin Haferkorn, Charles-Albert
 Lehalle, Mark van Achter, Sarah Draus, Dion Bongaerts, the members of ESMA’s Committee for Economic and Market
 Analysis (CEMA) and CEMA’s Group of Economic Advisers for their valuable comments on this paper or earlier versions
 thereof.
2
 Risk Analysis Officer, Risk Analysis and Economics Department, European Securities and Markets Authority (ESMA), 201-
 203 rue de Bercy, 75012 Paris Cedex, France. Email: cyrille.guillaumie@esma.europa.eu
3
 Bank Resolution Expert, Single Resolution Board (SRB) and lecturer in Financial Markets at SciencePo Paris – School of
 Public Affairs. He co-authored this article in his earlier capacity as Economist in the Risk Analysis and Economics Department,
 ESMA. E-mail: Giuseppe.loiacono@srb.europa.eu
4
 Team Leader, Risk Analysis and Economics Department, European Securities and Markets Authority (ESMA), 201-203 rue
 de Bercy, 75012 Paris Cedex, France. Email: Christian.Winkler@esma.europa.eu
5
 Head of Department, Risk Analysis and Economics Department, European Securities and Markets Authority (ESMA), 201-
 203 rue de Bercy, 75012 Paris Cedex, France. Email: Steffen.Kern@esma.europa.eu
ESMA Working Paper Number 1, 2020 4

 I. Introduction
A number of events in recent years have highlighted the importance of ensuring orderly
functioning of trading venues in situations of large and sudden market price movements.
Examples of these events include the 6 May 2010 flash crash, out-of-control algorithms of Knight
Capital Group in 2012, the Treasuries flash rally in October 2014, the market movements in US
equity and ETF markets on 24 August 2015, or the large and sudden GBP/USD exchange rate
moves in Asian FX markets on 7 October 20166. Price movements not related to economic
fundamentals can impact market quality by hindering the market from allocating capital
efficiently in the short and long run, related uncertainty might lead investors or risk-absorbing
market makers to retreat from the markets. This can be further influenced by significant market
microstructure changes over the past decade, with concentrated marketplaces progressively
being complemented by new market participants characterised by trading practices based on
advanced technologies, such as high-frequency trading, that place market orders in a fast and
automated way. An example are large institutional orders which are placed across markets and
time by algorithms. Draus and van Achter (2015) have shown that this can under specific
circumstances create the potential for short-term liquidity dry-ups7. In this context, mandated
trading interruptions, so-called circuit breakers (CBs), can play a role as a tool for trading venues
to manage extreme price swings.

Definitions
CBs are mechanisms that monitor the market continuously and trigger a trading halt as soon as
the price (or its variation) of an individual security or an index falls below or rises above a
predetermined level. In practice, practitioners and academics often use the terms “circuit
breakers” and “trading halts” interchangeably. Conceptually, CBs – together with price collars –
are a subcategory of volatility safeguards. Other types of trading interruptions include regulatory
suspensions and technical halts.

 Figure 1
 Trading halts classification

 Mechanisms that halt trading

 Other types of
 Volatility
 trading
 safeguards interruptions

 Circuit
 Price Regulatory Technical
 breakers
 collars suspensions halts
 (trading halts)

Regulatory suspensions are temporary suspensions in the trading of a particular security
enforced by the competent supervisory authority in cases of, for instance, insider trading, market
manipulation, inaccuracy and non-availability of public information. Technical halts are initiated
by a trading venue when outages occur on its IT infrastructures. In this article, we focus on CBs,

6
 Here one needs to bear in mind that the dynamics in foreign exchange markets differ markedly from those in securities
 markets.
7
 For more details on the relationships between algorithmic trading and circuit breakers see Draus and Van Achter (2015)
 "Circuit Breakers and Market Runs".
ESMA Working Paper Number 1, 2020 5

i.e. market-based halts applied and operated by trading venues. They can be triggered during
either the auction phase or continuous trading.
Auction CBs are the result of order imbalances during the auction call phase, while continuous
trading CBs are triggered during continuous trading because the execution price or potential
execution price breaches predetermined price ranges. Both have the same aim: to interrupt a
period of excessive volatility in order to calm the market and give investors the possibility to
reassess their positions and strategies. The result of an auction CB is to extend the auction
period, while continuous trading CBs either stop trading for a certain period to then resume it
through an auction phase, or directly switch from continuous trading to an auction call.
CBs can be further differentiated by the reference price used to trigger the halt, which is usually
calibrated in accordance with the nature of the financial instrument concerned and its liquidity
profile. The reference price can be either static (e.g. the closing price of the previous trading
session) or dynamic (e.g. the price of the last transaction). While a static threshold breach
generally results from incremental changes over the trading day, e.g., due to company-related
news, trading halts triggered based on dynamic thresholds generally reflect cases in which
markets suddenly react to changed market conditions or technical issues/fat finger events.
CBs also differ as to whether they are calibrated at instrument level (single-stock CBs, for each
individual security independently from other securities) or at market level (market-wide CBs;
when the index breaches predetermined thresholds, continuous trading is halted for a wider set
of securities), or a combination of both.
Price collars (or price limits) are another tool used by trading venues. Together with CBs they
compose the set of safeguards that trading venues can adopt to manage periods of excess
market volatility. Similar to price collars are fat-finger limits, these are limits on the size of the
orders that can be sent into the system. As opposed to CBs, price collars/fat-finger limits do not
halt continuous trading but rather constrain it; orders that would match a price above or below
certain thresholds (collar) or orders above a size limit (fat-finger limit) are rejected while
continuous trading is not stopped8.
Regulatory environment
In the EU regulatory framework9, the Directive on markets in financial instruments (MiFID II)
addresses the topic of trading halts directly by imposing two different requirements for trading
venues10:

8
 According to Gomber et al. (2016) “Circuit breakers - A survey among international trading venues”, the category “price
 collars” includes also the case in which continuous trading switches to auction due to an order that would match in a price
 outside predetermined price range. In this report this case is considered a trading halts, in the sense that continuous trading
 is halted due to a switch to auction trading.
9
 In the United States, by comparison, CB mechanisms exist at single-stock and market-wide level. Market-wide CBs are
 designed for three levels of market declines: 7% (Level 1), 13% (Level 2), and 20% (Level 3). These triggers are set by the
 markets at point levels that are calculated daily based on the prior-day closing price of the S&P 500 Index. If a Level 1 or
 Level 2 halt is triggered before 3:25 p.m., trading can only be resumed after a 15-minute trading pause. After 3:25 p.m. trading
 does not stop unless there is a Level 3 market decline, in which case trading stops for the rest of the trading day (4.00 p.m.).
 At single-stock level, the “limit up-down mechanism” halts trading depending on the stock price and when declines occur. The
 mechanism is a combination of single-stock CB and order price collar. The price limit bands are set at percentage levels
 above and below the average price of the stock over the preceding 5-minute trading period. These price limit bands are 5%,
 10%, 20%, or the lesser of USD 0.15 or 75%, depending on the price of the stock. The bands are double this size during the
 opening and closing periods of the trading day. If the national best bid and offer price for individual stock exceeds one of the
 upper or lower price limits for 15 seconds, trading is halted for 5 minutes. The limit up-down mechanism introduced on 31
 May 2012 replaced a simpler single-stock CB mechanism which halted trading for five minutes if a stock price moved up or
 down by 10% in a five-minute window.
10
 MiFID I did not specifically require trading venues to set in place mechanisms to halt or constrain trading, it provided for “fair
 and orderly trading” in Article 39(d). This concept was clarified in the ESMA Guidelines in 2012 specifying that this includes
 in particular trading halts, “arrangements (for example volatility interruptions or automatic rejections of orders which are
ESMA Working Paper Number 1, 2020 6

 - Article 48(4) requires trading venues “to have in place effective systems, procedures and
 arrangements to reject orders that exceed predetermined volume and price thresholds
 or are clearly erroneous”.
 - Article 48(5) requires trading venues to have the ability to “temporarily halt or constrain
 trading if there is a significant price movement in a financial instrument on that market
 or a related market during a short period”.
Finally, Article 48(13) mandates ESMA to develop guidelines on the appropriate calibration of
trading halts, taking into account the liquidity of different asset classes and subclasses, the
nature of the market model and the types of users. On 6 October 2016 ESMA issued a public
consultation11 regarding draft guidelines on trading halts under MiFID II, and on 6 April 2017
ESMA published the final guidelines12.
Analysis
In this paper we focus on EU CBs and their relevance and contribution to price discovery and
subsequent market conditions by analysing a database of CB trigger events for a sample of
10,000 financial instruments traded on EU trading venues. The database is built in-house based
on a trade data feed provided by the commercial data vendor Morningstar Real Time. Our
research is motivated by three distinct, although closely linked, research questions.
 - First, we examine whether CBs, introduced to dampen volatility in financial markets, are
 in fact effective to set calmer trading conditions.
 - Second, we test whether CBs contribute to the price discovery process, by giving time
 to investors to react to new information and reassess the price.
 - Third, we take advantage of the cross-venue character of our database to contribute to
 the discussion on cross-venue CB coordination across reference and satellite markets.
 To the best of our knowledge, there are no previous empirical studies on CBs with a
 cross-EU trading venue perspective.
The paper is structured as follows. After providing the economic understanding of the CB
mechanisms and a review of previous studies on this topic, we describe how these mechanisms
are currently used by EU trading venues. Then we describe our data set and our empirical
analysis. Finally, the last chapter concludes.

 II. The economics of CBs
Liquidity in a market is determined mainly by two factors: first, the asymmetry of information
between market participants supplying and demanding liquidity; second, the inventory risk taken
by liquidity suppliers. The asymmetry of information exposes liquidity suppliers to potential
losses arising from trading with better informed investors. Inventory risk arises because liquidity
suppliers are exposed to variations in the value of their positions that cannot be unwound
immediately. The bid-ask spread is the compensation required by liquidity suppliers to cover the
adverse-selection cost and inventory-holding costs.
Market microstructure theories explain that market volatility has a strong negative relationship
with market liquidity. In order to investigate this relationship, further examination of the
components of market volatility is necessary. Market volatility can be separated into two
components: the jump component and the diffusion component. The jump component refers to

 outside of certain set volume and price thresholds) to constrain trading or halt trading in individual or multiple financial
 instruments when necessary, to maintain an orderly market”.
11
 ESMA (2016); Consultation Paper: Guidelines on the calibration, publication and reporting of trading halts.
12
 ESMA (2017); Guidelines, Calibration of circuit breakers and publication of trading halts under MiFID II.
ESMA Working Paper Number 1, 2020 7

infrequent, large, isolated changes while the diffusion component arises from smooth and
expected small price changes.
Amiram et al. (2016) have shown that the jump component has a more dominant effect on
liquidity than the diffusion component. The jump component is associated with the inventory-
risk dimension of liquidity, in which market makers bear the risk of sudden, large price changes
to their inventories. In contrast, the diffusion component, characterized by small (and more
frequent) price changes, has a smaller effect on liquidity because market makers can adjust
their portfolios in a more flexible and gradual manner.
The jump component also affects market liquidity through the information asymmetry channel,
since the jump component is also driven by information events while the diffusion component is
generally associated only with increased trading. The jump-component drives the negative
relationship between volatility and liquidity through the channels of asymmetric information and
inventory risk13.
CB mechanisms can be put in place to limit discontinuous price changes (the jump component)
and to enhance liquidity. However, in order to assess the effectiveness of CB mechanisms we
need to further differentiate volatility based on the nature of the trader: fundamental volatility
and transitory volatility.
When traders discover new information about the fundamental value of a security, they push
prices towards their estimated value, creating fundamental volatility. Literature refers to them as
“informed” traders. “Uninformed” traders, in contrast, are considered to be those whose trades
are not based on new information. Uninformed traders’ trades are driven by market sentiment
or private liquidity shocks and result in transitory volatility. When uninformed traders push prices
away from their fundamentals, informed traders may step in and correct them. Transitory
volatility is, therefore, the tendency of prices to fluctuate around their fundamental values. In
other words, transitory volatility is the sudden price movement unexpected by market
participants. For example, where the price of a share falls due to an income loss reported by
the issuer, this constitutes fundamental and not transitory volatility, as public information would
have been anticipated by some “informed” market participants.
CB mechanisms are considered particularly effective when they reduce transitory volatility
caused by uninformed traders (Ackert et al., 2005). Such halts may also give informed traders
an opportunity to enter the market and provide liquidity; without a market halt such traders may
have been reluctant to post orders given the uncertainty about the price at which these orders
will be executed. CBs are understood to be less effective if they try to address fundamental
volatility (Ackert et al., 2005). In this case, CBs prevent prices adjusting quickly to new
information; they are likely to generate substantial volatility when markets reopen. Therefore,
when calibrating a CB framework, trading venues need to carefully assess which type of volatility
they are targeting.
Another question in calibrating a CB framework is whether CB parameters should be disclosed.
On the one hand, transparency about CB parameters can alter trading behaviour. Market events
in China around early 2016 highlighted the complex dynamics and interaction between markets
and trading rules full disclosure in stress situations14. In this case, a potential explanation for

13
 See Pastor and Stambaugh (2003) for an empirical analysis on the negative relationship between volatility and liquidity.
14
 A possible example are market events in China during the first weeks of January 2016. A new CB framework came into force
 where the parameters of the market-wide CBs were fully disclosed by the China Securities Regulatory Commission. Two CB
 levels were set. The first threshold was a market drop of 5%, triggering an automatic 15-minute pause in continuous trading.
 The second threshold was a 7% fall in market prices, triggering a trading halt for the entire trading day. The CB rules entered
 into force on 1 January 2016. On the first day of trading after implementation (4 January 2016) market-wide CBs were
 triggered: Trading on the Shanghai and Shenzhen exchanges was halted for 15 minutes when the CSI 300 index fell by 5%
ESMA Working Paper Number 1, 2020 8

issues in operating the CB framework may be that the introduction of a transparent CB regime
under already stressed market conditions contributed to a downward spiral in market prices, as
investors, fearing of being unable to sell financial instruments once the CB is triggered, rushed
to sell before the CB threshold was reached.
On the other hand, higher transparency and predictability around the timing of a pause in the
market following the trigger of a CB may be crucial to ensuring that market participants are
prepared to provide the necessary market liquidity. In this context, the lack of disclosure
regarding CB duration may lead to uncertainty and impair the willingness of participants to
provide liquidity. Such a result could lead to liquidity dry-ups that may prolong the impact of the
CBs and result in increased market volatility.
Between these two possible interpretations, there is no clear empirical evidence so far on
whether CB parameter disclosure is beneficial for, or detrimental to, market stability.

 III. Literature review
The literature on CBs dates to the period after the October 1987 market crash. In this context,
e.g. Greenwald and Stein (1991) as well as Kodres and O’Brien (1994) analysed advantages
and disadvantages of introducing a CB. The authors argued that CBs might lead to increased
liquidity provision as they incentivise additional value-motivated traders to enter the market.
Since then, different aspects of CBs have been covered in the literature. We have identified four
main strands of CB-related literature:
 - empirical literature on market quality before, during and after a CB event,
 - analysis of the “magnet effect” of CBs,
 - coordination of CBs, and
 - the relationship between CBs and the price discovery process.
Market quality before, during and after a CB event
Most of the empirical literature on the impact of CBs has analysed market quality before, during
and after a CB event. Goldstein and Kavajecz (2004) analyse the CBs triggered on NYSE on
October 27, 1997. They conclude that CBs did not calm the market and caused a reduction in
liquidity on the following day as limit traders were not willing to resubmit previous days’ expired
orders, thus causing a lack of depth in the limit order book. Kim and Rhee (1997) and Bildik and
Gulay (2006) find that price limits delay price discovery in their respective examination of
Japanese and Turkish data. Kim and Yang (2004) found that CBs are effective to reduce
volatility only when they are triggered consecutively, giving the time to investors to revaluate
market information and from rational decisions. Clapham et al. (2017) demonstrate that volatility
interruptions in general significantly decrease volatility in the post interruption phase. This
decrease in volatility comes however at the cost of decreased liquidity. For the Indian market
Chari et al. (2017) finds that the positive effect of market-wide circuit-breaker continues up to
three post-event days.

Brugler and Linton (2014) evaluated the impact of LSE single-stock CBs on the subsequent
market quality of the same security and other securities. The authors conclude that a breach of
the lower limit of the CB reduces the market quality of the same security (greater degree of price
inefficiency and market microstructure noise for a given volume and frequency of trading) but

 from the previous closing price and then for the rest of the day as the index subsequently fell by 7%. On 7 January 2016, CBs
 were triggered again, and stock markets closed only 30 minutes after they had opened. In the evening of that day the CSRC
 suspended the CB rules, and the CSI 300 recovered 2% on the following day.
ESMA Working Paper Number 1, 2020 9

they do not find a significant effect for upper-limit breaches. Assessing the overall market quality,
the authors conclude that CBs help to prevent contagion through poor market quality. Liu and
Zeng (2019) demonstrate that - consistent with what happened in recent Chinese market events
- in stressed times circuit breakers can cause crash contagion, volatility contagion, and high
correlations among otherwise independent stocks.
Brogaard and Roshak (2016) proposed an alternative approach to analyse CB effectiveness. In
their view, preceding studies did not take into account whether CBs may have elements of a
self-fulfilling prophecy or magnet effect when prices approach the CB trigger. In other words, by
studying the post-halt market quality compared to pre-halt market quality, researchers may have
concluded that CBs prevent high volatility when it was in fact the presence of CBs themselves
that fuelled ex-ante volatility. Brogaard and Roshak (2016) overcome this issue by analysing
the effect of CBs on price paths that approach the limit, by comparing volatility in stocks where
CBs are in place and for stocks for which there are no CBs. They take advantage of the SEC
having introduced CB mechanisms for different parts of the equity market in a staggered
manner.
The study does not find evidence that CBs have elements of a self-fulfilling prophecy when
prices approach the CB trigger. They find that the existence of CBs causes informed traders to
react strategically before the price of the security approaches the CB trigger. They will hold back
some of their trading, as a trading halt would be detrimental for them (since they cannot take
advantage of their information for a certain period of time). Overall this reduces the frequency
and severity of extreme price movements, which in turn leads to increased provision of liquidity
by market makers.
Draus and Van Achter (2015) evaluate the conditions under which CBs increase or decrease
welfare. While CBs are set up to prevent short-term market runs, they cannot distinguish the
underlying motivation for the excessive selling volume and might therefore restrain trading
induced by actual liquidity needs. The authors analyse this trade-off and contribute to the
literature by determining the characteristics of a socially-optimal CB which yield a maximum
welfare improvement. According to the authors, the social usefulness of a CB is considerable
when there is a low probability of traders having urgent liquidity needs. Similarly, they argue that
high uncertainty about future liquidity needs implies that a restriction on trading can be more
socially useful. To apply socially-optimal CBs in practice, the authors suggest that exchanges
and regulators could use investor fear indices, market stress indicators or high-frequency
market run predictors to capture the common uncertainty on future liquid shocks.
“Magnet effect” of CBs
Subrahmanyam (1994) introduces the “magnet effect” of CBs. The magnet effect in essence
describes a situation where a CB can create a self-filling prophecy. Investors fearing that a CB
could be triggered and not being able to trade in such a situation, could trade large volumes,
thus triggering a CB. Such magnet effects could be reduced by randomising trading halts. Cho
et al. (2003) use intraday data from the Taiwan Stock Exchange to test the magnet effect and
find a statistically and economically significant tendency for stock prices to accelerate toward
the upper CB threshold and weak evidence of acceleration toward the lower CB threshold. Nath
(2005) finds that trading activity accelerates as stock prices approach their lower, but not upper,
price limits on the National Stock Exchange of India. Du et al. (2005) find evidence of the magnet
effect from their study of transaction data from the Korea Stock Exchange.
Coordination of CBs
The literature on the coordination of CBs is scarce, and most of it dates to the 1990s when the
market structure was less fragmented. Subrahmanyam (1994) analyses a situation in which a
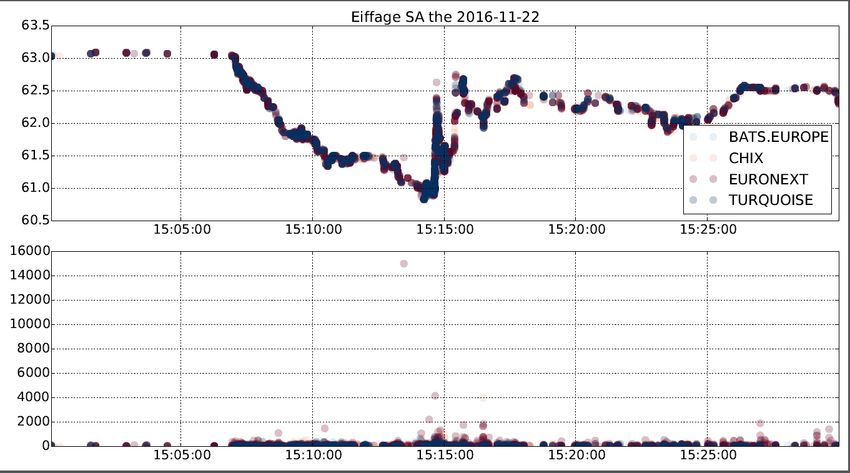
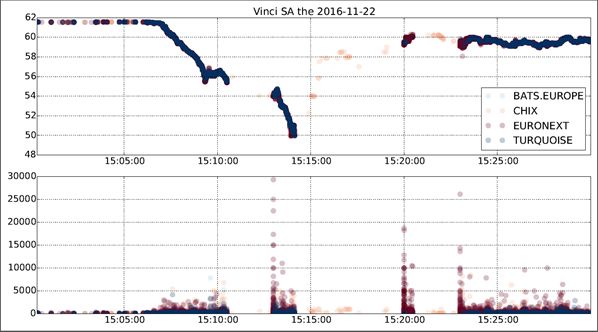
ESMA Working Paper Number 1, 2020 10

CB causes trading to be halted in both a "dominant" (more liquid) and a "satellite" market. As
agents switch from the dominant market to the satellite, price variability and market liquidity
decline on the former and increase on the latter. Morris et al. (1990) conclude that uncoordinated
CBs will more likely harm the market than improve its quality due to higher volatility and a rising
demand in liquidity on the non-halting markets. A recent study on the subject by Gomber et al.
(2012) empirically found that CBs are effective in reducing volatility in the home market and in
the satellite market, but at the cost of higher spreads. Moreover, the satellite market’s quality
and price discovery during the halt is weakened and only recovers as the other market resumes
trading. Cui and Gozluklu (2016) analyse whether CBs create spill overs. In particular they find
that the triggering of CBs is often linked to speculative strategies by arbitrageurs, such as
momentum and pairs trading, thus CBs can transmit volume and volatility increases to other
non-halted stocks.
Relationship between CBs and the price discovery process
The relationship between CBs and the price discovery process was analysed first by
Chakrabarty et al. (2000) using a dataset on NYSE delayed openings between 2002 and 2005.
During these halts, trading at other venues was allowed. Their results suggest that off-NYSE
trades during NYSE halts provide significant price discovery that is incremental to that contained
in the NYSE indicator quotes. Zimmermann (2013), building on the work of Chakrabarty et al.
(2000) tested whether the CBs triggered on stocks traded on Xetra in the period from 01/2009
to 01/2012 contributed to price discovery process: the CB auction price reflects efficient
learning. He demonstrated that CBs do not impede the price discovery process, and that the
CB auction price contains incremental information for participants helping to return to orderly
trading. Chan et al. (2005) examined the price discovery process of CBs using trade-to-trade
transaction data and the limit order book from the Kuala Lumpur Stock Exchange. Their results
suggest that CBs on individual securities do not improve price discovery processes but impose
serious costs even when the limit band is as wide as 30%. Kwon et al. (2018) analysing CB on
the Korean market demonstrate that the dynamic ones are improving price stabilisation
discovery, while the effect of the static ones on price discovery is limited.

 IV. Current volatility safeguard market practices
In this section, we map the current market practices by looking at the public documents on
trading rules from a sample of EU trading venues. Results are shown in the table in Annex A.
Overall, there is strong heterogeneity in the volatility safeguard mechanisms applied by EU
trading venues. A few trading venues do not have in place any type of volatility safeguards, the
remaining venues under analysis have different types of volatility safeguards: price collars, CBs
or both. The types, calibration and volatility safeguard mechanisms across EU trading venues
are very different and not harmonised.
Typically, price collars applied on EU trading venues do not halt trading as such. CBs applied
on EU trading venues halt trading whenever:
− The execution price or the potential execution price lies outside the “dynamic” price range
 around the reference price. The price range is generally defined individually for each security
 and specifies the maximum deviation (in either a positive or a negative direction) from the
 reference price. The reference price for the dynamic price range can be the last traded price
 of a security determined in an auction or during continuous trading;
− The execution price or the potential execution price lies outside the “static” price range, also
 around the reference price. The reference price for the static price range is generally the last
ESMA Working Paper Number 1, 2020 11

 price determined in an auction on the current trading day or, if this price is not available, the
 last traded price determined on one of the previous trading days.
Two different cases of CBs on continuous trading occurs in practice:
− continuous trading is halted, and an auction is immediately triggered;
− continuous trading is halted, and the auction is triggered after some time; in this period the
 order book is frozen, no orders can be modified or cancelled;
The auction phase triggered by CBs can be divided into two sub-phases: call phase and price
determination. During a call phase, market participants can react by modifying or deleting
existing orders and quotes or by placing new ones. After a minimum duration which is not
disclosed, the call phase ends randomly. However, if the potential trade price still remains
outside the acceptable range the call phase will be extended until the volatility interruption is
terminated manually. Continuous trading is resumed following the price determination phase,
when the price is determined according to the principle of the highest executable volume.
Summarising, a typical pattern of a CB mechanism, as observed on EU trading venues ( shown
in Figure 1) is:
1. An incoming order is matched at a price that breach the CB thresholds;
2. The incoming order is rejected, or executed partially;
3. A CB is triggered, and continuous trading goes to pause mode or to auction trading;
4. (optional phase) Order book is frozen for a time interval, no orders can be inserted, modified,
 or cancelled;
5. Clients modify or cancel their existing orders and/or also place new ones;
6. After a random time-interval, the orders with matching prices are matched and executed,
 while the others are removed from the book;
7. Clients receive the trade notifications of the orders that were executed in the auction, if any;
8. Continuous trading resumes.

Figure 1 Figure 2
CB mechanism An example of a CB trigger event
 1. An incoming order is matched at 25.25
 a price that breach the CB 25.23
 Continuous thresholds;
 2. The incoming order is rejected, 25.21
 trading or executed partially
 3. A CB is triggered 25.19
 25.17
 4. Order book is frozen (optional phase) 25.15
 Auction call phase 25.13
 Time 5. Clients modify or cancel their existing 25.11
 Volatility orders and/or also place new ones
 interruption Auction price determination 25.09

 6. After a random time interval, the 25.07
 orders are matched and executed, 25.05
 while the others are removed from the -10 -8 -6 -4 -2 0 0 +2 +4 +6 +8 +10
 book
 CB MIDPRICE
 7. Clients receive the trade Note: Exampl e of the ev olution of the midprice during a C B ev ent from 10min
 Continuous notifications of the orders that prior till 10min following the event. Grey area repres ents the switch to auc tion
 trading were executed in the auction period.
 8. Continuous trading resumes Sources: Morningstar Real Time, ESMA.

The duration of a trading halt is independently set by each trading venue and can be extended.
In fact, if the potential execution price still remains outside the predetermined acceptable range
the auction is extended until the potential price is within the acceptable range. In section VI, we
ESMA Working Paper Number 1, 2020 12

provide descriptive statistics around CBs and show that the duration of trading halts differs
substantially from one venue to the other.
As shown in the table in Annex A, the thresholds for CB triggers are disclosed only by around
half of the EU trading venues under analysis.
The CBs and price collars have different thresholds according to the liquidity profile and the
price of the security. Generally, less liquid products require the CBs and price collars to be
proportionally larger than on highly liquid products, the reason being that information about
fundamentals has a higher impact on the value of less liquid products. Similarly, very low priced
(penny stocks) and very high-priced securities generally have ad-hoc thresholds. Generally
speaking, the parametrisation of CBs on illiquid instruments, such as options, is much more
difficult than liquid instruments, as price continuity and price ranges are also very dependent on
time of trading activity.
Other factors that trading venues typically take into account when designing the CB framework
are:
 - Type of financial instrument;
 - Expected (e.g. company figures, corporate actions or key macroeconomic figures) or
 unexpected relevant news;
 - Correlation with the volatility (or pricing) of a corresponding index or instrument (e.g. if
 the S&P index suddenly moves 5%, then European equities and indices would also be
 expected to display increased volatility);
 - The number of traders or liquidity providers active in a financial instrument or market;
 - Statistical analysis on past CB trigger events in the affected instruments.
According to a survey15 conducted by the World Federation of Exchanges (WFE) in collaboration
with the Goethe University Frankfurt in 2016 covering 44 trading venues, globally there are 56
distinct types of CB mechanisms, 47 of which are implemented on cash markets and 9 on
derivatives markets. While in the EU CB mechanisms are only stock-specific, globally there are
also market-wide CBs (i.e. when an index price falls above or below a pre-determined range,
one or more market segments are halted).
CB mechanisms could be coordinated among different trading venues, and within the same
exchange, between e.g. cash and derivatives markets. The literature on CB coordination is
scarce; in principle, coordinated CBs should avoid sudden capital movement between
exchanges and liquidity dry-ups; or in case of correlated instruments CB coordination could
avoid pricing issues on the derivatives market when the cash market is absent. According to the
above-mentioned survey, out of 15 trading venues which operate both cash and derivatives
markets and that replied to the survey, six non-EU venues coordinate their CB mechanisms
between the cash and the derivatives market16. This means that trading in a derivative is halted
or suspended if the underlying on the cash market of the exchange is affected by a CB. In the
EU, for example, according to the responses received to the ESMA consultation on the
Guidelines on trading halts, in Euronext venues derivative instruments automatically halt if the
underlying instrument is hit by a CB.
Proponents of CB coordination among different trading venues argue that a full CB coordination
would ensure a level playing field for all trading venues when consistently applied and enforced
by regulators; and in case of market-wide events can contribute to market stabilisation.

15
 WFE, Goethe university; “Circuit Breakers – A Survey among International Trading Venues”, 2016. https://www.world-
 exchanges.org/home/index.php/files/18/Studies%20-20Reports/356/WFE%20Survey%20on%20Circuit%20Breakers.pdf
16
 The trading venues that, according to the WFE survey, coordinate CBs between cash and derivatives market are: BSE India,
 Intercontinental Exchange (NYSE), Nasdaq US, NSE India, Stock Exchange of Thailand, Tel-Aviv Stock Exchange.
ESMA Working Paper Number 1, 2020 13

Moreover, a lack of CB coordination could increase market volatility if traders move to other
markets in a CB event. Critics of CB coordination, in contrast, claim that technical issues may
arise in coordinating the reopening of markets after the trading halt between reference and
satellite venues, while ensuring that each CB mechanism is tailored and parametrised to the
market where the instrument is traded, in order to be adjusted in response to market events
affecting particular sectors.
All in all, as of today, volatility safeguard mechanisms are developed in a discretionary way by
EU trading venues, which results in a heterogeneous landscape of EU CBs and price collars,
and their calibration parameters (trigger prices, thresholds, duration, extension mechanisms).
This study analyses CBs effects only, as data on price collars are not available. Moreover, in
the analysis all CBs are treated equally, under the assumption that all CBs have the same
effects on market quality parameters. However, we acknowledge this as a limitation of this study,
due to insufficient data on CB parameters, and that different calibration parameters may yield
different results and may also affect competition between trading venues.
With the MiFID II requirements and the ESMA Guidelines, national authorities and trading
venues now have an EU approach at their disposal to enhance existing and develop new CB
landscapes, where necessary. The implementation of the new rules is set to bring new and
instructive evidence on the performance of CBs in the coming years. However, trading venues
will continue to have considerable latitude in calibrating CBs for the venue as a whole, for
instrument classes, and for individual instruments. Our findings of current market practices
suggest CB calibrations differ across the EU, between trading venues, across instrument
classes per trading venue, and between individual instruments. At the same time, it is clear that
the design of these instruments can have a profound effect on markets. The introduction of
MiFID II facilitates the comparability of CB arrangements and their performance in critical
situations. It will be important to gather and evaluate the market evidence that becomes
available with the aim of learning from the experience under the new MiFID II environment.

In particular, we will need to understand any potential performance patterns, as well as the
relevance of individual elements of the calibration, as e.g. addressed in the ESMA Guidelines,
for the effectiveness of CBs. This particularly applies to critical situations of general financial
instability across instruments and market segments, liquidity dry-ups in limited asset classes or
wider market segments, as well as algorithms spinning out of control. As the technological
changes related to infrastructure provision and access, as well as algorithmic routines, are set
to continue, optimising the calibration of trading halt arrangements will be a key concern for
trading venues and supervisors alike.

 V. Dataset
Our dataset of CB trigger events and related market data has been built based on data feeds
provided by Morningstar Real Time and covers the period from 1 April 2016 to 31 December
2016. It contains tick-by-tick order book and execution information on a selection of 10,000
financial instruments traded on European trading venues17. The sample of instruments includes:
- 7,921 stocks: All constituents of the STOXX Europe 200 Large/Mid/Small caps index;
- 1,287 futures: The underlying is one of the already selected stocks;

17
 See Annex B for the detailed sample composition of type of financial instrument by trading venue. Some regional venues are
 specialist markets, where automatic volatility interruption mechanisms do not apply.
ESMA Working Paper Number 1, 2020 14

- 333 Exchange Traded Funds (ETFs): Selected ETFs track a European STOXX index or
 a subcategory (e.g. STOXX Europe 200 Large Banks);
- 446 Depository receipts: Random selection18;
- 13 foreign exchange rates derivatives: Exchange rates from EUR to other currencies.

Throughout the entire paper an “instrument” is defined as the combination of its security type
and the trading venue on which it is traded. Since the sample contains a large number of cross-
listed stocks, the absolute number of securities in the sample is less than 10,000. It is also worth
noting that due to the sampling the analysis in the paper does cover a subset of available
instruments.

Annex C describes in detail the methodological steps undertaken in order to build our dataset
of CB trigger events and related market data used for the empirical study.

 VI. Overview on CB trigger events – statistics and market practices
This section provides descriptive statistics with respect to our CB sample. In the period from 1
April 2016 to 31 December 2016 there were 8,896 CBs triggered on 3,360 financial instruments
in our sample. We observed CBs for stocks and ETFs. For stocks we were able to cluster the
CB trigger events according to the size of the stock (small, mid and large cap) and according to
the sector of business.19

The descriptive statistics in Table 1 indicate that over the period of analysis an average of 44
CBs occurred per day on stocks and 2.5 per day on ETFs. Across all days, the minimum number
of CBs trigger events on stocks and ETFs was 4 and 0, respectively; while the maximum number
of CB events was 1,196 and 109 occurred on stocks and ETFs, respectively, on the day after
the UK referendum. Financial sector stocks appear to be halted more frequently (on average 16
CB per day), compared to the other sectors where the average number of CBs per day ranges
from four to 14. Regarding the market capitalisation of stocks, large cap stocks appear to be
halted the most by CBs (on average 18 times per day, compared to 16 times per day for mid
cap and eight for small cap. Low fragmented stocks are halted more frequently by CBs, 26 times
per day compared to nine and seven CBs daily occurrences for medium and high fragmented
stocks respectively. The higher incidences of CBs for low fragmented stocks holds across the
three levels of market capitalisation (large, medium, small).

18
 For the empirical study, depositary receipts are treated as stocks, because of their similarities in trading behaviour.
19
 As our analysis is based on a sample of securities and as such does not cover the entire range of instruments available for
 trading, the actual number of CBs on trading venues will be higher than the number of CBs we have observed.
ESMA Working Paper Number 1, 2020 15

Table 1. Descriptive statistics
 Volatility Interruptions – 8,896 observations – 20 trading venues Mean Std dev Min Max
 Period 01/04/2016 - 31/12/2016
Stocks
 Number of CBs per day (Number of stocks halted per day) 44.0 (24.0) 83.4 (34.3) 4 (4) 1087 (429)
 By sector:
 a) Sector Basic Materials 6.5 (3.0) 9.5 (3.4) 0 (0) 76 (36)
 b) Sector Consumer Cyclicals 4.4 (2.6) 14.4 (6.0) 0 (0) 190 (73)
 c) Sector Consumer Non-Cyclicals 2.3 (1.5) 5.8 (2.3) 0 (0) 76 (27)
 d) Sector Energy 2.9 (1.8) 4.6 (2.2) 0 (0) 51 (24)
 e) Sector Financials 16.6 (8.7) 30.5 (11.2) 0 (0) 367 (119)
 f) Sector Healthcare 2.2 (1.1) 5.4 (2.1) 0 (0) 51 (22)
 g) Sector Industrials 3.7 (2.1) 11.0 (4.5) 0 (0) 110 (54)
 h) Sector Technology 2.2 (1.0) 5.6 (2.0) 0 (0) 50 (25)
 i) Sector Telecommunications Services 1.5 (0.9) 4.7 (2.1) 0 (0) 49 (25)
 j) Sector Utilities 1.9 (1.1) 5.4 (2.2) 0 (0) 67 (24)
 By market capitalisation:
 a) Large caps 18.1 (10.2) 42.3 (19.2) 0 (0) 554 (239)
 b) Mid-caps 16.0 (7.7) 28.4 (9.3) 0 (0) 334 (113)
 c) Small caps 8.0 (4.8) 14.9 (6.1) 0 (0) 190 (71)
 By market fragmentation:
 a) High fragmented stocks 6.5 (3.8) 17.4 (8.1) 0 (0) 229 (105)
 b) Medium fragmented stocks 8.9 (4.7) 22.5 (10.8) 0 (0) 286 (139)
 c) Low fragmented stocks 26.7 (14.2) 45.3 (16.2) 1 (1) 563 (179)
 ETFs
 Number of CBs per day (Number of ETFs halted per day) 2.5 (1.1) 9.6 (3.0) 0 (0) 109 (33)

Note: Descriptive results for the CB sample of 8,896 observations in the period 01/04/2016 to 31/12/2016.
Sources: Morningstar Real Time, ESMA.

The duration of CBs is very heterogeneous among EU trading venues. As shown in the box plot
in Figure 3, Borsa Italiana and Euronext Brussels have the highest average CB duration, 10
minutes and 12 minutes respectively. Borsa Italiana has also the highest dispersion of CB
duration, spanning from a minimum of 5 minutes to a maximum of 50 minutes. This means that
in Borsa Italiana a CB is extended on average twice and its minimum duration is 5 minutes, the
highest among the trading venues under analysis. The dispersion is low for the rest of the EU
trading venues under analysis, which on average have a CB duration of 4 minutes.

Figure 3
Box-plot of CB duration
Strong heterogeneity across EU trading venues
00:30:00

00:25:00

00:20:00

00:15:00

00:10:00

00:05:00

00:00:00

Note: Box-plot on the dispersion (quartiles) of the duration of circuit breakers by trading venue. The red dot in each candle indicates the average CB duration per trading venue, while the red-dotted line
indicates the average CB duration across trading venues.
Sources: Morningstar Real Time, ESMA.
ESMA Working Paper Number 1, 2020 16

The incidence of CB trigger events throughout the day is not uniform. As described in Figure 4,
the incidence of CBs is very high at the beginning of the trading day before constantly
decreasing during the first 2 hours. This pattern is in line with the pattern of intraday volatility,
which is not surprising, as CBs are in place to reduce market volatility. From mid-morning to
14:15 UTC CB incidences remain broadly constant before starting to increase at 14:30, when
US markets open.

The peak of CBs triggered in the first 30 minutes of the trading day is likely driven by a flow of
new information which needs to be reflected in stock prices. Similarly, from 14.30 to 15.00 UTC
investors in EU markets react to the information arising from the opening of the US market. A
CB is flagged as “consecutive CB” if it follows or precedes another CB triggered on the same
stock in the following or preceding 10 minutes; all the others are categorised as “isolated CBs”.
It emerges that among the CBs triggered on the CB peak hours, half of them were “consecutive
CBs”, meaning that CB events were concentrated on fewer stocks.

During the other trading hours, CB were triggered mostly in an isolated manner. Figure 5 shows
that consecutive CBs in a ten-minute window includes prevalently cases in which one or two
CBs are triggered after the initial one. The choice of a ten minutes window to qualify a CB as
consecutive has been done on the basis of the distribution of CBs qualified as consecutive
depending on the choice of time interval between CBs (Figure 6).

Figure 4
CB events per time of the day
High incidence of CB events at the beginning of the day, and around US market opening times
70 120 0

60
 100 0

50
 800

40

 600

30

 400
20

 200
10

 0 0
 08:45

 09:30

 09:45

 10:30

 11:30

 12:15

 13:15

 14:15

 15:00

 16:00
 08:00

 08:15

 08:30

 09:00

 09:15

 10:00

 10:15

 10:45

 11:00

 11:15

 11:45

 12:00

 12:30

 12:45

 13:00

 13:30

 13:45

 14:00

 14:30

 14:45

 15:15

 15:30

 15:45

 16:15

 10th-25 th percentile Core 50% 75th-90 th percentile Isol ate d CBs Consecuti ve CBs Median
Note: Dispersion of the intraday vol atility, in bps , computed every 15 minutes usi ng the Garman-Kl ass formula for instruments traded on the referenc e market; and number of CB trigger events by time of the day (rhs). The x-axis labels
indicate the starting time of the 15 minutes bucket. The starting time of the CB event was used to allocate the CB to the relevant bucket. Trading hours are expressed in UTC (Coordinated Universal Time).
Sources: Morningstar Real-Time Data, ESMA.

Figure 5 Figure 6
Consecutive CBs Distribution of consecutive CBs
Mostly isolated CBs 10 minutes set as threshold
 6 4.5 60
 4
 50
 5 3.5
 3 40
 4 2.5
 30
 2
 3 1.5 20
 1
 2 10
 0.5
 0 0
 1 0 4 9 13 17 21 26 30 34 38 43 47 51 55 60
 Number of consecutive CBs % of tota l nu mb er o f CB s (rhs)
 0 Note: Number of CB trigger events qualified as cons ecutiv e depending on the choice
 0 1 2 3 4 5 6 7 8 9 10 11 12 13 14 of time interval between CBs.Number of CBs expr essed in thousands on the primary
 Note: Number of cons ecutive CBs in a 10-minute i nterv al. "0" means isol ated CBs, Y-axis, and ex pressed as prec entage of total number of CBs in the s ample on the
 "1" means one cons ecutiv e CB after the initial CB, etc . Number of CBs expr essed secodary axis. X-axis in minutes.
 in thousands on the Y-axis. Sources: Morningstar Real Time, ESMA.
 Sources: Morningstar Real Time, ESMA.
ESMA Working Paper Number 1, 2020 17

Figure 7 shows the evolution of the number of CB trigger events over our period of analysis. A
clear spike can be observed in the days following the UK referendum vote on 23 June 2016.
320 and 130 CBs were on average triggered on stocks and ETFs respectively in the 4 trading
days following the referendum. Thereafter CB activations decreased sharply in the following
weeks reaching pre-UK referendum levels, which were about 50 CBs per day.

In July the indicators show financial markets reactiveness to the news on the EBA EU-wide
stress tests, where about 58 CBs per day were triggered on average on 30 stocks in the first
days of August 2016, comparing to an average of 24 CBs triggered on 15 stocks in the week
preceding the news and in the 2 weeks after the news. The stocks halted pertain mainly to the
banking sector. Additionally, following the outcome of the US Presidential elections in November
2016 and the Italian referendum in December of 2016, CB incidences increased to an average
of 100 CBs per day in the week from 9 to 15 November 2016, and 51 CBs in the week going
from 5 to 9 December 2016. These spikes of CB incidences are partly information-driven and
partly due to noise trading, as trading activity intensified in these periods.

By analysing the CB occurrences on stocks by their market capitalisation (Annex D), it can be
inferred that in normal market conditions there is no particular indication of a higher CB
incidence stocks with high and low liquidity (large cap stocks being considered more liquid and
small cap stocks less liquid). However, in stressed market situations (as on the days following
the UK referendum, the EBA stress tests results, the US Presidential elections and the Italian
referendum) CBs were triggered mostly on large cap stocks. In particular, in the week following
the 24 June 2016 the CBs daily occurrences were on average 140 on large stocks, 103 on mid
cap stocks and 45 on small cap stocks (on the days preceding the UK referendum result there
were 30 on large stocks, 31 on mid cap stocks and 8 on small cap stocks).
ESMA Working Paper Number 1, 2020 18

Figure 7
Number of CB trigger events
Spikes following market events
 250 UK referendum 80
 US election
 70
 200 EBA stress-
 60
 tests results IT referendum
 150 50

 40
 100 30

 20
 50
 10

 0 0
 Apr -16 May-16 Jun-16 Jul-16 Aug -16 Sep -16 Oct-16 Nov-16 Dec-16
 Equ ity turn ove r (rh s) ETF turnover (rhs) Equ itie s ETFs
 Note: N umber of CBs trigger ev ents by type of financial i nstrument in the period from 01/04/2016 to 31/12/2016, weekly average. Equity
 turnover of the EU trading venues under analysis on secondary axis, EUR bn.
 Sources: Monringstar Real Time, ESMA.

Figure 8
Number of financial instruments halted by CBs
Similar pattern as for CB trigger events

160 UK referendum 80
 US election
140 70

120 EBA stress- IT referendum 60

100 tests results 50

 80 40

 60 30

 40 20

 20 10

 0 0
 Apr -16 May-16 Jun-16 Jul-16 Aug -16 Sep -16 Oct-16 Nov-16 Dec-16
 Equ ity turn ove r (rh s) ETF turnover (rhs) Equ itie s ETFs
 Note: N umber of financial i nstruments affec ted by CBs in the period from 01/04/2016 to 31/12/2016, w eekly av erage.Equity turnover of the EU
 trading venues under analysis on secondary axis, EUR bn.
 Sources: Monringstar Real Time, ESMA.
ESMA Working Paper Number 1, 2020 19

Box 1
CBs in the context of significant market events
The result of the UK referendum on EU membership triggered very large trading activity on European
stock markets on Friday 24 June 2016. The trading volume for the constituents of the STOXX Europe
200 high/medium/small cap indices was EUR 61bn on average in the four days following the UK
referendum, compared to an average daily trading volume of EUR 35bn over the preceding three months.
Additionally, volatility in financial markets increased rapidly during the UK referendum week, with the
VSTOXX (the EURO STOXX 50 volatility index) 30% than its average daily level observed in the
preceding six months. After the unexpected referendum result, the DAX, CAC, FTSE 100 and the EURO
STOXX index opened down between 7% and 9% of the previous day close. Especially the stock market
value of financial institutions declined significantly and triggered multiple CBs. However, the extreme
volatility seen after the UK referendum, which varied to a certain degree across instruments and markets,
was managed successfully with each venue applying its own CB mechanisms without any market-wide
issue occurring.

An analysis of CB occurrences on the days around the UK referendum on the EU membership reveal a
high number of CB trigger events. On the day after the referendum results (24 June) a total of 1250 CBs
was triggered on 429 stocks and 427 CBs were triggered on 33 ETFs traded on EU trading venues. As
shown in the graphs below, this number of CB trigger events is unusual and considerably higher in
comparison with the average of 70 CBs triggered daily in the week preceding the referendum. After two
days CBs trigger event went back to pre-referendum levels. The analysis by sector reveals that the stocks
pertaining to the industrial sector were mostly affected (39%), followed by ETFs (27%) and banks (16%).
Looking at CB occurrences by market capitalisation we observe that large cap stocks were most
frequently halted by the trading interruptions mechanisms (52%) followed by mid cap stocks (31%).

Number of CB trigger events Number of stocks and ETFs halted by CBs
120 0 500
 450
100 0 400
 800 350
 300
 600 250
 200
 400 150
 100
 200
 50
 0 0

 Equ itie s ETFs Number of Equ itie s Number of ETFs
 Note: Number of CBs on the week before and after theUK referendum. Note: Number of financial instruments halted on the week before and after theUK referendum.
 Sources: Morningstar Real Time, ESMA. Sources: Morningstar Real Time, ESMA.

 Distribution of CBs by sector Distribution of CBs by stock size
 Technolog
 Healthcar y Telecomm SM ALL
 e unications 18%
 4%
 4%
 Energy Serv ices
 4% 4%
 Utilities
 6%
 LA RGE
 Consumer Financials
 51%
 Non- 31%
 Cyclicals
 6% M ID
 31%
 Basic Consumer
 M aterials ETFs Cyclicals
 Industrials
 7% 9%
 9% 16% Note: CBs trigger events on 24/06/2016 by firm market capitalization.
 Note: Sectors of the stocks halted on 24/06/2016 Sources: Morningstar Real Time, ESMA.
 Sources: Morningstar Real Time, ESMA.
You can also read