GLOBAL REPORT ON EARLY WARNING INDICATORS OF HIV DRUG RESISTANCE - TECHNICAL REPORT
←
→
Page content transcription
If your browser does not render page correctly, please read the page content below
TECHNICAL REPORT

                     HIV DRUG RESISTANCE

                   GLOBAL REPORT
                   ON EARLY WARNING
                   INDICATORS OF HIV
                   DRUG RESISTANCE

                   JULY 2016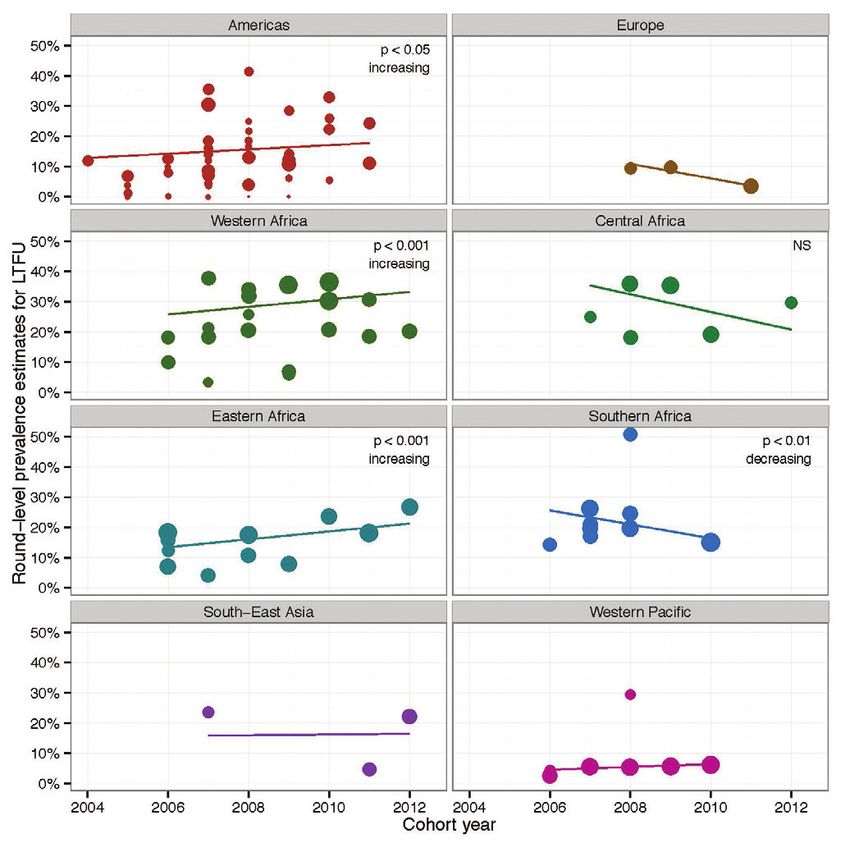

TECHNICAL REPORT

                   GLOBAL REPORT
                   ON EARLY WARNING
                   INDICATORS OF HIV
                   DRUG RESISTANCE

                   JULY 2016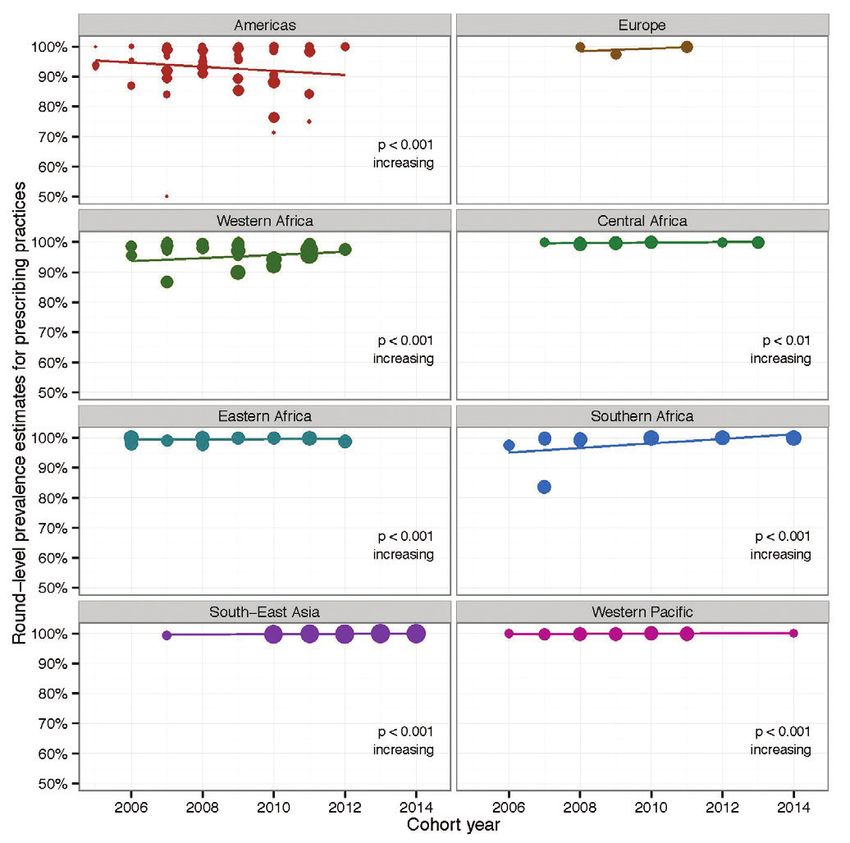
WHO Library Cataloguing-in-Publication Data

Global report on early warning indicators of HIV drug resistance: technical report, July 2016.

1.Drug resistance, Viral. 2.Anti-HIV Agents – therapeutic use. 3.HIV Infections. I.World Health Organization.

ISBN 978 92 4 151117 9                  (NLM classification: WC 503.2)

© World Health Organization 2016

All rights reserved. Publications of the World Health Organization are available on the WHO website (www.who.int) or can be purchased from
WHO Press, World Health Organization, 20 Avenue Appia, 1211 Geneva 27, Switzerland (tel.: +41 22 791 3264; fax: +41 22 791 4857;
e-mail: bookorders@who.int).

Requests for permission to reproduce or translate WHO publications –whether for sale or for non-commercial distribution– should be
addressed to WHO Press through the WHO website (www.who.int/about/licensing/copyright_form/en/index.html).

The designations employed and the presentation of the material in this publication do not imply the expression of any opinion whatsoever on
the part of the World Health Organization concerning the legal status of any country, territory, city or area or of its authorities, or concerning
the delimitation of its frontiers or boundaries. Dotted and dashed lines on maps represent approximate border lines for which there may not
yet be full agreement.

The mention of specific companies or of certain manufacturers’ products does not imply that they are endorsed or recommended by the
World Health Organization in preference to others of a similar nature that are not mentioned. Errors and omissions excepted, the names of
proprietary products are distinguished by initial capital letters.

All reasonable precautions have been taken by the World Health Organization to verify the information contained in this publication.
However, the published material is being distributed without warranty of any kind, either expressed or implied. The responsibility for the
interpretation and use of the material lies with the reader. In no event shall the World Health Organization be liable for damages arising from
its use.

Layout L’IV Com Sàrl, Villars-sous-Yens, Switzerland.

Printed in South Africa.
1

TABLE OF CONTENTS
ACRONYMS. .     . . . . . . . . . . . . . . . . . . . . . . . . . . . . . . . . . . . . . . . . . . . . . . . . . . . . . . . . . . . . . . . . . . . . . . . . . . . . .     2

ACKNOWLEDGEMENTS. .           . . . . . . . . . . . . . . . . . . . . . . . . . . . . . . . . . . . . . . . . . . . . . . . . . . . . . . . . . . . . . . . . . . . . . .     3

EXECUTIVE SUMMARY. .          . . . . . . . . . . . . . . . . . . . . . . . . . . . . . . . . . . . . . . . . . . . . . . . . . . . . . . . . . . . . . . . . . . . . . .     4

INTRODUCTION. . . . . . . . . . . . . . . . . . . . . . . . . . . . . . . .        . . . . . . . . . . . . . . . . . . . . . . . . . . . . . . . . . . . . . . . . . . . .    6
   WHO global HIVDR surveillance and monitoring strategy.                          . . . . . . . . . . . . . . . . . . . . . . . . . . . . . . . . . . . . . . . . . . . .    7

EWIs OF HIVDR: MEASUREMENT OF PROGRAMMATIC QUALITY.                                . . . . . . . . . . . . . . . . . . . . . . . . . . . . . . . . . . . . . . . . . . . .    8

ASSOCIATION BETWEEN EWIs AND HIVDR. .                    . . . . . . . . . . . . . . . . . . . . . . . . . . . . . . . . . . . . . . . . . . . . . . . . . . . . . . . .     10
   Prescribing practices. . . . . . . . . . . . .        . . . . . . . . . . . . . . . . . . . . . . . . . . . . . . . . . . . . . . . . . . . . . . . . . . . . . . . .     10
    LTFU at 12 months.        . . . . . . . . . . . . . . . . . . . . . . . . . . . . . . . . . . . . . . . . . . . . . . . . . . . . . . . . . . . . . . . . . . . . .      10
    Retention on ART at 12 months..              . . . . . . . . . . . . . . . . . . . . . . . . . . . . . . . . . . . . . . . . . . . . . . . . . . . . . . . . . . . .     11
    On-time pill pick-up and on-time appointment keeping.                        . . . . . . . . . . . . . . . . . . . . . . . . . . . . . . . . . . . . . . . . . . . .     11
    Drug stock outs.      . . . . . . . . . . . . . . . . . . . . . . . . . . . . . . . . . . . . . . . . . . . . . . . . . . . . . . . . . . . . . . . . . . . . . . .      12
    Viral load suppression. .       . . . . . . . . . . . . . . . . . . . . . . . . . . . . . . . . . . . . . . . . . . . . . . . . . . . . . . . . . . . . . . . . . .      12
    Viral load completion.        . . . . . . . . . . . . . . . . . . . . . . . . . . . . . . . . . . . . . . . . . . . . . . . . . . . . . . . . . . . . . . . . . . .      12

STATISTICAL METHODS.          . . . . . . . . . . . . . . . . . . . . . . . . . . . . . . . . . . . . . . . . . . . . . . . . . . . . . . . . . . . . . . . . . . . . .      13

COVERAGE OF EWI MONITORING. .                . . . . . . . . . . . . . . . . . . . . . . . . . . . . . . . . . . . . . . . . . . . . . . . . . . . . . . . . . . . . . .     14

EWI MONITORING RESULTS.             . . . . . . . . . . . . . . . . . . . . . . . . . . . . . . . . . . . . . . . . . . . . . . . . . . . . . . . . . . . . . . . . . .      17
  Prescribing practices. . .        . . . . . . . . . . . . . . . . . . . . . . . . . . . . . . . . . . . . . . . . . . . . . . . . . . . . . . . . . . . . . . . . . .      17
    LTFU at 12 months.        . . . . . . . . . . . . . . . . . . . . . . . . . . . . . . . . . . . . . . . . . . . . . . . . . . . . . . . . . . . . . . . . . . . . .      21
    Retention on ART at 12 months..              . . . . . . . . . . . . . . . . . . . . . . . . . . . . . . . . . . . . . . . . . . . . . . . . . . . . . . . . . . . .     25
    On-time pill pick-up..      . . . . . . . . . . . . . . . . . . . . . . . . . . . . . . . . . . . . . . . . . . . . . . . . . . . . . . . . . . . . . . . . . . . .      28
    On-time appointment keeping.               . . . . . . . . . . . . . . . . . . . . . . . . . . . . . . . . . . . . . . . . . . . . . . . . . . . . . . . . . . . . .     30
    Drug stock outs.      . . . . . . . . . . . . . . . . . . . . . . . . . . . . . . . . . . . . . . . . . . . . . . . . . . . . . . . . . . . . . . . . . . . . . . .      31
    Viral load suppression and viral load completion. .                  . . . . . . . . . . . . . . . . . . . . . . . . . . . . . . . . . . . . . . . . . . . . . . . .     33

AGGREGATE EWI RESULTS BY REGION.                   . . . . . . . . . . . . . . . . . . . . . . . . . . . . . . . . . . . . . . . . . . . . . . . . . . . . . . . . . . .     35

VARIABILITY OF CLINIC PERFORMANCE WITHIN COUNTRIES.                              . . . . . . . . . . . . . . . . . . . . . . . . . . . . . . . . . . . . . . . . . . . .     36

NATIONAL AND CLINIC-LEVEL RESPONSE TO RESULTS OF EWI MONITORING.                                     . . . . . . . . . . . . . . . . . . . . . . . . . . . . . . . . . .     38

EXAMPLES OF ART PROGRAMME ACTIONS TAKEN BY COUNTRIES IN RESPONSE TO EWI RESULTS.                                                 . . . . . . . . . . . . . . . . . . . .     40
   Argentina: EWI case study. . . . . . . . . . . . . . . . . . . . . . . . . . . . . . . . . . . . . . . . . . . . .            . . . . . . . . . . . . . . . . . . . .     40
    Namibia: EWI case study.          . . . . . . . . . . . . . . . . . . . . . . . . . . . . . . . . . . . . . . . . . . . . . . . . . . . . . . . . . . . . . . . . .      41
    Zimbabwe: EWI case study. .            . . . . . . . . . . . . . . . . . . . . . . . . . . . . . . . . . . . . . . . . . . . . . . . . . . . . . . . . . . . . . . .     42

IMPROVING MONITORING AND RESPONSE FOR EWIs OF HIVDR..                                . . . . . . . . . . . . . . . . . . . . . . . . . . . . . . . . . . . . . . . . . .     43

CONCLUSION. .     . . . . . . . . . . . . . . . . . . . . . . . . . . . . . . . . . . . . . . . . . . . . . . . . . . . . . . . . . . . . . . . . . . . . . . . . . . .      44

ANNEX. . . . . . . . . . . . . . . . .   . . . . . . . . . . . . . . . . . . . . . . . . . . . . . . . . . . . . . . . . . . . . . . . . . . . . . . . . . . . . . . . .     45
  Epidemiological methods. .             . . . . . . . . . . . . . . . . . . . . . . . . . . . . . . . . . . . . . . . . . . . . . . . . . . . . . . . . . . . . . . . .     45
    Statistical methods.      . . . . . . . . . . . . . . . . . . . . . . . . . . . . . . . . . . . . . . . . . . . . . . . . . . . . . . . . . . . . . . . . . . . . .      45
    Regional and subregional country groupings..                   . . . . . . . . . . . . . . . . . . . . . . . . . . . . . . . . . . . . . . . . . . . . . . . . . . .     46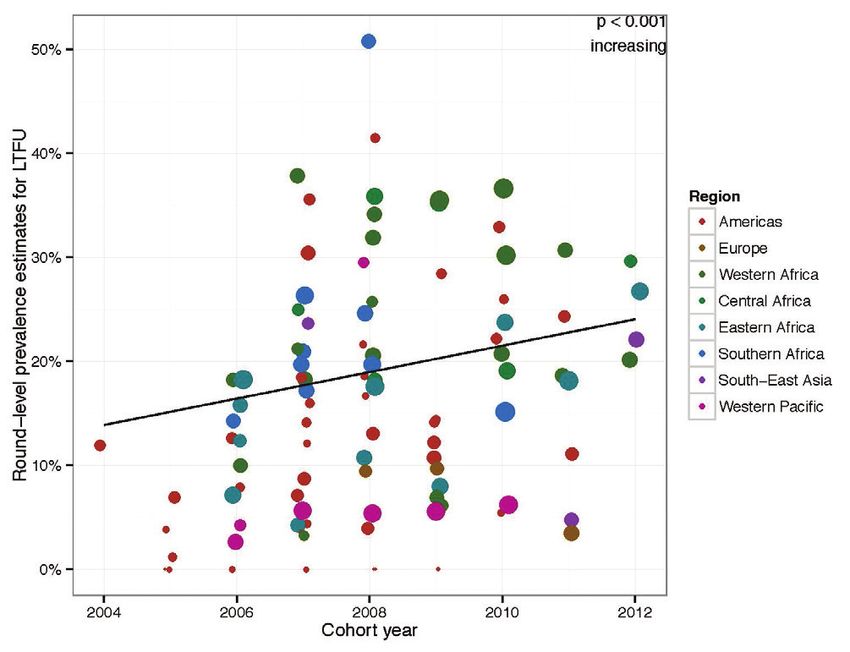
2
    Global report on early warning indicators of HIV drug resistance: technical report. July 2016

    ACRONYMS
     ART             Antiretroviral therapy
     ARV             Antiretroviral (drugs)
     CI              Confidence interval
     DRC             Democratic Republic of the Congo
     EWI             Early warning indicator of HIV drug resistance
     GEE             Generalized estimating equation
     GAP             Global Action Plan
     HIVDR           HIV drug resistance
     LMIC            Low- and middle-income countries
     LTFU            Loss to follow-up
     NNRTI           Non-nucleoside reverse-transcriptase inhibitor
     NRTI            Nucleoside reverse-transcriptase inhibitor
     PI              Protease inhibitor
     PrEP            Pre-exposure prophylaxis
     UNAIDS          Joint United Nations Programme on HIV/AIDS
     WHO             World Health Organization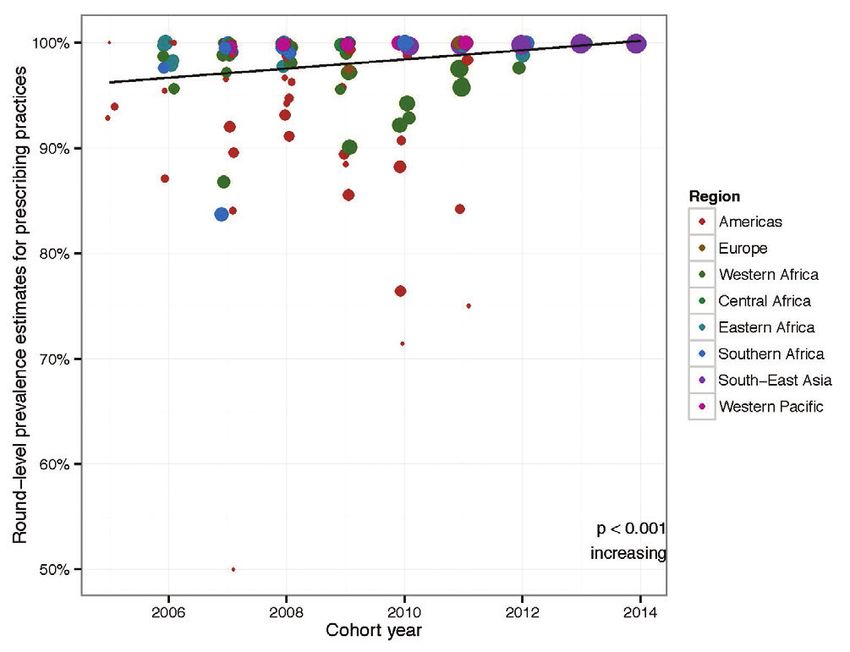
3
                                    Global report on early warning indicators of HIV drug resistance: technical report. July 2016

ACKNOWLEDGEMENTS
This report was written by Michael R. Jordan (Consultant, HIV/AIDS Department), Natalie Dean (Consultant, HIV/AIDS
Department), David Maradiaga (Consultant, HIV/AIDS Department), and Silvia Bertagnolio (HIV/AIDS Department), who
coordinated the overall report development with Meg Doherty (HIV/AIDS Department). We are grateful for the contributions
of Judith Van Holten (Consultant, HIV/AIDS Department), Hiwot Haile-Selassie (Consultant, HIV/AIDS Department), and
Jhoney Barcarolo (Consultant, HIV/AIDS Department). This work would not have been possible without the collaboration of
national HIV programme managers and staff, who supplied the data underpinning the report.

Funding to support this work came from the Bill & Melinda Gates Foundation and the United States President’s Emergency Plan for
AIDS Relief.
4
    Global report on early warning indicators of HIV drug resistance: technical report. July 2016

    EXECUTIVE SUMMARY
    With increasing global use of antiretroviral therapy (ART) to both treat and prevent HIV, and increasing global trends in HIV
    drug resistance (HIVDR), efforts to improve HIV programme quality and prevent the emergence and transmission of drug-
    resistant HIV must be strengthened. In many low- and middle-income countries (LMIC), HIVDR testing is neither routinely
    available nor recommended for individual patient management. However, monitoring patient and clinic factors associated
    with the emergence of preventable HIVDR is comparatively inexpensive, and can be used to identify gaps in the quality of
    ART service delivery favouring the emergence of HIVDR. Several ART programme and clinic factors are associated with the
    emergence of HIVDR or with successful population-level viral load suppression. These factors, or early warning indicators
    (EWIs) of HIVDR, include: the prescribing of ART according to national or international guidelines; loss to follow-up (LTFU)
    and retention on ART 12 months after treatment initiation; on-time pill pick-up; on-time appointment keeping; pharmacy
    stock outs; and viral load suppression. Monitoring and the site level quality improvements in response to EWIs form the
    foundation of HIVDR prevention, and link WHO-recommended surveillance of HIVDR to programmatic interventions designed
    to minimize it. EWI definitions and targets follow an international standard, and the World Health Organization (WHO)
    recommends that countries monitor them on an annual basis through the implementation of the Consolidated strategic
    information guidelines for HIV in the health sector.1

    This global report is based on 59 countries that reported data from more than 12 000 clinics from cohorts of patients
    receiving ART between 2004 and 2014. The report includes the most recent clinic-level data reported to WHO in 2015–2016
    and reflects a lag due to the 12 month cohort reporting period. Globally, amongst the clinics reporting data, high levels of
    appropriate antiretroviral (ARV) drug prescribing were observed, with over 99% of people prescribed regimens according to
    national or international HIV treatment guidelines. Global levels of LTFU at 12 months during the same period averaged 20%,
    exceeding the WHO-recommended target of 15%. Moreover, global levels of LTFU among clinics reporting data increased
    significantly over time, from 11.9% in 2004 to 24.5% in 2012 (p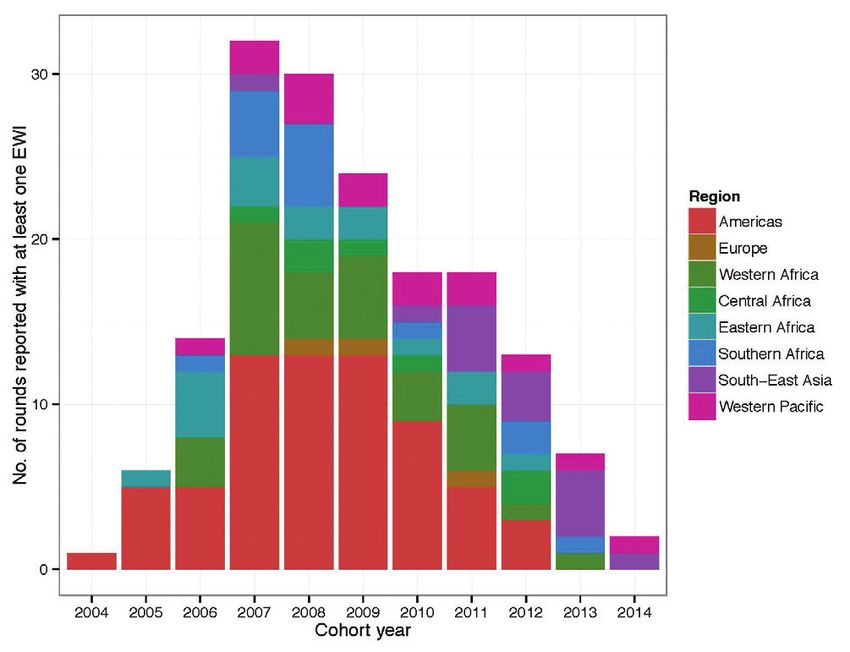
5
                                                     Global report on early warning indicators of HIV drug resistance: technical report. July 2016

However, increased attention is urgently needed to decrease levels of LTFU, support retention, maximize adherence,
and prevent drug stock outs. The updated Consolidated guidelines on the use of ARV drugs for treating and preventing
HIV infection, has an expanded service delivery chapter containing new recommendations to support linkage, retention,
adherence and supply chain management to address the lack of standard evidence-informed approaches and interventions
found in some programmes and clinics. Closing these gaps and maximizing the quality of ART service delivery are especially
important in light of the increasing levels of HIVDR recently documented in several LMIC. WHO is developing a comprehensive
Global Action Plan (GAP) for HIVDR for the period 2017–2021, which will coordinate all stakeholders and encourage action at
all geographic levels. This global call to action, which will outline appropriate responses to HIVDR, is planned for release in
early 2017.

As of 2015, 17 million people were receiving ART globally1, and over the next decade, ever larger numbers of people must
initiate and be successfully maintained on ART. Although reporting of clinic-specific EWIs has declined in recent years, this
is in part due to the transition of these indicators into a subset of recommended global and national indicators in WHO’s
2015 Consolidated strategic information guidelines for HIV in the health sector. Therefore, reporting and a comprehensive
response to documented suboptimal performance is anticipated to increase in coming years as countries fully adopt and
implement the WHO indicator reporting along the cascade of treatment and care. Integration of HIVDR EWIs into routine
clinic and programme monitoring and evaluation (M&E) system, followed by rapid investigation and response to suboptimal
performance (data use), will allow ART clinics and programmes to improve the quality of service delivery. This EWI report
reaffirms the need to develop a GAP for HIVDR to ensure HIVDR does not undermine the achievement of the global targets
on health and HIV, and to secure effective high-quality treatment for all target groups, including key populations, pregnant
women, children and adolescents – thereby helping to ensure a future generation free from AIDS.

1
    Global AIDS Update 2016. Geneva: UNAIDS. 2016. Available at: http://www.unaids.org/sites/default/files/media_asset/global-AIDS-update-2016_en.pdf.
6
    Global report on early warning indicators of HIV drug resistance: technical report. July 2016

    INTRODUCTION
    Scale-up of antiretroviral therapy (ART) for the treatment of all HIV-infected individuals is an international health-care
    priority. To date, the success of global ART scale-up has been largely due to a public health approach to treatment, which
    includes standardized and simplified treatment regimens consistent with international standards and appropriate to local
    circumstances. This public health approach has been the keystone of the WHO treatment and care approaches and has been
    well supported by the sustained commitment of national governments, international agencies and donors.

    In 2015, the Joint United Nations Programme on HIV/AIDS (UNAIDS) set ambitious global targets, including “90-90-90” by
    the year 2020 (i.e. 90% of all people living with HIV have been diagnosed; 90% of all people with diagnosed HIV infection
    are taking ART; and 90% of all people taking ART have suppressed viral load), and the elimination of AIDS as a public health
    threat by 2030.1

    As of 2015, 17 million people were receiving ART globally − this means that by 2020, an additional 15 million people must
    initiate and be successfully maintained on ART for life. The treatment of millions of people with antiretroviral (ARV) drugs will
    inevitably be accompanied by the emergence and transmission of drug-resistant virus.

    The 2016 World Health Organization (WHO) Consolidated guidelines on the use of ARV drugs for treating and preventing HIV
    infection recommend testing and treating all patients, regardless of CD4 cell count, and the use of pre-exposure prophylaxis
    (PrEP) for those at high risk of infection. 2 The “Treat All” approach combined with scale-up of PrEP will undoubtedly lead to
    a decrease in HIV incidence and propel the global community toward the elimination of AIDS as a public health threat. Yet
    paradoxically, despite these prevention and treatment recommendations, an increase in HIV drug resistance (HIVDR) amongst
    those infected may be observed because as the number of new infections decrease, the proportion due to transmission
    from people with previous exposure to ARV drugs through PMTCT or previous treatment will increase; therefore, the risk of
    transmitted HIVDR among the very few infected may increase. 3,4

    The human and financial consequences of HIVDR are likely to be significant. With limited access in low- and middle-
    income countries (LMIC) to a broad range of ARV drugs from different drug classes, HIVDR will limit treatment options and
    may necessitate a switch to more expensive regimens associated with greater long-term toxicity. Additionally, significant
    population-levels of HIVDR may lead to a reversal of hard-won gains in HIV/AIDS-related morbidity and mortality. 5

    Levels of pre-treatment HIVDR in LMIC have increased between 2004 and 2010. This increase has primarily been driven
    by raised levels of resistance to non-nucleoside reverse-transcriptase inhibitors (NNRTIs) in Africa.6,7 More recently, higher
    levels of HIVDR have been observed amongst people naïve to ARV drugs in several LMIC settings, including Angola (16%),
    Argentina (10%), Botswana (10), Cuba (22%), Mexico (9%), Papua New Guinea (16%), and South Africa (14%). 8,9,10,11,12,13,14

    Faced with the need to initiate and maintain millions more people on ART, in order to eliminate AIDS as a public health threat
    during a time of limited global financial resources, efforts to identify gaps in ART programme functioning and to improve
    the quality of ART service delivery cannot be underestimated. The identification and correction of gaps in the quality of
    service delivery, as detected through the monitoring of early warning indicators (EWIs), will help to maximize the long-term
    durability and effectiveness of current and future recommended regimens, and to ensure that the WHO/UNAIDS targets
    to eliminate AIDS as a public health threat are achieved. Now, more than ever, to achieve the 90-90-90 global target, it is
    imperative that “Treat All” be accompanied by a greatly heightened focus on quality. It is only in this way that access to ART
    for all can achieve its greatest impact and usher in an AIDS-free generation.

    1
       90–90–90 : An ambitious treatment target to help end the AIDS epidemic. Geneva: UNAIDS; 2014. Available at: http://www.unaids.org/sites/default/files/media_asset/90-90-90_en_0.pdf.
    2
       Consolidated guidelines on the use of antiretroviral drugs for treating and preventing HIV infection. Recommendations for a public health approach. Second edition. Geneva: World Health
       Organization; 2016. Available at: http://www.who.int/hiv/pub/arv/arv-2016/en.
    3
       Nichols BE, Sigaloff KC, Kityo C, Mandaliya K, Hamers RL, Bertagnolio S et al. Averted HIV infections due to expanded antiretroviral treatment eligibility offsets risk of transmitted drug
       resistance: a modeling study. AIDS. 2014;28(1):73–83.
    4
       Cambiano V, Bertagnolio S, Jordan MR, Pillay D, Perriëns JH, Venter F et al. Predicted levels of HIV drug resistance: potential impact of expanding diagnosis, retention, and eligibility criteria
       for antiretroviral therapy initiation. AIDS. 2014;28(Suppl 1):S15–S23.
    5
       Cambiano V, Bertagnolio S, Jordan MR, Lundgren JD, Phillips A. Transmission of drug resistant HIV and its potential impact on mortality and treatment outcomes in resource-limited settings.
       J Infect Dis. 2013;207(Suppl 2):S57–62.
    6
       WHO HIV drug resistance report 2012. Geneva: World Health Organization; 2012. Available at: http://www.who.int/hiv/pub/drugresistance/report2012/en/.
    7
       Gupta RK, Jordan MR, Sultan BJ, Hill A, Davis DHJ, Gregson J et al. Global trends in antiretroviral resistance in treatment-naive individuals with HIV after rollout of antiretroviral treatment
       in resource-limited settings: a global collaborative study and meta-regression analysis. Lancet. 2012;380(9849):1250–8.
    8
       Afonso JM, Bello G, Guimarães ML, Sojka M, Morgado MG. HIV-1 genetic diversity and transmitted drug resistance mutations among patients from the North, Central and South regions of
       Angola. PLoS ONE. 2012;7(8):e42996.
    9
       Emiliano Bissio, Argentina ART Programme. Personal communication. May 2016.
    10
       Rowley CF, MacLeod IJ, Maruapula D, Lekoko B, Gaseitsiwe S, Mine M et al. Sharp increase in rates of HIV transmitted drug resistance at antenatal clinics in Botswana demonstrates the
       need for routine surveillance. J Antimicrob Chemother. 2016;71(5):1361–6.
    11
       Pérez L, Kourí V, Alemán Y, Abrahantes Y, Correa C, Aragonés C et al. Antiretroviral drug resistance in HIV-1 therapy-naive patients in Cuba. Infect Genet Evol. 2013 June;16:144–50.
    12
       Avila-Rios S, Garcia-Morales C, Tapia-Trejo D, Matías-Florentino M, Quiroz-MoralesV, Casillas –Rodríguez J et al. HIV pre-treatment drug resistance in Mexico: a nationally representative
       WHO survey. Abstract 64. XXV International HIV Drug Resistance Workshop, Boston, USA, 2016.
    13
       Lavu E, Dala N, Gurung, A, Kave E, Mosoro E, Markby J et al. Transmitted HIV drug resistance survey in two provinces in Papua New Guinea. Poster: MOPED723. IAS 2015. Vancouver,
       Canada.
    14
       National Institute for Communicable Diseases, Division of the National Health Laboratory Service. Prospective sentinel surveillance of human immunodeficiency virus related drug
       resistance. Communicable Disease Communiqué. 2016 March; 15:10-11.
7
Global report on early warning indicators of HIV drug resistance: technical report. July 2016
WHO global HIVDR surveillance and monitoring strategy
Because of the error prone nature of HIV, its high mutation rate in the presence of drug selective pressure and the need for
lifelong treatment, some HIVDR will inevitably occur among patients taking ART even when optimal adherence to therapy is
supported. To address this threat to the success of ART scale-up, WHO developed a global HIVDR surveillance and monitoring
strategy in 2004, subsequently updating it in 2015.1 The strategy consists of four key activities:
(1) the annual monitoring of EWIs of HIVDR at all ART clinics, or a representative sample of ART clinics within a country;
(2) surveillance of pre-treatment HIVDR in adult populations initiating first-line ART;
(3) surveillance of acquired HIVDR in adults and children on treatment; and
(4) surveillance of HIVDR in infants less than 18 months of age.
The WHO HIVDR strategy is designed to provide countries with actionable information to improve clinic and programme
performance, and to support ART regimen selection. EWI monitoring forms the foundation of the WHO-recommended HIVDR
strategy to improve quality. Monitoring EWIs of HIVDR provides a record of clinic and programme performance, which helps
contextualize results from national surveillance of HIVDR. Additionally, clinic- and programme-level responses taken to
improve suboptimal performance will support not only the minimization of preventable HIVDR, but also the optimization of
population ART outcomes. More details about the WHO HIVDR strategy can be found at: http://www.who.int/hiv/topics/
drugresistance/en/. The strategy is supported by the WHO HIVResNet HIVDR Laboratory Network – a network of 31 WHO-
designated laboratories, which undergo an annual evaluation and provide high-quality HIVDR genotyping for countries
implementing HIVDR surveys. 2
1
HIV drug resistance surveillance guidance: 2015 update. Geneva: The World Health Organization; 2015. Available at: http://www.who.int/hiv/pub/drugresistance/hiv-drug-resistance-2015-
update/en/.
2
Bertagnolio S, Derdelinckx I, Parker M, Fitzgibbon J, Fleury H, Peeters M et al. World Health Organization/HIVResNet drug resistance laboratory strategy. Antiviral Therapy.
2008;Vol.13;(Suppl 2):49–57.8
Global report on early warning indicators of HIV drug resistance: technical report. July 2016
EWIs OF HIVDR: MEASUREMENT OF
PROGRAMMATIC QUALITY
Many factors are associated with the emergence of HIVDR. They include viral factors (e.g. subtype, replication capacity,
and pre-existing polymorphisms); drug-related factors (e.g. drug potency, pharmacokinetics, drug-drug interactions, drug
tolerability, and genetic barrier to selection of resistance); and programme factors (e.g. patient adherence to prescribed ART,
drug supply continuity, and retention of patients on treatment). Although viral and drug-related factors are often beyond
the control of public health or programme action, the monitoring of programme factors associated with HIVDR can alert ART
programmes to situations that may favour the emergence of HIVDR or virological failure at the population level.
EWIs monitor factors related to patient care (appropriate prescribing and viral load suppression at 12 months); patient
behaviour (adherence); and clinic-level and programme management (loss to follow-up, retention on ART, and procurement
and supply management of ARV drugs).
Each EWI has an internationally agreed-upon standardized definition and accompanying target(s). This allows clinics to
be classified into one of three performance strata: green (excellent performance, achieving the desired level); amber (fair
performance, not yet at desired level); and red (poor performance, below desired level).1 Stratified EWI targets provide clinic-
specific and programme-level benchmarks against which to assess performance – thus facilitating identification of areas
of greatest need and allocation of resources to close gaps in service delivery. ART clinic or programme performance below
desired targets prompts investigation and implementation of programmatic and/or public health actions to improve quality
of ART service delivery – thereby minimizing the emergence of preventable HIVDR (see Examples of ART programme action
taken by countries in response to EWI results, page 40). Annual monitoring of EWIs allows for measurement of degrees of
improvement or decline over time, both within and between clinics. To encourage their routine monitoring and use, EWIs have
been fully integrated into WHO’s 2015 Consolidated strategic information guidelines for HIV in the health sector. 2
WHO-recommended EWIs of HIVDR and their respective targets are summarized in Table 1. Associations between EWIs
and HIVDR are discussed in the following section. Additional information about EWIs may be found in the Epidemiological
methods section of the Annex.
Development of EWI definitions and targets
EWIs use standardized definitions and targets grounded in medical and scientific literature. The original definitions
and targets were proposed in 2008. In 2011, an advisory panel reviewed existing EWI definitions and targets; each
EWI was considered separately for its association with HIVDR. After critical review of available medical literature
using the GRADE methodology, the panel used a mix of normative and criterion referencing to set EWI targets3.
Normative referencing is the establishment of targets based on mean levels of performance. When using normative
referencing results above a central value are considered “good” performance, and results below a central value are
considered “poor” performance. A systematic review of the literature provided the mean levels of performance for each
EWI. An important limitation of normative referencing is that it may reflect poor existing practices and lack aspiration.
Criterion referencing is the establishment of targets based on attainment of desirable levels of performance. Criterion
referencing may be evidence-based but often necessitates expert opinion to set targets. To balance the strengths and
limitations of normative and criterion referencing, a “mixed methods” approach to target setting was used and expert
opinion was used to establish targets when available evidence was lacking. More information on how EWI targets were
established, including results from the systematic review of the literature may be found online in the Report of the early
warning indicator advisory panel meeting (11–12 August 2011): Using early warning indicators to prevent HIV drug
resistance ; available at: http://www.who.int/hiv/pub/meetingreports/ewi_meeting_report/en/.
1
The EWIs “prescribing practices” and “drug stock outs” have only two strata: green (excellent) and red (poor).
2
Consolidated strategic information guidelines for HIV in the health sector. Geneva: World Health Organization; 2015. Available at: http://www.who.int/hiv/pub/guidelines/strategic-
information-guidelines/en/.
3
Using early warning indicators to prevent HIV drug resistance. Report of the Early Advisory Indicator Panel meeting (11–12 August 2011). Geneva: World Health Organization; 2012.
Available at: http://www.who.int/hiv/pub/meetingreports/ewi_meeting_report/en/.9
Global report on early warning indicators of HIV drug resistance: technical report. July 2016
Table 1. WHO HIVDR EWIs: definitions and associated targets
Target:
excellent performance
fair performance
EWI poor performance
Prescribing practices : 100%
% of ART prescriptions congruent with national/international guidelines : 85%
% of patients retained in care 12 months after ART initiation : 75–85%
: 90%
% of patients with 100% on-time drug pick-up during the first 12 months of ART or : 80–90%
during a specified time period : 80%
% of patients attending all clinic appointments on time during the first 12 months of : 70–80%
ART or during a specified time period : 0%
Viral load suppression7 : >90%
% of patients with viral load10
Global report on early warning indicators of HIV drug resistance: technical report. July 2016
ASSOCIATION BETWEEN EWIs AND HIVDR
Prescribing practices
The goals of HIV treatment include a reduction in HIV-associated morbidity and mortality, restoration and preservation of
immunologic function, durable suppression of plasma HIV viral load, and prevention of HIV transmission. Achieving viral
suppression requires the use of three active drugs from two or more drug classes. The evidence that virological failure
and HIVDR are closely associated with the prescription of suboptimal ART is supported by a large number of prospective
randomized clinical trials and observational studies.
In the late 1980s and mid-1990s, studies of nucleoside reverse transcriptase inhibitor (NRTI) or protease inhibitor (PI) mono-
therapy reported initial reductions in levels of circulating virus, followed by high rates of virological failure, accompanied
by selection of HIVDR.1,2,3 Randomized trials of different ARV drug combinations documented the virological and clinical
superiority of double NRTI therapy over NRTI mono-therapy.4 Subsequently, the superiority of three drugs, including either a
PI or NNRTI, over double NRTI regimens was confirmed.5,6,7,8
Based on this evidence, as well as other data measuring levels of virological suppression,9 the prescribing of mono- or dual-
therapy for the treatment of HIV infection is never recommended by national or international treatment guidelines. Ensuring
that individuals being treated for HIV infection receive appropriate triple-drug therapy is therefore an essential step towards
maximizing population-level viral load suppression and minimizing HIVDR. The prescribing practices indicator evaluates ART
clinic compliance with prescribing regimens congruent with national and/or international ART guidelines.
The WHO-suggested target for prescribing practices is 100% of patients being dispensed appropriate ART, where
“appropriate” is defined as a regimen appearing on national or international treatment guidelines.
LTFU at 12 months
From the perspective of a clinic initiating ART, the majority of treatment initiators should be alive and on treatment at the
same clinic after one year. However, some patients will have died, transferred care to a different clinic (transfer out), or
stopped treatment while remaining at the same clinic. Still others will have unknown outcomes, and thus be classified as
“loss to follow-up” (LTFU). The LTFU classification means that information is unavailable to classify patients as deceased,
alive and in care (at the site of treatment initiation or at a different one), or having disengaged from care three months after
their last scheduled appointment or drug pick-up. As ART services are increasingly decentralized, many individuals may in fact
have stopped treatment at one clinic and reinitiated it at another, without documentation or transfer of records. This practice
is commonly referred to as a “silent transfer”. The relative frequency of each of these reasons for “loss” has been observed to
vary across clinics.10,11,12,13,14 The frequency and duration of treatment gaps experienced due to silent transfers is largely unknown;
however, it is likely that many of these people experience treatment interruptions placing them at substantial risk for
selection of resistant virus. For example, 24% of individuals with previous treatment interruption who experienced virological
failure on an NNRTI-based regimen three months after its re-initiation had resistance to the NNRTI drug class.15 Preliminary
analysis of a 2015 study conducted by WHO and the Ministry of Health in Malawi showed that 40% of 52 individuals traced
after having been classified as LTFU, who had successful HIVDR genotyping at two sites in Malawi, harboured major NNRTI
dug-resistance mutations (WHO and Ministry of Health, Malawi, unpublished data, 2015).
1
Fischl MA, Richman DD, Grieco MH, Gottlieb MS, Volberding PA, Laskin OL et al. The efficacy of azidothymidine (AZT) in the treatment of patients with AIDS and AIDS-related complex. A
double-blind, placebo-controlled trial. N Engl J Med. 1987;317:185–191.
2
Ho DD, Neumann AU, Perelson AS, Chen W, Leonard JM, Markowitz M. Rapid turnover of plasma virions and CD4 lymphocytes in HIV-1 infection. Nature. 1995;373:123–126.
3
Larder BA, Darby G, Richman DD. HIV with reduced sensitivity to zidovudine (AZT) isolated during prolonged therapy. Science. 1989;243: 1731–1734.
4
Hammer SM, Katzenstein DA, Hughes MD, Gundacker H, Schooley RT, Haubrich RH et al. A trial comparing nucleoside monotherapy with combination therapy in HIV-infected adults with
CD4 cell counts from 200 to 500 per cubic millimeter. AIDS Clinical Trials Group Study 175 Study Team. N Engl J Med. 1996; 335:1081–1090.
5
D’Aquila RT, Hughes MD, Johnson VA, Fischl MA, Sommadossi JP, Liou SH et al. Nevirapine, zidovudine, and didanosine compared with zidovudine and didanosine in patients with HIV-1
infection. A randomized, double-blind, placebo-controlled trial. National Institute of Allergy and Infectious Diseases AIDS Clinical Trials Group Protocol 241 Investigators. Ann Intern Med.
1996;124(12):1019–1030.
6
Hammer SM, Squires KE, Hughes MD, Grimes JM, Demeter LM, Currier JS et al. A controlled trial of two nucleoside analogues plus indinavir in persons with human immunodeficiency virus
infection and CD4 cell counts of 200 per cubic millimeter or less. AIDS Clinical Trials Group 320 Study Team. N Engl J Med. 1997;337:725–733.
7
Montaner JS, Reiss P, Cooper D, Vella S, Harris M, Conway B et al. A randomized, double-blind trial comparing combinations of nevirapine, didanosine, and zidovudine for HIV-infected
patients: the INCAS Trial. Italy, The Netherlands, Canada and Australia Study. JAMA. 1998;279:930–937.
8
Djomand G, Roels T, Ellerbrock T, Hanson D, Diomande F, Monga B et al. Virologic and immunologic outcomes and programmatic challenges of an antiretroviral treatment pilot project in
Abidjan, Cote d’Ivoire. AIDS. 2003;17(Suppl. 3):S5–15.
9
Jordan R, Gold L, Cummins C, Hyde C. Systematic review and meta-analysis of evidence for increasing numbers of drugs in antiretroviral combination therapy. BMJ. 2002;324(7340):757.
10
McGuire M, Munyenyembe T, Szumilin E, Heinzelmann A, Le Paih M, Bouithy N et al. Vital status of pre-ART and ART patients defaulting from care in rural Malawi. Trop Med Int Health.
2010;15(Suppl 1):55–62.
11
Maskew M, MacPhail P, Menezes C, Rubel D. Lost to follow up: contributing factors and challenges in South African patients on antiretroviral therapy. S Afr Med J. 2007;97(9):853–7.
12
Amuron B, Namara G, Birungi J, Nabiryo C, Levin J, Grosskurth H et al. Mortality and loss-to-follow-up during the pre-treatment period in an antiretroviral therapy programme under normal
health service conditions in Uganda. BMC Public Health. 2009;9:290. doi: 10.1186/1471-2458-9-290.
13
Geng EH, Bangsberg DR, Musinguzi N, Emenyonu N, Bwana MB, Yiannoutsos CT et al. Understanding reasons for and outcomes of patients lost to follow-up in antiretroviral therapy
programs in Africa through a sampling-based approach. J Acquir Immune Defic Syndr. 2010;53(3):405–11. doi: 10.1097/QAI.0b013e3181b843f0.
14
Dalal RP, Macphail C, Mqhayi M, Wing J, Feldman C, Chersich MF et al. Characteristics and outcomes of adult patients lost to follow-up at an antiretroviral treatment clinic in Johannesburg,
South Africa. J Acquir Immune Defic Syndr. 2008;47(1):101–7.
15
Luebbert J, Tweya H, Phiri S, Chaweza T, Mwafilaso J, Hosseinipour MC et al. Virological failure and drug resistance in patients on antiretroviral therapy after treatment interruption in
Lilongwe, Malawi. Clin Infect Dis. 2012;55(3):441–8. doi: 10.1093/cid/cis438.11
Global report on early warning indicators of HIV drug resistance: technical report. July 2016
The LTFU indicator measures the proportion of patients with unknown outcomes at a single point in time: 12 months after
ART initiation. Operationally, because known deaths and documented transfers of care to other clinics are censored (i.e.
excluded from the denominator), the indicator estimates a clinic’s performance in classifying deaths, documenting transfers
of care from one facility to another, and minimizing patient disengagement from care. LTFU is therefore closely related to
retention in care at 12 months. WHO’s suggested target for this indicator is less than 15% LTFU at 12 months.
Retention on ART at 12 months
Maintaining high levels of engagement with patients in care and on continuous ART is fundamental to achieving global HIV
treatment goals. Studies document that most attrition occurs during the first two years on ART, a time when mortality is
known to be highest.1,2 Treatment programmes with active tracing of defaulters have higher overall levels of retention (80.0%
vs. 75.8%; p = 0.04) and higher retention at the original clinic of treatment initiation (80.0% vs. 72.9%; p = 0.02). 3 As with
LTFU, patients not retained on ART have experienced treatment interruption and are therefore at risk for selection of drug-
resistant virus, which could in turn compromise individual- and population-level treatment outcomes.
Monitoring the number of patients retained on ART is important for estimating the proportion of patients dying or
experiencing disengagement from care. As with LTFU, accurately characterizing these outcomes can lead to targeted
interventions to minimize treatment interruptions and decrease mortality. The retention indicator monitors a clinic’s
performance in maintaining patient engagement in care, effectively preventing deaths and minimizing unknown treatment
outcomes. WHO’s suggested target for retention at 12 months is above 85%.
On-time pill pick-up and on-time appointment keeping
Sustained long-term adherence to ART is critical to achieving the desired individual- and population-level benefits of HIV
treatment. Studies document virological failure and selection of drug-resistant HIV amongst individuals receiving NNRTI-
based regimens who experience treatment interruptions of more than 48 hours.4,5 Despite the clear link between suboptimal
adherence to ART and the emergence of HIVDR, the estimation of patient and population adherence to ART may pose
challenges. For example, patient self-reported adherence and provider perception of patient adherence have been shown to
be unreliable.6 Despite limitations, prescription or pill-based methods do not rely on special technology (e.g. MEMS caps) or
require significant human and financial resources (e.g. unannounced home-based pill counts) to estimate adherence. They are
objective estimates calculated by abstraction and analysis of routinely captured pharmacy or clinic dispensing data.7 Although
simple, these methods have been demonstrated to predict virological and drug-resistance outcomes. 8,9,10,11,12
The on-time pill pick-up indicator provides a high-level assessment of how well populations of patients at a clinic perform
in picking up prescribed ART on or before the pill run-out date, if taken according to schedule. WHO’s suggested target for
desirable clinic-level performance for on-time pill pick-up is above 90%.
Like on-time pill pick-up, on-time clinic appointment keeping is a proxy measure of patient adherence to ART, and has been
correlated with ART adherence.13,14 The on-time appointment keeping indicator estimates clinic performance in successfully
engaging patients to attend scheduled appointments. Late clinic attendance has been shown to be associated with virological
failure.15 WHO’s suggested target for desirable clinic-level performance of this indicator is above 80%.
1
Lawn SD, Harries AD, Anglaret X, Myer L, Wood R. Early mortality among adults accessing antiretroviral treatment programmes in sub-Saharan Africa. AIDS. 2008;22(15):1897–908.
2
Hassan AS, Mwaringa SM, Ndirangu KK, Sanders EJ, Rinke TF, Berkley JA. Incidence and predictors of attrition from antiretroviral care among adults in a rural HIV clinic in Coastal Kenya: a
retrospective cohort study. BMC Public Health. 2015;15:478.
3
McMahon JH, Elliott JH, Hong SY, Bertagnolio S, Jordan MR. Effects of physical tracing on estimates of loss to follow-up, mortality and retention in low and middle income country
antiretroviral therapy programs: a systematic review. PLoS ONE. 2013;8(2):e56047.
4
Oyugi JH, Byakika-Tusiime J, Ragland K, Laeyendecker O, Mugerwa R, Kityo C et al. Treatment interruptions predict resistance in HIV-positive individuals purchasing fixed-dose combination
antiretroviral therapy in Kampala, Uganda. AIDS. 2007;21(8):965–71.
5
Parienti JJ, Massari V, Descamps D, Vabret A, Bouvet E, Larouzé B et al. Predictors of virologic failure and resistance in HIV-infected patients treated with nevirapine- or efavirenz-based
antiretroviral therapy. Clin Infect Dis. 2004;38(9):1311–6.
6
Goldman JD, Cantrell RA, Mulenga LB, Tambatamba BC, Reid SE, Levy JW et al. Simple adherence assessments to predict virologic failure among HIV-infected adults with discordant
immunologic and clinical responses to antiretroviral therapy. AIDS Res Hum Retroviruses. 2008;24:1031–5.
7
McMahon JH, Jordan MR, Kelley K, Bertagnolio S, Hong SY, Wanke CA et al. Pharmacy adherence measures to assess adherence to antiretroviral therapy: review of the literature and
implications for treatment monitoring. Clin Infect Dis. 2011;52(4):493–506.
8
Harrigan PR, Hogg RS, Dong WW, Yip B, Wynhoven B, Woodward J et al. Predictors of HIV drug-resistance mutations in a large antiretroviral-naive cohort initiating triple antiretroviral
therapy. J Infect Dis. 2005;191(3):339–47.
9
King MS, Brun SC, Kempf DJ. Relationship between adherence and the development of resistance in antiretroviral-naive, HIV-1-infected patients receiving lopinavir/ritonavir or nelfinavir. J
Infect Dis. 2005;191(12):2046–52.
10
Jonas A, Sumbi V, Mwinga S, DeKlerk M, Tjituka F, Penney S et al. HIV drug resistance early warning indicators in Namibia with updated World Health Organization guidance. PLoS ONE.
2014;9(7):e100539.
11
Orrell C, Cohen K, Leisegang R, Bangsberg DR, Maartens G, Wood R. Comparing adherence methods: which best predicts virological and resistance outcome? Conference on Retroviruses
and Opportunistic Infections. Boston. February 2016. Poster 1029.
12
V Cambiano, Lampe FC, Rodger AJ, Smith CJ, Geretti AM, Lodwick RK et al. Use of a prescription-based measure of antiretroviral therapy adherence to predict viral rebound in HIV-infected
individuals with viral suppression. HIV Medicine. 2010;11(3):216–224.
13
Chalker JC, Andualem T, Gitau LN, Nitaganira J, Obua C, Tadeg H et al. Measuring adherence to antiretroviral treatment in resource-poor settings: the feasibility of collecting routine data
for key indicators. BMC Health Serv Res. 2010;10:43. doi: 10.1186/1472-6963-10-43.
14
White YR, Pierre RB, Steel-Duncan J, Palmer P, Evans-Gilbert T, Moore J et al. Adherence to antiretroviral drug therapy in children with HIV/AIDS in Jamaica. West Indian Med J.
2008;57(3):231–7.
15
Blacher RJ, Muiruri P, Njobvu L, Mutsotso W, Potter D, Ong’ech J et al. How late is too late? Timeliness to scheduled visits as an antiretroviral therapy adherence measure in Nairobi, Kenya
and Lusaka, Zambia. AIDS Care. 2010;22(11):1323–1331.12
Global report on early warning indicators of HIV drug resistance: technical report. July 2016
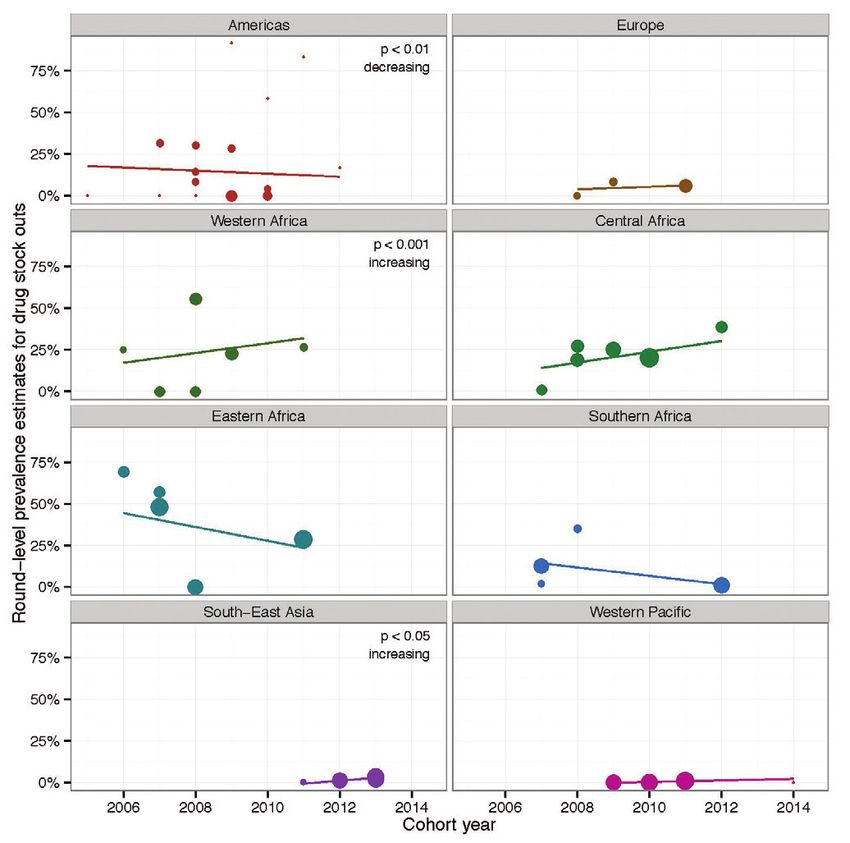
Drug stock outs
Procurement (the country-level process of ordering ARV drugs) and supply chain management (the systems by which they
are distributed to health-care facilities) are critical processes required to move ARV drugs from manufacturers to patients.
Success of ART access in a country depends not only on procurement, but also on a robust and reliable drug distribution
system, which is able to account for stock down to the lowest level (often a clinic dispensary). This is because what affects
patients most is drug availability at the place where it is picked up, not its availability at a district or central warehouse.
Stock outs of ARV drugs are linked to the emergence of HIVDR, and may even double the risk of treatment interruptions and
death.1 To avoid treatment interruptions, clinics may resort to substitution of one ARV drug for another, or switch patients to
a drug from a different class. These obligatory changes may be associated with suboptimal adherence, unanticipated toxicity
or adverse events. An additional strategy in the face of limited stock is dispensing fewer days of the drug than prescribed – a
strategy that may negatively impact adherence and ultimately lead to a decrease in retention.
The stock out indicator monitors whether ART clinics (dispensaries or pharmacies) maintain a continuous supply of routinely
dispensed ARV drugs at all times. This indicator is particularly important given that data, not surprisingly, link stock outs
to treatment interruptions. 2 Specifically, this indicator measures the proportion of months in a calendar year with any ARV
drug stock out. As all routinely dispensed ARV drugs are expected to be available at clinic dispensaries at all times, WHO’s
suggested target for this indicator is 0% of months with a stock out.
Viral load suppression
The association between virological failure and HIVDR is strong. Three randomized controlled trials report selection of
HIVDR in at least 70% of patients with virological failure, 3,4,5 with two of the three studies documenting no HIVDR at ART
initiation. 3,4 Additionally, numerous studies document HIVDR in significant proportions of patients with virological
failure.6,7,8,9,10,11 Achieving high levels of viral load suppression within populations on ART minimizes morbidity and mortality
and decreases HIV incidence; furthermore, the emergence of HIVDR is prevented amongst those with virological suppression.
The viral load suppression indicator measures how well clinics perform in reaching virological suppression targets. WHO’s
suggested target for desirable performance for this indicator is over 90% viral load suppression amongst those alive and on
ART 12 months after treatment initiation.
Viral load completion
Attaining high levels of viral load suppression is inextricability linked with high levels of viral load access and completion. The
lack of routine viral load monitoring and appropriate action to detected virological failure is associated with the emergence of
HIVDR, as patients remain on a failing regimen and accumulate resistance mutations.12,13,14,15 The viral load completion indicator
measures the proportion of patients with a 12-month viral load test result available in their medical records. WHO’s 2016 ART
guidelines16 recommend early viral load testing (within six months of treatment initiation), again at 12 months, and at least
annually thereafter. The viral load completion indicator measures a programme’s capacity to implement viral load testing and
assure that the result is returned to a patient’s records, maximizing the likelihood of it being reviewed and acted upon by
providers, if necessary. WHO’s recommended target for this indicator is 70% or greater viral load completion at 12 months.
1
Pasquet A, Messou E, Gabillard D, Minga A, Depoulosky A, Deuffic-Burban S et al. Impact of drug stock-outs on death and retention to care among HIV-infected patients on combination
antiretroviral therapy in Abidjan, Côte d’Ivoire. PLoS ONE. 2010;5(10):e13414.
2
Marcellin F, Boyer S, Protopopescu C, Dia A, Ongolo-Zogo P, Koulla-Shiro S et al. Determinants of unplanned antiretroviral treatment interruptions among people living with HIV in Yaoundé,
Cameroon (EVAL survey, ANRS 12-116). Trop Med Int Health. 2008;13(12):1470–1478.
3
Bussmann H, Wester CW, Thomas A, Novitsky V, Okezie R, Muzenda T et al. Response to zidovudine/didanosine-containing combination antiretroviral therapy among HIV-1 subtype
C-infected adults in Botswana: two-year outcomes from a randomized clinical trial. J Acquir Immune Defic Syndr. 2009;51(1):37–46.
4
Lyagoba F, Dunn DT, Pillay D, Kityo C, Robertson V, Tugume S et al. Evolution of drug resistance during 48 weeks of zidovudine/lamivudine/tenofovir in the absence of real-time viral load
monitoring. J Acquir Immune Defic Syndr. 2010;55(2):277–283.
5
Ndembi N, Goodall RL, Dunn DT, McCormick A, Burke A, Lyagoba F et al. Viral rebound and emergence of drug resistance in the absence of viral load testing: a randomized comparison
between zidovudine-lamivudine plus Nevirapine and zidovudine-lamivudine plus Abacavir. J Infect Dis. 2010;201(1):106–113.
6
Ahoua L, Guenther G, Pinoges L, Anguzu P, Chaix ML, Le Tiec C et al. Risk factors for virological failure and subtherapeutic antiretroviral drug concentrations in HIV-positive adults treated
in rural northwestern Uganda. BMC Infectious Diseases. 2009; 9:81.
7
Ferradini L, Jeannin A, Pinoges L, Izopet J, Odhiambo D, Mankhambo L et al. Scaling up of highly active antiretroviral therapy in a rural district of Malawi: an effectiveness assessment.
Lancet. 2006;367(9519):1335–1342.
8
Garrido C, Zahonero N, Fernandes D, Serrano D, Silva AR, Ferraria N et al. Subtype variability, virological response and drug resistance assessed on dried blood spots collected from HIV
patients on antiretroviral therapy in Angola. J Antimicrob Chemother. 2008;61(3):694–698.
9
Kouanfack C, Montavon C, Laurent C, Aghokeng A, Kenfack A, Bourgeois A et al. Low levels of antiretroviral-resistant HIV infection in a routine clinic in Cameroon that uses the
World Health Organization (WHO) public health approach to monitor antiretroviral treatment and adequacy with the WHO recommendation for second-line treatment. Clin Infect Dis.
2009;48(9):1318–1322
10
Ramadhani HO, Thielman NM, Landman KZ, Ndosi EM, Gao F, Kirchherr JL et al. Predictors of incomplete adherence, virologic failure, and antiviral drug resistance among HIV-infected
adults receiving antiretroviral therapy in Tanzania. Clin Infect Dis. 2007;45(11):1492–1498.
11
WHO HIV drug resistance report 2012. Geneva: World Health Organization; 2012. Available at: http://www.who.int/hiv/pub/drugresistance/report2012/en/.
12
van Zyl GU, van der Merwe L, Claassen M, Zeier M, Preiser W. Antiretroviral resistance patterns and factors associated with resistance in adult patients failing NNRTI-based regimens in the
Western Cape, South Africa. J Med Virol. 2011;83(10):1764–9.
13
Cozzi-Lepri A, Paredes, Phillips AN, Clotet B, Kjaer J, Von Wyl V et al. The rate of accumulation of nonnucleoside reverse transcriptase inhibitor (NNRTI) resistance in patients kept on a
virologically failing regimen containing an NNRTI. HIV Med. 2012;13(1):62–72.
14
Gupta R, Pillay D, Ranopa M et al. Rapid accumulation of thymidine-analog mutations and virologic implications in the absence of viral load monitoring. 2011. 18th Conference on
Retroviruses and Opportunistic Infections. Boston, Massachusetts. Abstract 618.
15
Hoffmann CJ, Charalambous S, Sim J, Ledwaba J, Schwikkard G, Chaisson RE et al. Viremia, resuppression, and time to resistance in human immunodeficiency virus (HIV) subtype C during
first-line antiretroviral therapy in South Africa. Clin Infect Dis. 2009;49(12):1928–35.
16
Consolidated guidelines on the use of antiretroviral drugs for treating and preventing HIV infection Recommendations for a public health approach - Second edition; Geneva: World Health
Organization; 2016. Available at: http://www.who.int/hiv/pub/arv/arv-2016/en.13
Global report on early warning indicators of HIV drug resistance: technical report. July 2016
STATISTICAL METHODS
Data on completed EWI monitoring rounds were reported to WHO by 59 countries, primarily in the form of detailed clinic-level
results, including a numerator and denominator for each EWI assessed. Fifteen countries reported aggregated data, in the
form of the number of clinics meeting each EWI target out of the total number of clinics monitored.1 As data were reported at
the clinic level, disaggregation by age and gender was not feasible.
The primary analysis includes data from 55 countries providing detailed clinic-level results. National prevalence estimates
were generated as the sum of the clinic numerators divided by the sum of the clinic denominators in a given round for a
given EWI. Regional and global prevalence statistics were constructed in a similar fashion. To enhance the data set to allow
for deeper investigations, data on countries were gathered from multiple sources including Global AIDS Response Progress
Reporting, country HIVDR reports submitted to WHO, and WHO/UNAIDS global reports for the years of EWI monitoring.
Variables assessed included the total number of ART clinics in the country, total number of people on ART, total number of
people living with HIV, and country income classification. 2 Analyses did not consider funding from bilateral and multilateral
agencies used to support ART scale-up. Country income classification was considered a proxy for health infrastructure
and does not account for external support provided to HIV programmes. Additional detail about the statistical analyses is
available in the Statistical methods section of the Annex.
This report has limitations. With very few exceptions, data reported by countries were not derived using representative clinic
selection; therefore, country-specific prevalence estimates reflect the aggregated prevalence of a given indicator derived from
purposefully sampled clinics in a given round; thus limiting the generalizability beyond the clinics reporting. Additionally,
not all countries implemented EWI monitoring or reported results. Caution is therefore warranted when interpreting global,
regional and national estimates and trends. To mitigate this effect, time trends are analysed using a model that prioritizes
data collected from repeated rounds within countries, limiting the impact of countries reporting only a single round of data.
1
Some countries reported aggregate-level data for some rounds and clinic-level data for other rounds in different cohort years.
2
The World Bank. What is the World Bank Atlas method? Available at: https://datahelpdesk.worldbank.org/knowledgebase/articles/378832-what-is-the-world-bank-atlas-method.14
Global report on early warning indicators of HIV drug resistance: technical report. July 2016
COVERAGE OF EWI MONITORING
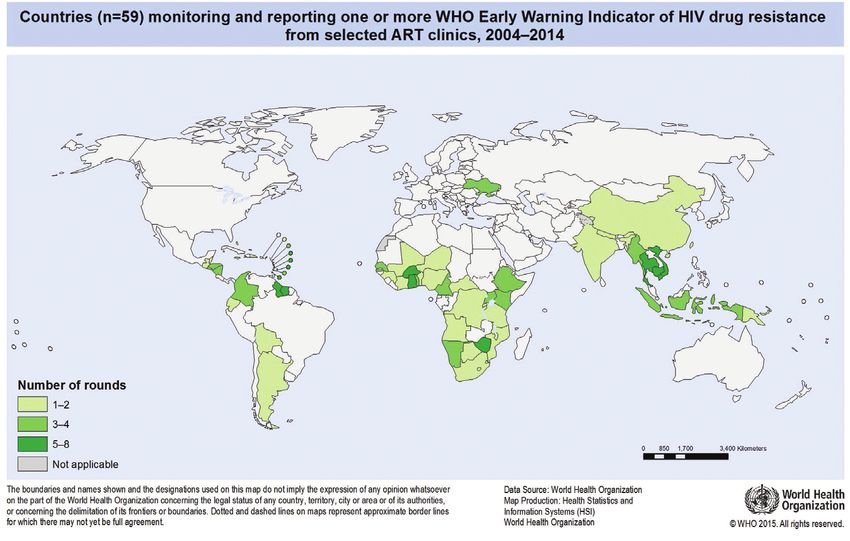
From a total of 165 rounds between 2004 and 2014, 59 countries reported EWI data to WHO (see Fig. 1).
Fig. 1. Countries (n=59) monitoring and reporting one or more EWI of HIVDR from selected ART clinics,
2004–2014
Fifteen countries reported aggregate-level data from 19 rounds. Detailed clinic-level data from 146 rounds of EWI monitoring
were reported from 7569 clinics1 in 55 countries. All analyses presented in this report use the detailed clinic-level data
reported from the 55 countries, with the exception of regional-level aggregate data presented in the section Aggregate EWI
results by region (page 35).
Amongst the 55 countries reporting clinic-level data, at the time of their most recent EWI monitoring round, 19 (35%) were
classified as low-income countries; 21 (38%) as lower-middle-income; 13 (24%) as upper-middle-income; and 2 (4%) as
upper-income. The majority of low-income countries (89%) reporting EWIs are located in Africa. Among upper-middle- and
high-income countries, 80% are from the Americas.
When reporting implementation, EWI rounds are reported by “cohort year”. A cohort year is defined as the year from which the
majority of data contributing to an EWI reporting round were originally entered into patient medical or pharmacy records. Fig. 2
shows the total number of rounds reporting clinic-level EWI data by cohort year and by region for the period 2004–2014.
In 2004, only one country in the Americas monitored one or more EWI. By 2007, 31 countries from seven regions were
moitoring EWIs in 32 unique rounds. A steady decline in EWI monitoring occurred between 2008 and 2014, with 30 countries
reporting in 2008 and only two countries (in South-East Asia and the Western Pacific) reporting in 2014.
1
Clinics may be counted more than once if rounds of EWI monitoring are repeated at the same clinic over time.15
Global report on early warning indicators of HIV drug resistance: technical report. July 2016
Fig. 2. Number of rounds reported with at least one EWI by region and year, 2004–2014
A cohort year is defined as the year from which the majority of data contributing to an EWI reporting round were originally entered into patients’ medical or pharmacy records.
In total, between 2004 and 2014, detailed clinic-level data were reported from 7569 clinics.1 The global decline in reporting
of clinic-level EWIs observed after 2011 is likely multifactorial, and may be partly related to a decrease in funding for EWI
specific monitoring and partly due to transitioning of these indicators into national M&E systems. The observed decline
in EWI reporting is addressed in greater detail in the section Improving monitoring and response for EWIs of HIVDR (page
43). Ongoing reporting of EWIs from South-East Asia was driven primarily by Thailand, which exemplifies the integration of
routine EWI monitoring into a country’s electronic medical record-keeping system.
Considerable variation in the number and proportion of clinics reporting EWIs within a county was observed. This variation
likely reflects ART programme decisions about how to pilot and scale up EWI reporting. It may also, to some extent, reflect
robustness of clinic-level record keeping.
The proportion of clinics within a country participating in EWI monitoring varied by region. Median participation was 30.5%
in the Americas; 25.8% in Western Africa; 9.2% in Central Africa; 11.6% in Eastern Africa; 24.6% in Southern Africa; 19.7%
in South-East Asia; and 11.0% in the Western Pacific. In general, small island nations in the Americas had very high levels of
participation due to the small number of clinics. With the exception of Thailand, where up to 98.3% (2010–2011) of clinics
reported, and Niger and Ghana, where up to 91.7% (2007) and 89.5% (2009–2010) of clinics reported respectively, the
proportion of clinics monitoring EWIs was low (median participation of 24%).
While some countries monitored EWIs at few ART clinics, other countries conducted larger rounds with many clinics
monitored. These countries included the Democratic Republic of the Congo (DRC), Ghana, South Africa, Thailand, Uganda
and Viet Nam. Table 1A in the Annex summarizes the top 15 EWI rounds with the most clinics included. Of the clinics that
reported to WHO in this data set, 75.2% (5742) came from the six unique countries listed in this table.
As the proportion of clinics within a country reporting EWIs varied, so too did the frequency with which individual EWIs were
monitored in each round. Over 90% of rounds reported on prescribing practices and retention; 72% of rounds monitored
LTFU at 12 months; 42% and 30% reported on-time pill pick-up and on-time appointment keeping, respectively; 44% of
rounds monitored drug stock outs; and only 19% of rounds monitored viral load suppression at 12 months. The frequency
with which countries and clinics monitored particular indicators may have been due to national ART programme preference
regarding which indicators to prioritize, and was likely influenced by ease of data abstraction from existing clinic and
pharmacy records. The low uptake of viral load suppression as an indicator reflects the limited availability of routine viral
load monitoring in most countries during the reporting period.
1
Clinics may not be unique: they may be counted more than once if EWI rounds were repeated at the same clinic over time.You can also read