Real-Time Rideshare Matching Problem - highlights
←
→
Page content transcription
If your browser does not render page correctly, please read the page content below
Real-Time Rideshare Matching Problem

                                        FINAL REPORT

                                         UMD-2009-05
                                        DTRT07-G-0003

                                           Prepared for

                               U.S. Department of Transportation

                                                By

                         Keivan Ghoseiri, Ali Haghani, Masoud Hamedi

                                   University of Maryland
                      Department of Civil and Environmental Engineering
                                  College Park, MD 20742

                                          January 2011

This work was sponsored by the Pennsylvania Department of Transportation and the U.S.
Department of Transportation, Federal Highway Administration. The contents of this report
reflect the views of the authors, who are responsible for the facts and the accuracy of the data
presented herein. The contents do not necessarily reflect the official views or policies of either
the Federal Highway Administration, U.S. Department of Transportation, or the State of
Maryland at the time of publication. This report does not constitute a standard, specification, or
regulation.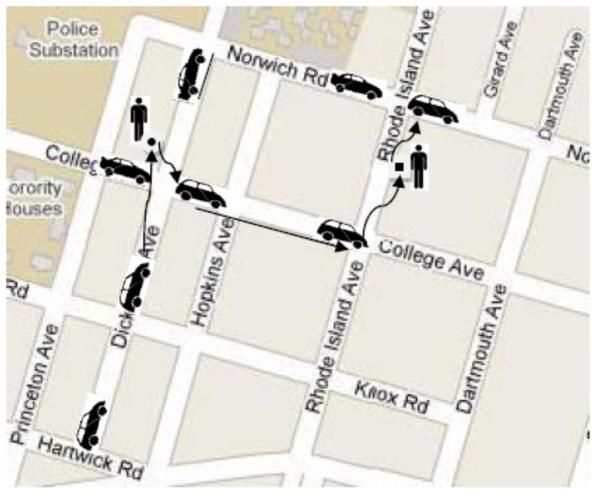
Technical Report Documentation Page

 1. Report No.                               2. Government Accession No.          3. Recipient’s Catalog No.
 UMD-2009-05

 4. Title and Subtitle                                                            5. Report Date

 Real-time Rideshare Matching Problem                                             January 2011

                                                                                  6. Performing Organization Code

 7. Author(s) Keivan Ghoseiri, Ali Haghani, Masoud Hamedi                         8. Performing Organization Report No.

 9. Performing Organization Name and Address                                      10. Work Unit No. (TRAIS)

 University of Maryland
 Department of Civil and Environmental Engineering                                11. Contract or Grant No.
 College Park, MD 20742
                                                                                  DTRT07-G-0003

 12. Sponsoring Agency Name and Address                                           13. Type of Report and Period Covered

 U.S. Department of Transportation                                                Final Report
 Research and Innovative Technology Administration
 UTC Program, RDT-30
 1200 New Jersey Ave., SE                                                         14. Sponsoring Agency Code
 Washington, DC 20590

 15. Supplementary Notes

 16. Abstract
  This research project presented a Dynamic Rideshare Matching Optimization model that is aimed at identifying suitable
 matches between passengers requesting rideshare services with appropriate drivers available to carpool for credits and HOV
 lane privileges. DRMO receives passengers and drivers information and preferences continuously over time and assigns
 passengers to drivers with respect to proximity in time and space and compatibility of characteristics and preferences among
 the passengers, drivers and passengers onboard. DRMOP maximizes total number of assignments in a given planning
 horizon and secures that all the constraint for vehicle occupancy, waiting time to pickup, number of connections, detour
 distance for vehicles and relocation distance for passenger are satisfied. The ridesharing preferences and characteristic
 considered in the model are: age, gender, smoke, and pet restrictions as well as the maximum number of people sharing a
 ride. To better understand the model, a numerical example with compromise solutions were presented and discussed. The
 authors currently are working on developing solution algorithms for solving the optimization model proposed in this paper for
 large scale real-world problems.

 17. Key Words                                                                    18. Distribution Statement
  Ride share, HOV, Dynamic Rideshare Matching Optimization                        No restrictions. This document is available
                                                                                  from the National Technical Information
                                                                                  Service, Springfield, VA 22161
 19. Security Classif. (of this report)   20. Security Classif. (of this page)     21. No. of Pages        22. Price

 Unclassified                             Unclassified

Form DOT F 1700.7                               (8-72)                        Reproduction of completed page authorized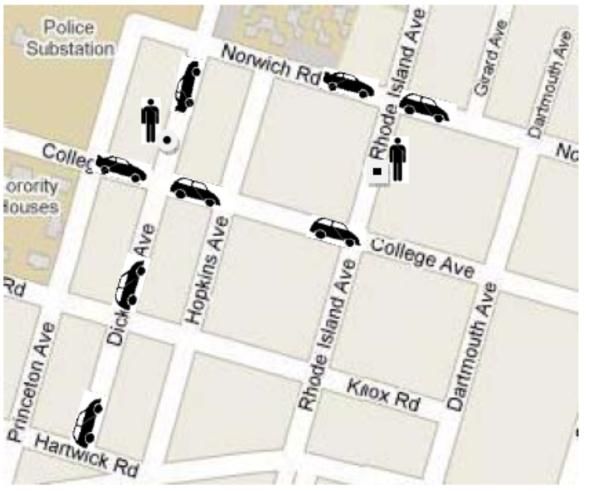
Table of Contents
Introduction .................................................................................................................................................. 6
   Why ridesharing? ...................................................................................................................................... 6
   Why Real-Time ridesharing? ................................................................................................................... 10
   Definition and Features of Real-Time Ridesharing ................................................................................. 12
   Optimization Models and Dynamic Ride-Sharing ................................................................................... 14
State-of-the-Art........................................................................................................................................... 15
   Bellevue Smart Traveler .......................................................................................................................... 15
   Los Angeles Smart Traveler Field Operational Test ................................................................................ 16
   Sacramento Rideshare Matching Field Operational Test ....................................................................... 18
   Coachella Valley TransAction Network ................................................................................................... 19
   Seattle Smart Traveler ............................................................................................................................ 19
   Missoula Ravalli Transportation Management Association ................................................................... 21
   King County Metro's Regional Ridematch System .................................................................................. 22
   Redmond Transportation Management Association’s Ridematch system ............................................ 22
   Minerva Dynamic Ridesharing System.................................................................................................... 23
   Online Ridematching and Traveler Information Services ....................................................................... 25
   Dynamic Ridesharing in the era of Internet Enabling Technologies ....................................................... 25
   Summary of Reviews ............................................................................................................................... 32
Problem Definition ...................................................................................................................................... 33
Problem Formulation .................................................................................................................................. 35
   Proximity in time and space .................................................................................................................... 35
   Origin-Destination route related constraints.......................................................................................... 37
   Continuity constraints ............................................................................................................................. 37
   Ridesharing preferences constraints ...................................................................................................... 38
       Age preferences matching formulation .............................................................................................. 38
       Gender preferences matching formulation ........................................................................................ 42
       Smoking preferences matching formulation ...................................................................................... 44
       Pet restrictions preferences matching formulation ........................................................................... 47
       Maximum occupancy preferences constraints ................................................................................... 50
   Formulation of the objective function .................................................................................................... 51
       Objective Function .............................................................................................................................. 51

                                                                               2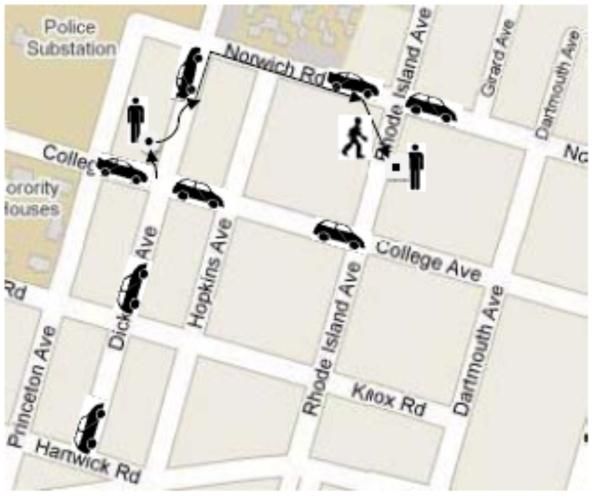
Inputs of the Model ............................................................................................................................ 52
       Outputs of the Model ......................................................................................................................... 56
Numerical Example ..................................................................................................................................... 60
Conclusion ................................................................................................................................................... 65
References .................................................................................................................................................. 67

                                                                               3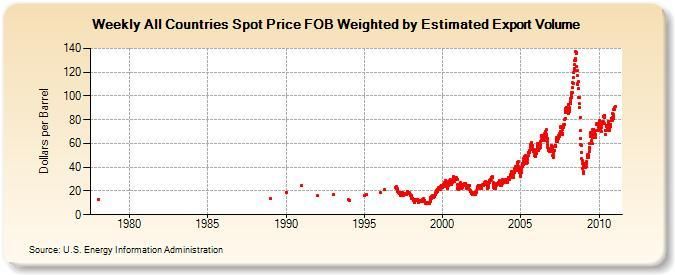
List of Tables:
Table 1: Vehicle Occupancy per Vehicle Mile by Daily Trip Purpose
Table 2: Major Findings for 2009 – The Important Numbers for the 439 U.S. Urban Areas
Table 3: Mode share Trends, 2000-2004
Table 4: Personal information and ridesharing preferences
Table 5: Age attitude and preferences classification
Table 6: Gender attitude and preferences classification
Table 7: Pet attitude and preferences classification

                                                 4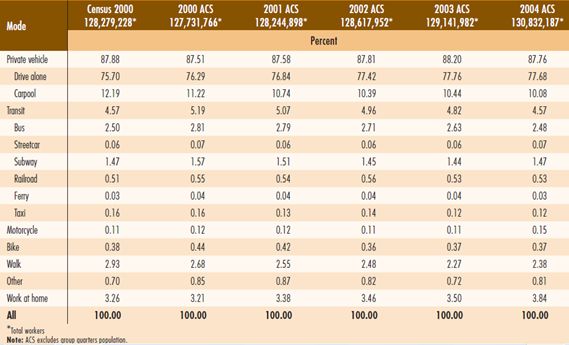
List of Figures:
Figure 1: Weekly all countries oil price FOB weighted
Figure 2. 2003 Transportation Greenhouse Gas Emissions, by Source
Figure 3: Age attitude and preferences classification
Figure 4: Age matching relations
Figure 5: Gender attitude and preferences classification
Figure 6: Gender matching relations
Figure 7: Smoking attitude and preferences classification
Figure 8: Smoking matching relations
Figure 9: Pet attitude and preferences classification
Figure 10: Pet matching relations
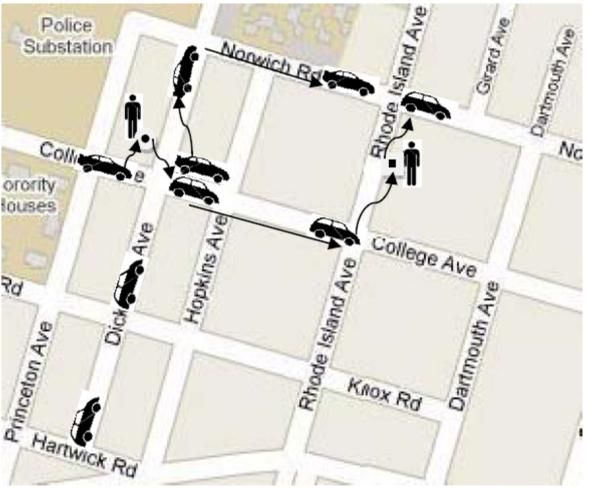
Figure 11: The map for the numerical example
Figure 12: Rideshare preference matching relationships
Figure 13: Proximity in time and space relationships for pick up and drop off the passenger
Figure 14: Proximity in time and space relationships for pick up and drop off the passenger
Figure 15: Compromise solutions.
5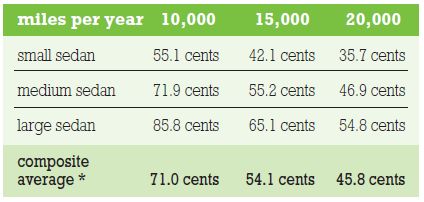
Introduction

Why ridesharing?

The price of oil again began rising in February 2009 and it reached the two-year record level of
USD 91.15 a barrel in January 2011 (Figure 1). The analysts predict that oil prices will continue
to rise and consumers‘ budgets will be more under pressure. The world economy is running fast
out of the cheap oil that has powered the economy development since the 1950s [Londarev and
Baláž, 2005]. The problem related to traffic congestion and environmental pollutions in big
cities are increasing [Slack et al., 2006].

                       Figure 1: Weekly all countries oil price FOB weighted
                          Source: U.S. Energy Information Administration

In the face of increasing the price of transportation fuel cost and worsening the effects of traffic
congestion and environmental pollutions, wise usage of personal automobiles are gaining more
attraction. Rideshare is a solution for car travel reduction aiming to bring together travelers with
similar itineraries and time schedules. Ridesharing has generated much interest in recent years
with media coverage (the Wall Street Journal [Saranow, 2006], Time [Sayre, 2006] Newsweek
[Levy, 2007], Business Week [Walters, 2007], ABC News [Bell, 2007], The NY Times
[Wiedenkeller, 2008], USA Todays [Jesdanun, 2008], and NBC4 News [McPeek, 2011], among
many others.)

Mean occupancy rates of personal vehicle trips (the average number of travelers per vehicle trip)
in the united states is 1.6 persons per vehicle mile (Table 1) ranging from 1.14 for work-related

                                                 6
trips to 2.05 for social or recreational trips and weekday trips have a weighted (by miles travelled
in trip) occupancy of 1.5 compared to 2 people per vehicle mile on weekend trips [BTS, 2001].
Table 1: Vehicle Occupancy per Vehicle Mile by Daily Trip Purpose
The large travel demand for personal car transportation together with low occupancies leads to
traffic congestion that is an increasingly important issue in many urban areas with rapid
population and economic growth. Congestion has gotten worse in regions of all sizes in the
United States. In 2007, congestion caused urban Americans to travel 4.2 billion hours more and
to purchase an extra 2.8 billion gallons of fuel for a congestion cost of $87.2 billion which is an
increase of more than 50% over the previous decade (Table 2). This was a decrease of 40 million
hours and a decrease of 40 million gallons, but an increase of over $100 million from 2006 due
to an increase in the cost of fuel and truck delay [UMR 2009]. An effective ridesharing system
that encourages the travelers to share their personal car could be an effective countermeasure
against traffic congestion with reducing personal car travel demand.
In the United States more than 87% of commuters travel in private vehicles which accounts for a
daily sum of 166 million miles and single occupancy vehicles make up a big portion of 77% of
the travels (Table 3), resulting in inefficient use of the transportation infrastructure [CIAIII,
2006] and giving a big opportunity for developing a rideshare system.
7Table 2: Major Findings for 2009 – The Important Numbers for the 439 U.S. Urban Areas
Travel Time Index (TTI) – The ratio of travel time in the peak period to travel time at free-flow conditions. A Travel
Time Index of 1.35 indicates a 20-minute free-flow trip takes 27 minutes in the peak.
Delay per Peak Traveler – The extra time spent traveling at congested speeds rather than free-flow speeds divided by the number
of persons making a trip during the peak period.
Wasted Fuel – Extra fuel consumed during congested travel.
Vehicle-miles – Total of all vehicle travel (10 vehicles traveling 9 miles is 90 vehicle-miles).
Expansion Needed – Either lane-miles or annual riders to keep pace with travel growth (and maintain congestion).
Source: 2009 Urban Mobility Report, Texas Transportation Institute, the Texas A&M University
System, July 2009
Single occupancy vehicles commute a daily sum of 127 million miles [CIAIII, 2006]. Composite
national average driving cost per mile is 54.1 cents including average fuel, routine maintenance,
tires, insurance, license and registration, loan finance charges and depreciation costs [AAA
2008] (Table 4 represents more detailed breakdown by miles driven and vehicle type.).
Therefore, a successful ridesharing program that increases the occupancy of vehicles may make a
significant saving on driving costs of the roadway system.
8Table 3: Mode share Trends, 2000-2004
Source: Commuting in America III: The Third National Report on Commuting Patterns and
Trends, 2006, Transportation Research Board, 2006
Table 4: Driving cost by miles driven and vehicle type
Source: 2008 Your Driving Costs, American Automobile Association
Private automobile is also the most pollutant transportation mode [Hensher, 2008].
Transportation is also a significant source of greenhouse gas (GHG) emissions. In 2003, the
transportation sector accounted for about 27 percent of total U.S. GHG emissions and it was
predicted to continue increasing rapidly, reflecting the anticipated impact of factors such as
economic growth, increased movement of freight by trucks and aircraft, and continued growth in
personal travel. About 81 percent of transportation GHG emissions in the United States came
9from ―on-road‖ vehicles. Personal transport accounted for 62 percent of total transportation
emissions (35 percent for passenger cars and 27 percent for light-duty trucks including SUVs,
minivans and pickup trucks and less than 1 percent for motorcycles) and heavy-duty vehicles
including trucks and buses, were responsible for 19 percent of total transportation emissions.
(Figure 2) [Transportation GHG Emissions Report, 2006].
Figure 2. 2003 Transportation Greenhouse Gas Emissions, by Source
Source: U.S. Environmental Protection Agency, 2005. Inventory of U.S. Greenhouse Gas
Emissions and Sinks: 1990–2003. Washington, DC, Table 2-9.
Ridesharing with increasing the rate of occupancy per vehicle represents an opportunity to
decrease the cost and undesirable impacts of traffic congestion, fuel consumption, and pollution.
Why Real-Time ridesharing?
Although several organized ridesharing projects have been attempted but successful ridesharing
systems are still in short supply. Certainly, in order to be widely adopted, ride-sharing must be
easy, safe, flexible, efficient and economical and must be able to compete with one of the
greatest advantages of private car usage, i.e., immediate access to door-to-door transportation.
[Agatz et al., 2010].
10Dynamic ridesharing (also called real-time ridesharing) is a form of carpooling system that
provides rides for single, one-way trips. Dynamic ridesharing differs from regular carpooling and
vanpooling in that ridesharing is arranged on a per trip basis rather than for trips made on a
regular basis [Casey et al., 2000].
Traditional carpooling, however, is too limiting to accommodate the unconventional schedules of
today‘s rideshare demand, where many commuters will only respond to flexible commuting
options [Levofsky et al., 2001].
Some of the transportation agencies have been working on innovative technology to provide this
flexibility. The focus has been on the concept of ―smart travelers‖ riding in ―smart vehicles‖.
―Smart‖, in the most advanced sense, means that both the people and vehicles are continuously
connected via wireless communications and the ―smart traveler‖ is a person who has access to
real-time and reliable information in order to make travel decisions [Schweiger et al., 1994].
In dynamic ridesharing system, individuals submit requests for a ride to an operations center or
central database, either by telephone, e-mail, or direct input to a system residing on the Internet.
The database of trips that have been offered by registered drivers is searched by the ride
matching software to see if any match the approximate time and destination of the trip request. A
request may be made for any destination or time of day, but matches are more likely to be found
for travel in peak periods and in principal commute directions. Requests for ride matches can be
made well in advance or close to the time when the ride is desired. A return trip would be a
separate trip request and could be matched with a different driver. The ITS element in dynamic
ridesharing is the automation of the trip request matching and arrangement process, which allows
trips to be arranged on short notice. This can be done by either the traveler using the Internet or
by a customer service representative at a transit agency call center. The technology involved is
rideshare software and possibly the Internet [Casey et al., 2000].
Dynamic ridesharing benefits both drivers and passengers. Passengers benefit by having an
alternative when their usual mode is unavailable, and by possibly eliminating the need for an
additional car for occasional use. Dynamic ridesharing is particularly valuable when public
transportation is not an option. Drivers benefit by having someone to share the cost of the trip
11(although this may not always happen) or to gain enough passengers to qualify for high
occupancy vehicle (HOV) lanes and reduce the travel time of their trip [Casey et al., 2000].
Dynamic ridesharing could combat the increase in the numbers of vehicle trips, levels of Vehicle
Miles Traveled, and amounts of congestion on the road. According to the United States
Department of Transportation, 17% of the growth of VMT in the United States between 1983
and 1990 was caused by a decrease in vehicle occupancy – accounting for far more than the 13%
increase due to population growth [Surface Transportation Policy Project. 1999]. But addressing
this growth through traditional means is difficult because only 11% of the United States urban
population lives within one-quarter mile of a transit stop with non-rush hour frequency of 15
minutes or less [National Science and Technology Council, 1999]. Dynamic ridesharing, in
contrast, has the potential to reduce each of these factors; 35% of participants in a Bellevue
Smart Traveler project focus group [Haselkorn et al. 2005] and 50% of respondents to a Hawaii
Department of Transportation study [Flannelly and McLeod, 2000] expressed a willingness to
use such a service if it were available. The failure of the experiment in the large (open to the
general public) dial-a-ride, door-to-door transit service in San Jose, CA, showed the great
potential that door to door services have in attracting users. The transit system abolished less
than six months after it opened because it was more successful in luring riders than its originators
expected it to be [Lindsey 1975]. An expensive U.S. average $13 per-ride cost, however,
prohibits conventional dial-a-ride service from becoming a viable option for a large number of
trips [John A. Volpe National Transportation Systems Center (U.S.), 2000].
Recent technological advances in internet based communication devices such as PDAs, smart
phones, and wireless laptops could be key enablers to increase popularity of Dynamic
ridesharing. According to comScore report, 234 million Americans subscribed to mobile phone
plans in January 2010. Of these, 42.7 million owned Internet-accessible smart phones, which
represented an 18 percent increase over the three months ended in October.
Definition and Features of Real-Time Ridesharing
Dynamic ridesharing also known as dynamic carpooling, real-time ridesharing, ad-hoc
ridesharing, and instant ridesharing has been defined differently by different scholars. An early
effort to increase the industry‘s knowledge and adoption of successful applications of advanced
12technologies defined dynamic car-pooling as ―a mode of transportation that is ready when you
are. They are multipurpose and can be arranged either in real-time or close to it (near term).
Participants pre-qualify and are put into a database. Upon receipt of a trip enquiry, the database
is searched for others who are traveling in the same direction at the same time. Participants can
not only use this database to arrange for carpools to and from work, but also to a shopping
center, medical facility or any other trip generator‖ [Schweiger et al., 19994] . One of the other
first definitions proposed was developed in preparation for a field operational test in Sacramento,
CA in 1994 that defined dynamic ridesharing as ―a one-time rideshare match obtained for a one-
way trip either the same day or the evening before‖ [Kowshik et al., 1996]. Another trial in 1997
which was aimed to test the concept of dynamic rideshare matching services using Internet and
e-mail at the University of Washington in Seattle defined dynamic ridesharing as ―two or more
people sharing a single trip, without regard to previous arrangements or history among the
individuals involved. In comparison to traditional ridematching services, which focus on
commuters traveling to and from the same origins and destinations on fixed schedules, a
dynamic ridesharing system must be able to match random trip requests at any time. Thus, the
system must be able to match potential carpoolers quickly to respond to same-day trip requests,
as well as the more traditional commute trips‖ [Dailey et al., 1997].
‗dynamicridesharing.org‘ defines dynamic ridesharing as ―A system that facilitates the ability of
drivers and passengers to make one-time ride matches close to their departure time, with
sufficient convenience and flexibility to be used on a daily basis‖ [Kirshner, 2008].
A recent definition proposed for dynamic ridesharing described it as ―an automated system that
facilitates drivers and riders to share one-time trips close to their desired departure times‖ and
characterized it by the following features: Dynamic, independent private entities, cost sharing,
non-recurring trips, prearranged, and automated matching [Agatz, et al., 2010].
Another recent work suggests real-time ridesharing as ―A single or recurring rideshare trip with
no fixed schedule, organized on a one-time basis, with matching of participants occurring as little
as a few minutes before departure or as far in advance as the evening before a trip is scheduled to
take place‖ [Amey, 2010].
13All the definitions emphasize that dynamic ridesharing is occasional in their nature and has no
fixed amount of advanced notice required for establishing the shared trip. For the purposes of the
study presented in this dissertation proposal, real-time ridesharing is defined as:
―A non-recurring multipurpose rideshare trip which is prearranged on a per trip basis on a short-
notice to establish shared trips close to the desired departure times and locations of the
participants to gain HOV lanes privileges or share the cost of the trip. ‖
Optimization Models and Dynamic Ride-Sharing
A viability analysis for dynamic rideshare system that examined both theoretical concepts and
actual implementation of a dynamic rideshare system in Los Angeles [Hall and Qureshi, 1997]
concluded that in theory dynamic ridesharing is a viable concept and a user should be successful
to find a ride-match but in practice the story is different and one at best one can might expect a
one in five chance of someone offering a ride. In another study, A GIS approach analysis to
identify common clusters of commuters in University of Toronto [Sarraino et al., 2008] found
that during morning commute hours (7:00–10:30am), 1,461 of 3,030 drive trips (48%) were
suitable for ridesharing based on residential proximity and similar residential departure times. A
similar study in Massachusetts Institute of Technology suggested that between 50% and 77% of
the commuting population could rideshare on a maximum-effort day that is significantly higher
than the 8% of the MIT community that currently choose to rideshare [Amey, 2011].
A simulation study in Metro Atlanta showed that the use of sophisticated optimization methods
substantially increases the likelihood to find the ride-matches and also that dynamic ridesharing
has potential for success in large U.S. metropolitan areas [Agatz et al., 2010].
While technological advances have greatly eased the communication and reputation systems and
social network tools have tackled the fear of sharing a ride with strangers, the development of
optimization algorithms for matching the participant in real-time and ultimately increasing the
rate of participation in the ridesharing system has largely ignored by transportation research
community. This research is the first of its kind to develop an optimization algorithm for real-
time rideshare matching problem.
14State-of-the-Art
The aim of the following is to review state of the art of dynamic ridesharing projects and
researches.
Bellevue Smart Traveler
The goal of the Bellevue Smart Traveler (BST) project was to design and test a traveler
information center (TIC) prototype in downtown Bellevue, Washington, east of Seattle that is an
area with concentrated employment facilities and a high percentage of single occupancy vehicle
(SOV) commuters. The idea was to provide the participant with convenient off-site access to the
TIC‘s information including up-to-the-minute traffic congestion information, transit information,
and carpool/vanpoo1 ride-matches using a telephone, and/or a hand-held alpha-numeric pager.
The user population was employees of downtown Bellevue companies taking part in the BST
demonstration project. Registered users had access to pagers in addition to the phone-based
system and would had been tracked to determine how they used the system and whether or not
the system were effective in encouraging their use of HOV transportation options. The
registration application acquired information such as: full name, gender, employer, Washington
state driver‘s license number, work address, home address, work phone number, home phone
number (public or private), work days, work hours, preferred arrival time to work, preferred
departure time from work, schedule flexibility (in terms of time), preferred pickup points (three
of them, selected from a list, in ranked order), smoking preference, gender preference (exclusive
and nonexclusive), willingness to be a driver (how often, how many seats available), willingness
to be a rider (how often). For ridesharing purposes, registered users were divided into ―ride
groups‖. All registered users were working in a four square block area of downtown Bellevue but
lived throughout the Puget Sound area. Hence, ride groups were based on where users lived so
that each ride group was consisting of users that commute to and from the same general areas to
increase the potential for successful dynamic ridematches; each ride group had enough users so
that a reasonable number of ride-matches were possible. However, each ride group was not so
large to prevent overflow of information for riders looking for rides. Ride groups covered a small
enough geographical area so that drivers and riders could meet and be dropped off at convenient
locations. The formation of ride groups was based on zip codes and preferred pick-up/drop-off
15points (as specified on the application). The TIC was tested and demonstrated over a five-month
period (from late November 1993 to late April 1994). During that time, 53 users were registered.
Of the registered users, 48 formed three ride groups: 23 from areas south of Bellevue, 10 from
areas east of Bellevue, and 15 from areas north of Bellevue. Members from the ride groups
offered 509 rides and only six ride-matches were logged. Results from the usage patterns and
various surveys that were conducted suggested that participants liked the idea of dynamic
ridesharing, the presentation of the information and the technology. However, for various
reasons they were either unable or unwilling to form ride matches. Some of the reasons were:
insufficient rideshare choices due to the limited size of rideshare groups, being uncomfortable
getting into someone else‘s car, limited time saving incentives due to lack of HOV lanes in the
Bellevue area, and technology limitations that reduced the effectiveness of pager delivery.
Another possible reason for failure of the project may have been the inconvenience of the
rideshare service. The system did not actually match the riders. When users received potential
matches from their ride groups, they were left to coordinate the trip.
The BST project conclusions suggested that rideshare group is a new social entity and more
work was needed to determine (1) how to encourage ride acceptance and (2) the dynamics of a
viable ride group. Incentives such as management support and encouragement could have played
a stronger role. Placing the BST TIC on the Internet would help people more easily obtain and
respond to rideshare information [Haselkorn et al., 1995].
Since participants were placed in location-based ride groups, trips were limited to work and
home, with time of the trip as the sole variable. For maximum benefits, dynamic ride matching
systems need to allow both location and time to vary to enable matching for work and non-work
trips [Dailey et al., 1997].
Los Angeles Smart Traveler Field Operational Test
The Los Angeles Smart Traveler Field Operational Test (FOT) was one of the largest and most
comprehensive Automated Rideshare Matching System (ARMS) experiments to date. The
purpose of the study was to evaluate the performance and effectiveness of the Advanced Traveler
Information System (ATIS). This project was implemented in Los Angeles as part of the new
technology demonstrations being carried out by the California Advanced Public Transportation
16Systems Group (CAPTS) at Caltrans District 7. It was designed as a field operational test of
three different media approaches for providing traveler information: fully automated telephone
systems; automated multi-media touch screen kiosks; and PC via modem. The information
included: transit routes, fares and services; traffic conditions on the freeways; and ride-matching
information for ridesharing on both frequent and one time occasions. Survey results indicated a
high degree of user satisfaction for the kiosks that provided a new medium for obtaining pre-trip
traveler information, yet the overall usage rate was low (an average of 25 transactions per day),
relative to the cost of providing the kiosk service. Low usage combined with high capital and
operating costs yielded a total cost per use of approximately $2.00 (over a five-year lifetime of
the kiosk). Kiosks placed in office locations had the lowest usage while kiosks placed in Union
Station in downtown Los Angeles and kiosks placed in shopping malls had the highest usage.
This finding suggests that the kiosks may be used more for non-work related trip information
when users have more time, such as for shopping trips or by tourists. Smart Traveler Automated
Ride-matching Service (ARMS) allowed users to use their touch tone phone to find rideshare
partners. It was designed to provide individuals with lists of potential compatible rideshare
partners for either regular carpooling or an occasional emergency ride home. As with the kiosks,
the service was available in both English and Spanish. For the purposes of finding either regular
rideshare partners or a once only ride, those using the system used the touch tone phone to enter
changes in preferred travel times. They received a computer generated list of people to contact
who live and work near them with similar schedules. The user could then choose to call some or
all of the people on the list, or record a message that Smart Traveler automatically delivers to
potential carpool partners, allowing them to call the individual back if they are interested in
sharing a ride. The ARMS was found to have very little usage (34 persons per week). From a
small telephone survey of ARMS users it was concluded that most users used the service to seek
regular ridesharing opportunities and not the featured one-time ride service. The researchers
concluded that there is not enough interest in ARMS to justify its cost of operation. The modem
service was found to have significant usage. In a period of 35 weeks a total of 83,155 uses were
recorded (on an average weekday there were circa 400 uses per day). These levels of use
indicated that there was indeed a demand for the service. This component of the ATIS system
did not have the multi-modal component at the time of evaluation and instead only reported
17Caltrans congestion information. Usage was found to be higher in the mornings and evenings,
consistent with commuter trip planning [Giulian et al., 1995].
Los Angeles Smart Traveler program operated only from July 1994 to September 1994 and it
was therefore limited to the approximately 68,000 people. The research conducted from October
1994 to March 1995 showed that an average of 34 people per week used the system. Users
calling a toll free number could select dynamic ridesharing from an options menu. An AutoText
interface allowed users to input and change their travel times and to search for new matches
based on the new times. Ride match lists were provided over the phone to the users who then had
the option of calling the potential matches or having a computer send a message. In order to use
ARMS, individuals had to be registered with Commuter Transportation Services. There is no
way to know how many matches where actually made because users were not required to report
them. The evaluation concluded that the market for ―one-day-only‖ rides was very limited
because of participants‘ concerns over safety [Golob and Giuliano, 1996].
Sacramento Rideshare Matching Field Operational Test
A real-time rideshare matching field operational test evaluation was conducted in Sacramento,
California which began in late 1994 and terminated in 1995 with the participation of the Federal
Transit Administration, Caltrans, PATH, Sacramento Rideshare, and U.C. Davis Institute of
Transportation Studies. The service was not automated, but operator-based. Users answered
questions over the telephone about origin and destination locations, purpose of trip, etc. Trip
matches were made by sorting from database orientation and destination zip codes, and then
prioritizing by the closeness of desired trip times. Three hundred and sixty people (from a
database of 5,000 who expressed interest in carpooling) registered as drivers willing to offer on-
demand rides. The rate of match was very low and from the ten requests made for dynamic
ridesharing, only one potential match was made, and it is not known if the match was secured.
The final report concluded there were several reasons for the poor performance of the program:
Poor marketing of the service and personal security concerns. As part of the system design, user
needs were assessed through a review of literature and focus group discussions. Six user needs
were identified: background screening; information security; matching and system reliability;
system access; flexibility; and, a compensation scheme. The user needed flexible ridesharing
18arrangements that would allow users with non-identical origins and destinations to be matched as
well as a reliable system that would be able to generate a large number of potential matches for
any given trip [Kowshik et al., 1996].
Coachella Valley TransAction Network
Commuter Transportation Services, Inc. (CTS) developed the Coachella Valley TransAction
Network (TAN) in 1994 as a pilot test for providing information on transit and ridesharing.
The project was similar to the Los Angeles Smart Traveler project, in that real-time traffic and
transit information and rideshare information were provided on over 700,000 registrants
throughout the Riverside area via four stand-alone commuter information kiosks. During the
seven-month test period, more than 21,510 people accessed the kiosk system. Approximately
one-third of them accessed information on ridesharing and only 256 printouts were rideshare
match lists. The project was expensive to implement and usage was low. CTS concluded that
kiosks were probably not the best medium for obtaining real-time rideshare information and
recommended it not be included in future models [Haselkorn et al., 1995].
Seattle Smart Traveler
Seattle Smart Traveler (SST) project was part of a larger Intelligent Transportation System Field
Operational Test conducted by the Washington State Department of Transportation, the
University of Washington, King County Metro, and five private sector partners from 1995 to
1997 that was designed to test the concept of automated dynamic rideshare matching using the
Internet and electronic mail at the University of Washington in Seattle [Dailey et al., 1999].
The SST project defined dynamic ridesharing as ―two or more people sharing a single trip,
without regard to previous arrangements or history among the individuals involved‖ and
addressed the differences between dynamic ridesharing with traditional ride-matching services,
which focus on commuters traveling to and from the same origins and destinations on fixed
schedules, as ―a dynamic ridesharing system must be able to match random trip requests at any
time‖ [Federal Transit Administration, 1996].
User group was limited to faculty, students, and staff from the University of Washington. The
SST was designed to respond to the request of three types of matches: regular commute trips,
additional regular trips, and occasional trips. A user entered the origin, destination, day of week,
19departure time, and arrival time for each trip type. The system then identified potential matches
using a search structure a search tree containing four levels of detail. To provide flexibility in the
matching of trips, a time range or window was used for both the requested departure and arrival
times. The SST automatically generated and sent an e-mail message with this information if the
user desired or the participant could call the potential matches [Federal Transit Administration,
1996].
The evaluation report found that faculty and staff made up 68% of users, with students
comprising the remaining 32%. Approximately 700 ride-matches were requested during the 15-
month test period, of those 150 potential matches generated, and At least 41 matches actually
made. It was possible that more ride matches were made, as since there was no requirement that
actual trips be reported [Casey et al., 2000].
SST suggested that the relationship between the number of users and the number of carpools
formed was quadratic, i.e., rate of carpooling would increase with the number of users. It also
suggested that carpooling has the potential to have a larger effect on traffic demand management
(TDM) if large groups of people participate. Further, SST suggested that a web-based ridematch
system can be as effective as traditional ridematching. SST suggested the following quantitative
relationships between numbers of users, matches, and carpools: SST estimated the number
matches expected (Tm) given U users is:
( )
(1)
And, the actual number of carpools (Cp) is:
( )
(2)
Where and are constant coefficients, and is the probability for a pair of trips matching
constant across the population of rideshare trips assuming that: (1) the probability of trips
matching is approximately constant across the population of trips, (2) the relationship between
20the number of users and the number of trips is linear, and (3) the relationship between matches
and actual carpools is linear [Dailey et al., 1999].
The SST project identified some issues that may have limited the use of the system. First, the
project was implemented before the real boom in Internet use. Second, the developing
technology for the dynamic ride-matching capabilities was somewhat cumbersome. Third, the
SST had been viewed by some targeted users as a temporary endeavor. Fourth, there were no
sufficient incentives to encourage greater ridesharing. Finally, there were safety concerns
regarding sharing rides with strangers. Although the test ended in June 1997, the SST continues
to operate for a few years later even though no staff was assigned to the project. Without staff
support, the database was not updated or purged of former users [Turnbull, 1999].
The SST system is no longer operational; however, an offline demonstration of the project can be
viewed by following the SST link: http://sst.its.washington.edu/sst/
Missoula Ravalli Transportation Management Association
The Missoula Ravalli Transportation Management Association (MRTMA) operated a
ridesharing program in Missoula., Montana using GeoMatch information system. for matching
new applicants with existing carpools [Casey, 2000].
GeoMatch is a geographic based system that matches people with carpools, vanpools, and
provides transit information. The program runs on personal computers using the Microsoft
Access database software.
Rideshare requests were provided by telephone and generating a matchlist usually took about
four minutes. The rideshare program was in operation since 1997 and had over 300 names in the
carpool database by September 2000. During that time period, It forms 30 regular carpools and
four vanpools and received three to five rideshare request calls per week, one to two of those
were one-time rides [Casey, 2000].
21King County Metro's Regional Ridematch System
King County is located in Washington State, comprises 2,134 mi2 with more than 1.8 million
people. Major cities include Seattle and Bellevue, with numerous smaller suburban cities
throughout the county. Washington State‘ s Commute Trip Reduction (CTR) Act that was passed
in 1991 and reauthorized in 2006, as a part of the Washington Clean Air Act, required major
employers to reduce drive-alone commuting by their employees and provides a regulatory
framework for measuring employer success. Since passage of the CTR Act, King County Metro
Transit has worked closely with major employers to design products and programs to help them
meet the CTR goals. Almost all these efforts focus on working with employers to reach
employees and providing tools and incentives to employees to use alternatives like busing,
carpooling, biking, telecommuting, and compressed work schedules [Travel Behavior,
Environmental, and Health Impacts of Community Design and Transportation Investment,
2005].
King County Metro with about 1,300 transit coaches and more than 700 vans in its vanpool fleet
and a well-integrated bicycle support program, has incorporated special event ride matching into
its regional rideshare program, rideshareonline, that is a self-serve, public, internet-based
rideshare matching service in association with regional carpool/vanpool providers [Cooper,
2007].
RideshareOnline.com instantly matches registered commuters with carpool or vanpool partners
with a similar daily commute in the area. Users enter their commuting times and locations and
can instantly see a list of ridematches to whom they may e-mail a rideshare request anytime for
everything from carpools, vanpools, SchoolPools and biking to work, to one-time special events
like ballgames and concerts and conferences [King County Metro Transit, 2010].
Redmond Transportation Management Association’s Ridematch system
Redmond is the seventh most populous city in King County and the fifteenth most populous city
in the State of Washington, with a residential population of over 46,000. It encompasses an area
of over 16.6 square miles. The city is well known as a center of technology and the location for a
22number of known high-tech and biomedical companies such as Microsoft, Nintendo, AT&T
Wireless, and Medtronic Physio-Control.
The Greater Redmond Transportation Management Association (GRTMA) has established an
automated ridematching system for carpools and vanpools on the Internet. RideQuest, is an
employer and geographic information system (GIS) based system with the database accessible by
SQL Server. Registered users enter a street address or a nearby intersection, and the software
produces a map showing that location for verification by the registrant. Then the request is
entered into the database along with information on the users travel needs and preferences such
as whether they wish to drive or ride, ride with smokers or non-smokers, or ride with employees
of specific companies. People are matched based on their origin address and final destination
with a numbering system of the best match to less potential match [Knapp, 2005].
The system can send automatic emails to other registered commuters who may be able to
rideshare. A map showing the requestor‘s location and the location of potential matches are
displayed on the screen together with their names and methods of contacting them. Individuals
can change their information at any time or remove themselves from the system if they have
found satisfactory ridesharing arrangements, moved, changed jobs, etc. Every three months, e-
mails are automatically sent to all registrants asking for their continued interest in participation.
Non-respondents are automatically removed along with those responding in the negative. An
early version of the system was tested in April 1999 with 1,200 registrants. There are no statistics
available on carpool formation [Casey, 2000].
GRTMA promotes the program using posters, post cards, email and the web site and has a
variety of promotions throughout the year to encourage people to register in the rideshare system
including a trip to Hawaii, and a 12-oz Starbucks Coffee beverage free. Vanpool drivers don't
have to pay the monthly vanpool fare and they also receive up to 40 personal use miles on the
van [Knapp, 2005].
Minerva Dynamic Ridesharing System
Aegis Transportation Systems developed a system called MINERVA in Oregon that takes
advantage of ATHENA smart traveler system. ATHENA developed in City of Ontario,
23California, with funding from the FTA in 1994, but the project was abandoned in 1996 due to a
turnover of the city council. The ATHENA project differed from other dynamic ridesharing
programs in that trip requestors would not have received a list of potential drivers, and would not
have had to contact trip providers to arrange travel. Instead, a central computer would have
arranged the match and advised the rider and driver of pickup points, times, and fares. The
ATHENA project incorporated a central database that interfaced with personal digital assistants
(PDA‘s), hand held devices that have messaging and GIS capabilities. Interested parties would
have pre-registered with ATHENA. Once registered, all ATHENA drivers would have received a
PDA for their car, and all potential passengers would also used telephone-based information
systems and other computer and communications technologies to integrate these new
personalized transportation services with conventional transit (e.g. bus, rail, ferry), paratransit
(e.g. taxi, shuttle, dial-a-ride), and ridesharing (e.g. carpool, vanpool, buspool) modes to develop
more cost-effective public transportation systems. Market research studies indicate that this
approach would reduce vehicle trips and vehicle miles traveled (VMT) per capita significantly, at
a low cost to taxpayers. MINERVA used ―smart‖ technology including cellular phones, palmtop
computers, and wireless data communications to provide low-cost alternatives to transportation
in low-density areas and low travel corridors. MINERVA took the ATHENA concept one step
further. MINERVA integrated the smart traveler system with other online information
services—home shopping, telebanking, e-mail, and interactive games—in an attempt to reduce
the need for some trips altogether [Levofsky et al., 2001].
The Oregon State legislature committed $1.5 million to the project, with additional commitments
of $3 million in matching funds from local pilot sites, and $1 million in in-kind support from
private management consulting outfits. A dozen Oregon cities expressed their interest in piloting
MINERVA [Victoria Transport Policy Institute, 2010].
Both ATHENA and MINERVA did not progress beyond the developmental stage and were
never implemented. However, their Internet and GIS components formed the basis of many
ridesharing programs in use today [Chan and Shaheen, 2011].
24Online Ridematching and Traveler Information Services
With respect to the fact that most of the dynamic ridematching applications and pilot tests of the
1980s and 90s failed to provide enough users to consistently create a successful instant
ridesharing match, next generation of the most dynamic ridesharing focused on more reliable
strategies to encourage ridesharing including online ridematching and traveler information
services. Before 1999, the websites for ridematching applications were either simple pages
listing agency contact information, online forms for users to email the agency to receive a
matchlist, or online notice boards for users to manually post or search carpool listings [Bower,
2004]. Between 1999 and 2004, private software companies began developing ridematching
platforms. Although it became much easier to find ridematches in a larger online database, the
carpools still suffered from the same inflexibility drawback as traditional carpools. Online
ridematching programs tended to be more static and inflexible and best suited for commutes with
regular prearranged schedules and were not competitive enough to compete with the flexibility
that private auto travel offered [Chan and Shaheen, 2011].
In another attempt, on July 2000, the Federal Communications Commission designated a
uniform ―511‖ as the traveler information telephone number to make real-time traveler
information more widely available for local, regional, and state agencies across the U.S.
including carpool and/or vanpool information services [Profiles of 511 Traveler Information
Systems Update, 2009].
Dynamic Ridesharing in the era of Internet Enabling Technologies
From 2004 to the present, dynamic ridesharing takes advantage of the incentive strategies that
encourage ridesharing such as HOV lanes, and park-and-ride efforts and it integrated with
Internet enabling technologies such as World Wide Web, Smart phones, Global Positioning
System (GPS), Data Repository, Automated Financial Transactions, and social networking.
Based on the research of the author, there are approximately 33 notable applications and
software platforms that offer ridesharing services. However, the systems typically serve as
platforms that bring users together, rather than as active mechanisms that generate rideshare
25plans and provide fair payments [Kamar and Horvitz, 2009]. Following is a brief description for
those applications and software platforms:
Aktalita is an under development application that combines the Web, a geospatially enabled
database, and a Java enabled cellphone to provide real-time carpooling between drivers and
passengers. When a driver is about to travel or a passenger needs a ride, they enter an offer or
request to the system via the web or Java enabled cellphone. The system then queries its
geospatial database to attempt to match passenger and driver, and notifies them for further
negotiation [http://www.aktalita.com/].
AlterNetRides.com works nationwide but also can be tailored for a community. It is completely
automated, a person can become a member, set up a ride and be viewing others wanting to
rideshare in just minutes [http://alternetrides.com/].
Avego is a proprietary application for Apple iPhone. It uses GPS technologies and presents an
intuitive user interface. The application relies on a proprietary service called Futurefleet, on
which no implementation details are given [http://www.avego.com].
Carpoolconnect.com matches up carpooling commuters based on similar commutes defined by
home and work zip codes [http://carpoolconnect.com/].
Carpoolworld.com uses the commuter's precise latitude and longitude coordinates to find the
best matches for their trip among the other commuters in the database, based on exactly how
close together they live and exactly how close together they work
[http://www.carpoolworld.com/].
Carpool.ca is available via the internet and uses home and destination locations, driving route
and other personal information to help commuters identify potential carpool partners. This self-
serve system has various levels of security, limiting individual access to personal rideshare
information while providing rideshare program administrators broader access. The program
includes a built in CO2 savings calculator [http://www.carpool.ca/].
Carriva is a proprietary solution using phone calls as communication system and a fixed price of
0,10€ / km. Currently it has got 1118 active users [https://www.carriva.org/MFC/app].
26Carticipate is a proprietary iPhone application that integrates with Facebook. It has a interface
looking like Google Maps mobile. It is an experiment in social transportation. According to the
website, it is available on 59 countries [http://www.carticipate.com].
Commuter Register is a multimedia publication that provides listings of car and vanpools, transit
routes and schedules, Park and Ride lots, and articles and helpful travel tips focusing on
employee commute matching [http://www.2plus.com/].
Divide The Ride is a static, web-based solution organized around children and family activities.
Families invite other trusted families to join their group. Groups get notifications when a ride is
needed [http://www.dividetheride.com/].
Ecolane DRT and Ecolane Dynamic Carpool are two ridesharing softwares offered by Ecolane
Company integrated with Nokia touchscreen device. Among the features, they declare that the
device is capable of real-time data communication, reports of arrivals and departures with time
information, device locking mechanisms, GPS location and direction, mileage tracking, detailed
trip information. It is a completely web-based, turn-key scheduling and dispatching solution with
user interfaces that are accessed securely using a standard web-browser using seamless
integration with multiple Mobile Data Terminal (MDT) and Automatic Vehicle Location (AVL)
platforms. It enables commuters to overcome the biggest obstacles of traditional carpooling
today - irregular working schedules and finding a carpool partner. Commuters are able to select
if they want to rideshare in as little as 15 minutes and create an instant carpool with the mobile
phone or web-based applications. The Ecolane Dynamic Carpool software communicates the
needs of both drivers and passengers, and automatically matches potential carpoolers based on
digital maps, individual profiles, user groups, and user ratings [http://www.ecolane.com/].
eCommuter is an internet-based technology application specializing in Real-Time Internet
traveler solutions. It is the first-to-market in the category of Internet ride-matching that gives
commuters the power to find their own partners for sharing a carpool or vanpool to work
[http://www.ecommuter.com].
eRideShare.com is a free service for connecting travelers going the same way. According to
Yahoo and Google it is the leading carpool/ridesharing website and has been recognized as "Best
27You can also read