Rare Earths and the U.S. Electronics Sector: Supply Chain Developments and Trends - USITC
←
→
Page content transcription
If your browser does not render page correctly, please read the page content below
Office of Industries
                                                           Working Paper ID-075
                                                           June 2021

Rare Earths and the U.S.
Electronics Sector: Supply Chain
Developments and Trends
Brian Daigle and Samantha DeCarlo

Abstract
The rise of rare earth elements (rare earths or REEs) as a key component in the electronics sector has
become increasingly important as more advanced technologies integrate multiple REEs throughout their
products and a variety of other sectors develop REEs containing consumer and industrial products.
Historic bottlenecks and concerns for potential future disruption in both the production of raw,
unprocessed REEs as well as REE processing has elevated both economic and national security concerns,
and the possibility of increased production in the United States and third country markets has been
noted as having the potential to decrease supply chain sensitivity.

This working paper will provide an overview of the current landscape for rare earths and the electronics
industry. It will begin with an introduction to rare earths, followed by a brief look at the role of REEs in
the contemporary electronics sector. It will then take a broader look at the challenges facing the REE
sector, including the concentration of modern raw REE production and rare earths processing in China,
as well as the rise of demand from a variety of competing industries, particularly by the automotive and
energy sectors. It will conclude with an exploration of the search for alternatives to address these supply
and demand challenges, noting countries expanding production (Australia and the United States) as well
as those with the potential to expand the supply of raw and processed REEs (Vietnam, Brazil, and
Russia). It will also look at ongoing efforts to reduce REE demand through reduced consumption and
recycling.

Disclaimer: Office of Industries working papers are the result of the ongoing professional research of USITC staff
and solely represent the opinions and professional research of individual authors. These papers do not necessarily
represent the views of the U.S. International Trade Commission or any of its individual Commissioners.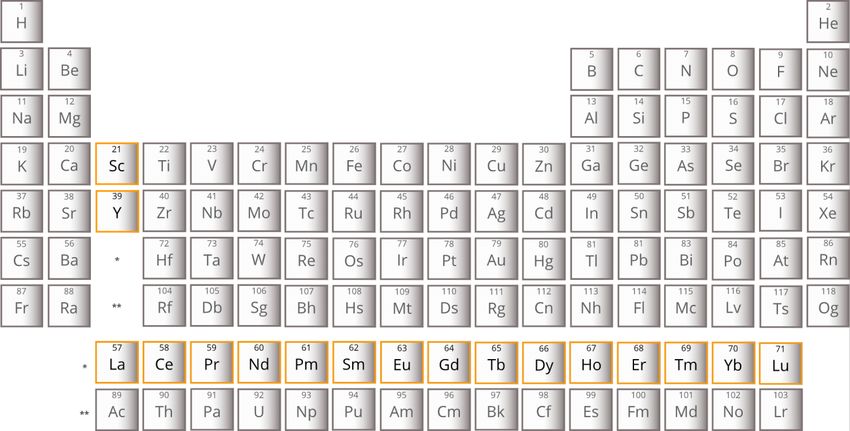
U.S. International Trade Commission

                  Rare Earths and the U.S.
                  Electronics Sector: Supply
                  Chain Developments and
                  Trends
                  Brian Daigle and Samantha DeCarlo
                  Office of Industries
                  U.S. International Trade Commission (USITC)
                  June 2021
                  The authors are staff with the Office of Industries of the
                  U.S. International Trade Commission (USITC). Office of
                  Industries working papers are the result of the ongoing
                  professional research of USITC staff. Working papers are
                  circulated to promote the active exchange of ideas
                  between USITC staff and recognized experts outside the
                  USITC, and to promote professional development of
                  office staff by encouraging outside professional critique
                  of staff research.
                  This paper represents solely the views of the authors
                  and is not meant to represent the views of the U.S.
                  International Trade Commission or any of its
                  Commissioners. Please direct all correspondence to
                  Brian Daigle and Samantha DeCarlo, Office of Industries,
                  U.S. International Trade Commission, 500 E Street, SW,
                  Washington, DC 20436, telephone: 202-205-3458, 202-
                  205-3165, email: Brian.Daigle@usitc.gov or
                  Samantha.DeCarlo@usitc.gov.
                  The authors would like to thank James Stamps, Karl
                  Tsuji, David Coffin, Alex Melton, Kelsi Van Veen, and
                  Bob Carr for their review and comments and Trina
                  Chambers and Monica Sanders for their production
                  support.
U.S. International Trade Commission Rare Earths and the U.S. Electronics Sector: Supply Chain Developments and Trends June 2021 No. ID-21-075
Introduction
An Introduction to Rare Earths
The U.S. Geological Survey (USGS) defines REEs broadly as “iron gray to silvery lustrous metals that are
typically soft, malleable, and ductile and usually reactive, especially at elevated temperatures or when
finely divided.” The REE grouping includes the 15 lanthanide series elements as well as scandium and
yttrium on the Periodic Table of Elements (figure 1).1 In modern times these elements have become
valued for their critical chemical and physical properties, including the magnetic properties which have
been key in the development of a variety of durable magnets, including strong permanent magnets, that
can withstand both heat and force without wearing down.2 REE magnets are used in a variety of high-
technology end-use applications, including in electronics (see the “REEs and Electronics” section below).
Generally, REEs are classified by their respective atomic weight as either light (e.g., cerium, lanthanum,
praseodymium, neodymium, samarium and scandium) or heavy (e.g., dysprosium, yttrium and
terbium).3

Figure 1 Periodic table of elements, rare earths (orange)

Source: Compiled by Staff based on European Geosciences Union, “Rare Earth Elements: Geochemistry and Geopolitics,” May 29, 2013.

1
  The 15 lanthanide elements are lanthanum (Ln), cerium (Ce), praseodymium (Pr), neodymium (Nd), promethium
(Pm), samarium (Sm), europium (Eu), gadolinium (Gd), terbium (Tb), dysprosium (Dy), holmium (Ho), erbium (Er),
thulium (Tm), ytterbium (Yb), and lutetium (Lu). Helmenstine, Anne, “List of Elements in the Lanthanide Series,”
ThoughtCo, December 12, 2019.
2
  BBVA Open Mind, “The Rare-Earth War,” February 26, 2021.
3
  Padhy, “Rare Earth Metal: Heavy vs. Light,” August 17, 2017.

3 | www.usitc.gov
The first REE containing ore (i.e., raw rare earth), gadolinite, was first recognized in Ytterby, Sweden in
1788.4 By 1803 two REEs were observed and identified: yttrium and cerium.5 Over the next century
there were dozens of false discoveries within the lanthanide series, largely attributable to the difficulty
in separating the metals in the REE-containing ores, with the difficulty in isolating and properly
identifying these metals were further hampered by the uncertainty of how many elements were within
the lanthanide series.6 The discovery in 1913 by British physicist Henry Moseley that determined there
were a total 15 lanthanide elements,7 in addition to scandium and yttrium,8 assisted immensely and
highlighted that element 61 (promethium) had yet to be observed.9

REE deposits consist primarily of bastnaesite and monazite along with other minerals. The largest
bastnaesite deposits are located in China and the United States, while monazite deposits are more
broadly dispersed (principally in Australia, Brazil, China, India, Malaysia, South Africa, Sri Lanka, Thailand,
and the United States).10 Despite its name, “rare” earths are fairly common in the earth’s crust (figure
2), and some are as abundant as more commonly known elements such as tin.11 However, REEs retain
this moniker due to their generally low concentration within deposits, and that some REE deposits also
contain radioactive elements.12 After a bastnaesite or monazite deposit has been identified rare earth
extraction is relatively simple, but separating and processing the rare earths into usable alloys and
metals for use in mid-stream products is an involved process (figure 3).13

4
  REE yttrium, ytterbium, terbium, and erbium were named after the Ytterby mines. Science History, “The History
and Future of Rare Earth Elements,” accessed March 8, 2021.
5
  Science History, “The History and Future of Rare Earth Elements,” accessed March 8, 2021.
6
  For example, “didymium” was published as an element with atomic mass 138 in the periodic table until Carl Auer
von Welsbach demonstrated that “didymium” was an alloy of two rare earth elements: neodymium and
praseodymium in 1885. Science History, “The History and Future of Rare Earth Elements,” accessed March 8, 2021.
7
  Until this point in time there had been debate as to how many elements would constitute the lanthanide series in
the periodic table. Science History, “The History and Future of Rare Earth Elements,” accessed March 8, 2021.
8
  Scandium and yttrium exhibit similar chemical properties to the elements in the lanthanide series but have
different magnetic and electronic properties.
9
  Element 61, promethium (Pm) is generally recognized as being characterized at Oak Ridge National Laboratory in
1945. Marinsky, Glendenin, Coryell, "The chemical identification of radioisotopes,” 1947, 2781–5.
10
   Other minerals contains smaller levels of REEs, and include apatite, cheralite, eudialyte, loparite, and
phosphorites Hurst, Cindy, “China’s Rare Earth Elements: What Can the West Learn?,” 2010, 4.
11
   Science History, “The History and Future of Rare Earth Elements,” accessed March 8, 2021.
12
   Such as uranium and thorium which are part of the actinide series. Science History, “The History and Future of
Rare Earth Elements,” accessed March 8, 2021.
13
   Congressional Research Service, “An Overview of Rare Earth Elements and Related Issues for Congress,”
November 2020, 5.
Figure 2 Estimated concentration of rare earth elements in the Earth’s crust (parts per million (ppm))
                      70

                      60

                      50
  Parts Per Million

                      40

                      30

                      20

                      10

                      0

Source: U.S. Geological Survey (USGS), “The Principal Rare Earth Elements Deposits of the United States—A Summary of Domestic Deposits
and a Global Perspective,” 2010, 5.
Note: This figure uses the Lyde (1997) estimate of the concentration of rare earths elements in the Earth’s crust.

Figure 3 Rare earths production process overview

Source: Hurst, Cindy, “China’s Rare Earth Elements: What Can the West Learn?” 2010, 5.

5 | www.usitc.gov
Historically, mining REE deposits in certain locations is considered as not commercially viable or
processing efforts are deemed too environmentally damaging.14 Today current REE production is highly
concentrated in only a few of countries (primarily China), and has led to concerns about production
bottlenecks and supply chain sensitivity both in the supply of REEs as well as the processing of REEs for
consumption. Both issues will be discussed further in the “REE Challenges for Electronics as Supply
Bottlenecks Loom and Competing Demand Rises” section below.
REEs and Electronics
REEs have been used in electronics and advanced machinery for nearly three-quarters of a century.
Demand for REEs in electronics began in earnest in the 1960s with the introduction of the first color
television sets, which initially used europium to produce the color images on the screen.15 Since then,
demand for rare earths has steadily grown as consumer demand for electronics rose. Simultaneously,
REEs have become increasingly integrated throughout electronic products (including screens, glass,
batteries, and magnets), and the rise in industry demands for REEs, particularly in the renewable energy
and automotive sectors, placed additional consumption demand on rare earths production.
Despite the small economic value of REEs relative to other sectors (one industry report estimated that
the rare earths market size was $13.2 billion in 2019, while global smartphone sales were more than
$400 billion in that year), REEs represent an integral component of modern electronics.16 One of the
most common, and important, uses of REEs in electronics is of neodymium in NIB (neodymium-iron-
boron, NdFeB) magnets.17 NIB magnets are more than 12 times stronger than conventional iron
magnets, and are frequently used in electronic products, as well as in lasers and telecommunications
systems (i.e., traveling wave tubes and wave radar amplifiers).18 Additionally, dysprosium, is often added
to protect these NIB magnets from high heat (e.g., generated from the motor within a smartphone).19
Smartphones are representative of the substantial contribution of REEs in the electronics sector:
• Depending on the model, a smartphone can contain yttrium, lanthanum, terbium, neodymium,
dysprosium, gadolinium, and praseodymium;20
14
Commercial viability refers to the costs associated with mining sufficient quantity of REE ores (raw rare earths)
and the high cost to process the REEs into commodities. For further information on the environmental challenges
of rare earths mining, see Ives, Mike, “Boom in Mining Rare Earths Poses Mounting Toxic Risks,” Yale School of the
Environment, January 28, 2013, Standaert, Michael, “China Wrestles with the Toxic Aftermath of Rare Earth
Mining,” Yale School of the Environment, July 2, 2019.
15
King, Hobart, “REE Rare Earth Elements and Their Uses,” Geology.com, 2018.
16
Global Market Insights, “Rare Earth Metals Market Industry Trends,” June 2020; Statista, “Smartphone sales
revenue worldwide 2013–2020,” November 23, 2020.
17
NIB magnets also contain small quantities of dysprosium and praseodymium. New Electronics, “Rare earth
elements vital to electronics industry,” September 13, 2011, Hurst, Cindy, “China’s Rare Earth Elements: What Can
the West Learn?,” 2010, 13.
18
New Electronics, “Rare earth elements vital to electronics industry,” September 13, 2011, Hurst, Cindy, “China’s
Rare Earth Elements: What Can the West Learn?,” 2010, 13.
19
NIB magnet composition is typically: neodymium 29 percent, dysprosium 2–4 percent, praseodymium less than
1 percent, and other metals 66–68 percent. Dodd, Jan, “Rethinking the use of rare earths elements,” WindPower
Monthly, November 30, 2018.
20
BBC, “You Old Phone is Full of Precious Metals,” October 17, 2016.• Neodymium, praseodymium, and dysprosium are fundamental to the sound system of most
smartphone brands, and modern haptic-based smartphone models also use REEs for the
vibration feedback in the home button;21
• Trace amounts of REEs are also used to produce colors in the screen, reminiscent of the early
uses of REEs in electronics.22
Looking more broadly at other electronic products, other uses of REEs emerge, including:
• Certain fitness trackers use active matrix OLED (AMOLED) screens. OLED screens can contain as
many as seven different REEs, including for use in color emission (yttrium, lanthanum, terbium,
europium, gadolinium) as well as reducing ultraviolet light penetration (praseodymium,
dysprosium);23
• NIB magnets are frequently used in laptops to provide more precise control in the motors that
spin laptop hard disks and the arm that writes and reads data, which allows for greater storage
capacity;24
• Erbium ions (of high energy state) are embedded in optical fibers, which release stored energy
as light travels along the optical fiber, thereby amplifying signals;25
• Europium is used as a fluorescent for desktop computer monitors, as well as television
monitors.26
The use of REEs has become fundamental to the electronics sector, allowing electronic products to
process information more quickly and store data more efficiently, thereby enhance user experience.
However, as described below, the U.S. electronics sector faces several significant challenges to procuring
sufficient REE supplies for downstream products. Supply bottlenecks for both raw REEs as well as
processed REEs can lead to pricing issues for REEs and potential supply disruptions. Additionally, the rise
of competing REE demand from other industries could further squeeze the U.S. electronics sector.
21
Visual Capitalist, Extraordinary Raw Materials in an iPhone 6,” March 8, 2016.
22
Apple, “iPhone 12 Pro Max Product Environmental Report,” October 2020.
23
Magyar, Tamas, Sandor Nagy, Janka Orsi, Richard Papp, “Chemical and material characterization of smartphones
with special regards to OLED screens for recovery of valuable elements,” ECOTERRA-Journal of Environmental
Research and Protection, 2018, 20.
24
New Electronics, “Rare earth elements vital to electronics industry,” September 13, 2011.
25
New Electronics, “Rare earth elements vital to electronics industry,” September 13, 2011; Van Veen, Kelsi and
Alex Melton, “Rare Earth Elements Supply Chains, Part 1: An Update on Global Production and Trade,” Executive
Briefing on Trade, U.S. International Trade Commission, December 2020.
26
King, Hobart, “REE Rare Earth Elements and Their Uses,” Geology.com, 2018.
7 | www.usitc.govREE Challenges for Electronics as Supply
Bottlenecks Loom and Competing Demand
Rises
Over the last 15 years, the largest challenge to the consumption of REEs in electronics, as well as other
products (such as electric vehicles (EVs), wind turbines, and lasers), has been the risk of supply
disruption. Generally, supply disruption in REEs can occur at two stages: the initial production of REEs
into its’ raw “unprocessed” form, and after REEs have been processed into workable alloys for
incorporation into midstream products such as magnets and end-stream products like smartphones and
wind turbines. Both stages are heavily concentrated in a few countries (particularly China), so the risk
for disruption can be significant.
In addition to these ongoing REE threats to the electronics sector from the supply side, an additional
concern has emerged for electronics manufacturers: the rise of demand from other competing
commercial industries. While the electronics sector has historically represented a substantial share of
REE consumption and was one of the first major industries to adopt REEs on a large scale, other
industries (particularly in the renewable energy sector) have emerged with increasing demand for
REEs.27 This section will describe both the supply and demand threats to REE consumption in the
electronics sector, and will be followed with a section exploring potential future sources of REEs (as well
as the efforts to reduce and recycle REEs to create more effective closed loop REE supply chains).
The Evolution of REE Production and Potential
Trade Disruptions
While REEs have been mined for over two centuries, their commercial value developed with the advent
of the Atomic Age (i.e., post 1945). Between 1900 and the present, there were three periods of REE
production: the 1900–40 period, when India and Brazil largely supplied the world’s REE materials; the
1960–2000 period, when the United States (chiefly California) was the predominant supplier; and 2000–
present, which witnessed the rise of China as the predominant producer of rare earths. For a more
detailed historical discussion of these periods, see Appendix A.
Since China emerged as the largest producer of REEs, consumers of rare earths have noted that the
potential for supply disruption is significant. Incidents in 2010 and 2011–13 confirmed that price and
supply instability can disrupt the provision of rare earths for midstream manufacturers (such as magnet
producers) and downstream electronics manufacturers, noted below. This section will explore the
supply chain challenges that have emerged over this century of both raw REEs and processed REEs.
The Risk of Raw REE Disruption
From 2000 onward, China represented the majority producer of the world’s rare earths output: for
multiple years, China produced more than 95 percent of the total raw earths consumed around the
world, and since 2000 China’s share of global REE production has not fallen below 59 percent (figure 4).
27
REES are also widely used in a variety of military applications, but these will not be discussed in this paper.Figure 4 China’s production of raw REEs as a share of global production, metric tons (MT)
300,000 100%
90%
250,000
80%
70%
200,000
60%
Percent
MT
150,000 50%
40%
100,000
30%
20%
50,000
10%
- 0%
China REE Production ROW Production China Share REE Prodution
Source: U.S. Geological Survey, “Rare Earths,” 2000–2020.
Note: REE mining production data is reported in rare earth oxide equivalent. It does not include production from further processing. For years
2015 to 2020, China REE production data only notes China’s REE production quotas, and does not include undocumented production. This may
undervalue China’s REE production in the 2015–20 period.
China’s large share of global REE production raised concerns among downstream consumers that the
potential for REE disruption is significant. In September 2010, Japanese authorities arrested a Chinese
fishing boat in the disputed waters between China and Japan, resulting in the halt of raw rare earths
exports from China to Japan (China’s largest export market for rare earths).28 The following month, it
appeared that China had expanded this export limitation to the United States,29 and China reduced its
total export quotas by 40 percent. After a 2012 World Trade Organization (WTO) panel ruled in favor of
the United States, Japan, and the European Union in a dispute settlement procedure against these
export quotas, China eventually relaxed the quotas in 2016 and global REE prices stabilized.
Prior to the relaxation of trade restrictions, this disruption in exports had a significant impact on rare
earths pricing, and subsequently contributed to trade distortions. Between 2010 and 2011, the prices of
neodymium rose nearly 600 percent (from $19 to $129 per pound), samarium rose nearly 700 percent
(from $8.40 to $66 per pound), terbium rose over 640 percent (from $275 to $2054 per pound), and
europium increased nearly 900 percent (from $270 to $2672 per pound), and reports indicate that price
28
Bradsher, Keith. “Amid Tension, China Blocks Vital Exports to Japan.” New York Times, September 22, 2010.
29
Wiggin, Addison, “The Truth Behind China’s Rare Earths Embargo,” Forbes, October 20, 2010.
9 | www.usitc.govof dysprosium rose by nearly 20-fold.30 Subsequently, U.S. imports of rare earths experienced a 338
percent increase in value from 2010 to 2011 due principally to these price increases (figure 5), while the
import of rare earths by quantity experienced a much more subdued increase in that period.31
Figure 5 U.S. imports of rare earths compounds from China and the rest of the world (ROW), 2000–20
(million $)
900
800
700
600
Millions $
500
400
300
200
100
0
China ROW
Source: Global Trade Atlas (GTIS), (HS 2846) (accessed March 15, 2021).
Note: This figure is of compounds derived from ores containing rare earths under HTS 2846 (“Compounds, inorganic or organic, of rare-earth
metals, of yttrium or of scandium, or of mixtures of these metals”).
Industry representatives and government agencies noted that the 2010–13 period highlighted that
many industries were sensitive to the concentration of rare earths production in China. Subsequently,
production of raw rare earths in a variety of countries began to rise, including Australia, Thailand, and
the United States, contributing to efforts to diversify production of raw rare earths which in turn
reduced China’s estimated global production share. Despite additional production coming online, China
remains the single largest producer of raw rare earths in the world, and in 2020 produced more than
three times as much REE as the second largest producer, the United States (140,000 metric tons of rare
earth oxides [REO] and 38,000 metric tons of REOs, respectively).32 A discussion of both China and the
United States’ production trends is explored in further detail in Appendix A.
30
Statista, “Prices of the five most critical rare earths between September 2010 and October 2011 (per kilogram),”
November 6, 2011; Edmondson, James, “Will Rare-Earths be Eliminated from Electric Vehicle Motors?” Advanced
Batteries and Energy Storage, November 2, 2020; Bradsher, Keith, “Supplies Squeezed, Rare Earth Prices Surge,”
New York Times, May 2, 2011.
31
U.S. Geological Survey, “Rare Earths 2013,” January 2013.
32
REE mining production data is reported in REO equivalents. It does not include production from further
processing. U.S. Geological Survey, “Rare Earths 2021,” January 2021.Potential Processing Bottlenecks As already noted in figure 2, before rare earths can be used in final products, such as smartphones and fiber optical cables, they must be processed first. Processing involves extracting the REOs from the ore and then separating it from the other elements present, but the desired REE can often represent as little as 1 percent of the quantity of the mined deposit. Extracting the REO and subsequently isolating the REE (metal), or alloys (mixed metals) must be achieved prior to incorporating rare earths into midstream products, such as magnets, for final use. These stages often require significant capital investments, as well as advanced technical capabilities (particularly given the high-purity product demands of many REE consumers).33 As China’s production of raw rare earths grew in the 1990s and early 2000s, it simultaneously became the world’s largest processor of rare earths. With only a few major processors outside of China— notably facilities in Estonia and Malaysia—China maintains a significant position throughout the REEs supply chain, and by some estimates processes upwards of 95 percent of all REE even as its share of raw production has recently declined (and China is the only country with the ability to process all types of REEs).34 China also spared its processing capacity from trade disruption during the 2010–13 period (e.g., limited supplies of raw rare earths to the United States and Japan) conversely China did not appear to impose similar restrictions on its processed rare earths.35 Similar to developments in the production of raw rare earths, there are indications that there is international interest in diversifying the entire production process of rare earths.36 The United States, Canada, Russia, Australia, and several other countries have announced investments in creating or expanding their raw earths processing capacity.37 Many of these developments, which will be discussed in further detail in the “The Search for Alternatives” section below, reflect significant interests from both governments as well as private sector industries (including the electronics sector) in moving the rare earths supply chain beyond China. Growing Demand Accompanying the well-known supply-side challenges in both the production of raw rare earths and in processed REEs, growing demand from a variety of industry sectors could also create challenges for electronics manufacturers attempting to source REEs. One 2021 assessment estimated that with the growth of the renewable energy and EV sectors, that by 2028 global demand for neodymium would 33 Van Veen, Kelsi and Alex Melton, “Rare Earth Elements Supply Chains, Part 1: An Update on Global Production and Trade,” Executive Briefing on Trade, U.S. International Trade Commission, December 2020. 34 Outside of China the two major processing facilities for rare earths are Canadian firm Neo Performance Materials’ processing facility in Estonia, and the Australian firm Lynas’ facility in Kuantan, Malaysia. Kozak, Frederick, “The Top 5 Rare Earths Companies for 2021,” Investor Intel, January 8, 2021; Gerden, Eugene, “Analysts expect further competition in the global REE mining sector,” Resource World, October 2020; Ahmed, Nafeez, “We Don’t Mine Enough Rare Earth Metals to Replace Fossil Fuels With Renewable Energy,” Vice, December 12, 2018. 35 Bradsher, Keith. “Amid Tension, China Blocks Vital Exports to Japan.” New York Times, September 22, 2010. 36 Nikkei Asia, “Quad tightens rare-earth cooperation to counter China,” March 11, 2021. 37 Tegler, Eric. “The U.S. is Trying to Secure Rare Earth Elements for National Security. That goes Beyond Simple Investment,” Forbes, February 6, 2021; Saskatchewan.ca, “Saskatchewan to Create Canada’s First Rare Earths Processing Facility at SRC,” August 27, 2020; Gerden, Eugene, “Analysts expect further competition in the global REE mining sector,” Resource World, October 2020; Kruger, Colin, “Rare earths market draws a crowd as new Lynas rivals gear up,” Sydney Morning Herald, March 5, 2021. 11 | www.usitc.gov
necessitate an additional 7,000 metric tons of neodymium production every year, roughly equal to all
current U.S. neodymium metal-consumption capacity.38

Demand, as does supply, for REEs differs by REE, with one academic noting, “there is no single ‘rare
earth market’ to speak of, but rather, multiple markets for the 17 elements with widely divergent
availabilities and applications.”39 Hence, there is significant potential for future shortages for some REEs
while others maintain a balanced market. A 2012 assessment found that demand for dysprosium and
neodymium, both used heavily in electronic products (i.e., NIB magnets), would likely exceed projected
supply by 2025, and the supply-demand imbalance for dysprosium would likely worsen as supply for
other REEs would likely not exceed demand.40 A subsequent 2021 assessment found that current
supplies of neodymium, praseodymium, dysprosium, and terbium are likely to only narrowly exceed
their respective demands, while other rare earths markets like cerium and lanthanum likely will remain
with excess supply commercially confirming the findings in 2012.41

Despite the rise of demand for REEs overall, the consumer electronics’ share of REE demand appears to
be falling. While one 2008 assessment found that the electronics sector constituted the largest end-use
consumer of REEs, by 2020 this demand had fallen below the automotive sector, with the renewable
energy sector not far behind.42 Both the automotive and energy sectors are experiencing substantial
changes in their industries which have contributed to elevated REE demand, which are described in
greater detail in Appendix B.43

The Search for Alternatives
Acknowledging both demand and supply challenges for the rare earths sector, industry stakeholders
have explored options to diversify the REE supply chain. On the supply side, this means elevating
production of raw rare earths outside of China to diversify supply, as well as increasing processing

38
   Barrera, Priscila, “Rare Earths Outlook 2021: REE Magnet Supply to Remain Tight,” Investing News, January 20,
2021.
39
   Cerium, for example, constituted approximately 42 percent of all rare earths production in 2018, while
promethium is estimated to be the third rarest element to naturally occur in the Earth’s crust. Grand View
Research, “Rare Earth Elements Market Size, Share & Trends Analysis Report by Product (Cerium, Dysprosium,
Erbium), by Application (Magnets, Catalyst), by Region, and Segment Forecasts, 2019–2025,” September 2019; U.S.
Geological Survey (USGS), “The Principal Rare Earth Elements Deposits of the United States—A Summary of
Domestic Deposits and a Global Perspective,” 2010, 5; Klinger, Julie, “Historical geography of rare earth elements:
From discovery to the atomic age,” Extractive Industries and Society, 2015, 2.
40
   MIT, “Rare Earth Elements Supply and Demand,” 2013.
41
   Barrera, Priscila, “Rare Earths Outlook 2021: REE Magnet Supply to Remain Tight,” Investing News, January 20,
2021.
42
   The Geological Society of London, “Rare Earths Elements Briefing Note,” 2011, 4; Barrera, Priscila, “Rare Earths
Outlook 2021: REE Magnet Supply to Remain Tight,” Investing News, January 20, 2021.
43
   Kruger, Colin, “Electric vehicles, wind turbine demand drive Lynas’s bumper profit,” Sydney Morning Herald,
February 26, 2021.
capacity globally to reduce the possibility of bottlenecks and unexpected supply disruptions.44 On the
demand side, several industry consumers of rare earths have explored multiple options to decrease
their dependence on rare earths, including reducing consumption of rare earths in favor of other
technologies as well as increased recycling to facilitate closed loop rare earths consumption. This section
will explore both the supply and demand initiatives, beginning with leading potential sources of raw rare
earths production and processing—Australia, the United States, Vietnam, Brazil, and Russia—and
concluding with a brief review of industry efforts to reduce REE demand through reductions in REE
consumption and REE recycling.

Efforts to Increase Diversified Production
In 2020 four countries represented approximately 82.5 percent of the 120 million tons of global
mineable reserves of rare earths on land (figure 6): China (36.7 percent), Brazil (17.5 percent), Vietnam
(18.3 percent), and Russia (10 percent).45 The other largest reserves are held by India, Australia,
Greenland, the United States, Tanzania, and South Africa. Combined, these 10 countries represent more
than 95 percent of known global REE reserves.

Figure 6 Estimated rare earths reserves by country, 2020 million metric tons (MMT)
           50
                 44
           45
           40
           35
           30
     MMT

           25                 22           21
           20
           15                                          12
           10                                                      6.9
                                                                                4.1
           5                                                                                 1.5         1.5         0.89         0.79
           0
                China      Vietnam       Brazil      Russia       India      Australia Greenland United           Tanzania       South
                                                                                                 States                          Africa
Source: U.S. Geological Survey, “Rare Earths 2021,” January 2021.
Note: Does not include global reserves of scandium, which the USGS classifies separately. Measured in metric tons of rare earths oxide (REO)
equivalent.

44
   Several industry experts have noted concern that the January 2021 military coup in Myanmar, which in produced
an estimated 30,000 metric tons of rare earths in 2020, could disrupt trade in heavy rare earths. China, a
substantial imported of Burmese-produced raw rare earths for further processing, has been particularly concerned
at the threat of supply disruption. Merriman, David, “Rare earths: Myanmar coup d’etat creates more uncertainty
for heavy rare earth supply,” February 2, 2021; Asia Times Financial, “Myanmar crisis poses risks to global rare
earth supply chain,” February 2, 2021.
45
   Van Veen, Kelsi and Alex Melton, “Rare Earth Elements Supply Chains, Part 1: An Update on Global Production
and Trade,” Executive Briefing on Trade, U.S. International Trade Commission, December 2020; U.S. Geological
Survey, “Rare Earths 2021,” January 1, 2021.

13 | www.usitc.gov
Given the high cost and technical expertise required to mine and process rare earths, production has not
typically mirrored supply. Indeed, neither of the large shares of global production held by China from
2000 to the present nor of the United States from 1960 to 2000 (described in Appendix A) reflected
existing supply, but rather a combination of technical capacity, investment, and domestic as well as
global demand. The contrast between production and reserves in 2020 are represented in figures 7 and
8.
Figure 7 Mine production of raw rare earths, by leading countries, 2020 (total global production:
243,000 metric tons)
Madagascar Other producers
3% 4%
Australia
7%
Myanmar
12%
China
58%
United States
16%
Note: Does not include scandium, which is broken out separately by the U.S. Geological Survey.
Source: U.S. Geological Survey, “Rare Earths 2021,” January 2021.
Figure 8 Shares of estimated global REE reserves, by leading countries (2020 total global reserves: 120
million metric tons)
United States All others
1% 7%
Australia
3%
China
37%
India
Russia
10%
Brazil
Vietnam
18%
Note: Does not include scandium, which is broken out separately by the U.S. Geological Survey.
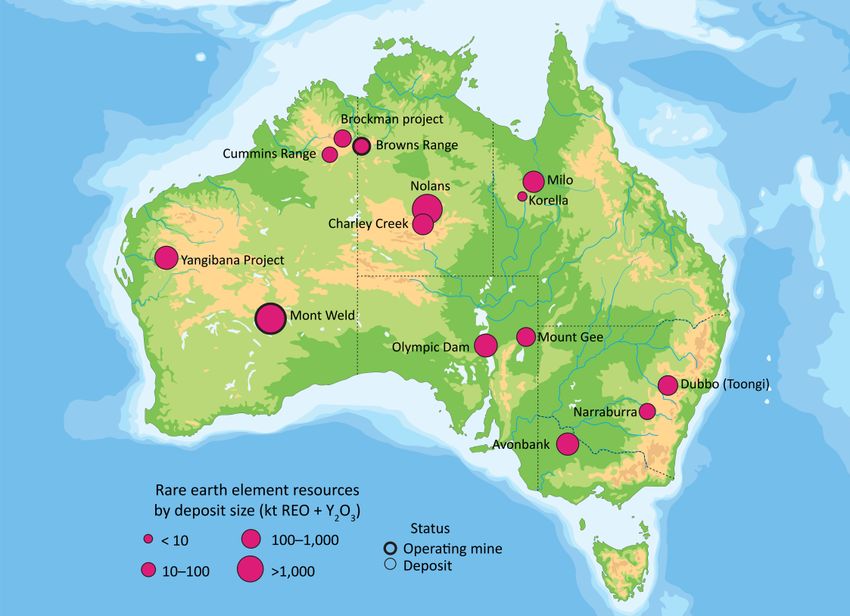
Source: U.S. Geological Survey, “Rare Earths 2021,” January 2021.As figure 8 shows, there is substantial available supply of rare earths ores in a variety of countries that are not currently major producers or exporters of rare earths, particularly Vietnam, Brazil, and Russia. Australia and the United States, the first two countries explored in this section below, are currently producing well above their shares of global reserves, a reflection of ongoing investment and technical capacity in these two countries. Australia After China, Australia has frequently been the largest producer of REEs during the past several years; Australia was the second largest producer of REEs from 2015–18 and was the only major competitor to China in this period. By 2019 though Australia was supplanted by the United States when California’s Mountain Pass mine resumed production after a three-year hiatus.46 In the 2015–20 period, Australia produced between 12,000 and 21,000 metric tons of REOs, and last year produced 17,000 metric tons of REO (as the world’s fourth largest producer in 2020, after China, the United States, and Myanmar).47 Figure 9 Known rare earths deposits and mines in Australia, 2019 Source: Compiled by staff based on Plastow, Killian, “Why everyone’s talking about Australia’s rare earth,” New Daily, December 8, 2019. 46 In this period, one industry report notes that Australia produced around 10 percent of the world’s raw rare earths supply, while China produced 85 percent, and the rest of the world produced the remaining 5 percent. Sharp, Neil, “Why are rare earth elements so crucial for electronics manufacturing,” JJS Manufacturing, October 3, 2019; U.S. Geological Survey, “Rare Earths 2021,” January 2021. 47 U.S. Geological Survey, “Rare Earths 2021,” January 2021. 15 | www.usitc.gov
Australia has the sixth-largest highest known reserves of rare earths, 3.4–4.1 million metric tons,
though this only equates to around 3 percent of the global supply.48 However, its ability to elevate
production relative to its supply reflects an important factors that will likely contribute to Australia’s
future rare earths production. Firstly, Australia’s extensive mining capabilities beyond rare earths has
provided it with substantial technical resources and market investment well beyond its share of global
reserves.49

Secondly, its location in the Asia-Pacific region provided Australia with a unique opportunity during the
early rare earths disputes between China and Japan in 2010. During this dispute, Japan’s unmet demand
led to significant investment from Japanese firms and ultimately there was sufficient capital raised that
facilitated REE production by the Australian firm Lynas Corps, Ltd. With the funding available Lynas,
subsequently began production (at Mt. Weld in the state of Western Australia) in 2011 and currently
produces nearly all of Australia’s mined rare earths, including neodymium, praseodymium, lanthanum,
and cerium.50

Finally, Australia’s current raw rare earths production is processed outside of China, at Lynas’ processing
facility in Kuantan, Malaysia. This provides Australian mining with a unique capacity to sidestep both raw
materials and processed REE supply chain bottlenecks in providing downstream consumers with REEs.51
Lynas is also investing in additional processing capabilities in Kalgoorlie, Western Australia, thereby even
further expanding processed REE production beyond China.52 Several other Australian firms are also
investing in exploring, assessing, and developing rare earths deposits, including in the Northern
Territories, New South Wales, and other locations in Western Australia beyond the Mt. Weld deposit
(figure 9), providing future potential resources if investment and demand align.

United States
Similar to Australia, the United States now produces raw rare earths at a level far above its share of
global reserves. At 1.5 million metric tons of REEs, the United States ties for seventh in global reserves
along with Greenland (with each representing approximately 1 percent of global reserves).53 Despite
elevated production relative to its reserves (in 2020, the United States produced 38,000 metric tons of
REEs and 16 percent of global raw REEs), U.S. production as a share of global production is far below the
1960–1995 period when the United States was the predominant global producer (for further
information, see Appendix A).

Current raw earths production in the United States is almost entirely located in the Mountain Pass
mining facility in southern California along the Clark Mountain Range near the Nevada border.54 The
bastnasite deposit represents the only major source of raw rare earths mining in North America, and the
only mine in the Western Hemisphere with known production above 1,000 tons.55 The mine produces
cerium, lanthanum, neodymium, and europium. Unlike Australia’s facilities, however, all raw rare earths

48
   Tibballs, Scott, “Rare Earths in Australia,” March 9, 2021.
49
   Tibballs, Scott, “Rare Earths in Australia,” March 9, 2021.
50
   Lynas, “Lynas Rare Earths,” 2021.
51
   Lynas is also currently planning an additional rare earths processing facility in Kalgoorlie Western Australia,
further expanding processing capability. Lynas, “Lynas in Western Australia FAQs,” May 2020.
52
   Lynas, “Lynas in Western Australia FAQs,” May 2020.
53
   U.S. Geological Survey, “Rare Earths 2021,” January 2021.
54
   U.S. Geological Survey, “Rare Earths 2021,” January 2021
55
   U.S. Geological Survey, “Rare Earths 2021,” January 2021.
mined in the United States are exported to other countries (principally China) for processing. The United
States currently lacks sufficient processing capacity to meet its own rare earths production needs.56

In addition to the Mountain Pass mine, there are several other locations in the United States that are
potentially suitable for mining, and there are indications of commercial interest for many of the locales.
In western Texas, the Round Top Mountain deposit contains nearly all rare earths, including neodymium
and dysprosium, and all heavy rare earths.57 The existence of heavy rare earths in this area, particularly
dysprosium, is noteworthy since the United States currently does not produce any heavy rare earths and
U.S. producers must rely on heavy rare earths production in China and elsewhere to fill heavy rare earth
demand.58 Two rare earths firms, USA Rare Earth LLC and Texas Mineral Resources Corp, have
announced collaborative efforts in developing this area for rare earths mining.59

Other U.S. locations have been explored by firms for raw REE deposits, and some are in early
development. In Nebraska, a niobium mining facility in Elk Creek is under construction by NioCorp,
which will also produce scandium.60 The Bear Lodge region in northeastern Wyoming contains several
rare earths, and a demonstration project is currently being completed to establish viability for future
mining. Similarly in Alaska, eight regions have been identified as likely containing rare earths, with the
Bokan Mountain region currently under exploration for future development by U.S. firm Ucore.61 In
Utah, U.S. firm Energy Fuels announced it would purchase 2,500 metric tons of monazite sands from
the Offerman Mineral Sand Plant in southern Georgia for a three-year period to process and extract
neodymium and praseodymium.62

In processing rare earths, U.S. government agencies, U.S. firms, and some foreign firms have expressed a
significant interest in creating domestic processing capability for U.S. and foreign-origin raw rare earths.
Over the last year, several initiatives have been announced to support the production of processing
capabilities in the United States:

     •   In February 2021, Australian firm Lynas announced it had won a contract under the Defense
         Production Act (DPA) to establish a light rare earths separation facility in Hondo, Texas (in
         addition to its heavy earths facility already under construction).63 Although the facility is
         expected to initially serve Lynas’ Australian REE production and assist its Malaysian processing

56
   Reuters, “Factbox: Rare earths projects under development in U.S.,” April 22, 2020. Also see Appendix A for a
discussion of the evolution of U.S. REE production.
57
   Vinski, Jim, “The U.S. Needs China for Rare Earth Minerals? Not for Long, Thanks to This Mountain,” Forbes, April
7, 2020.
58
   Kozak, Frederick, “The Top 5 Rare Earths Companies for 2021,” Investor Intel, January 8, 2021
59
   Global Newswire, “USA Rare Earth’s Rare Earth & Critical Minerals Pilot Plant Development and Processing
Facility Officially Opens,” June 11, 2020.
60
   Mining Technology, “Elk Creek Niobium Project, Nebraska,” n.d. (accessed March 16, 2021).
61
   Lasley, Shane, “Alaska is rich in critical rare earths,” Mining News North, June 22, 2020.
62
   The firm, which will also be extracting uranium from the sand, also announced it would work with the Canadian
firm Neo Materials to further process REEs in Neo Materials’ processing facility in Estonia. Bomgardner, Melody,
“Utah-based Energy Fuels plans rare earths production,” CE&N, December 21, 2020; Hui, Mary, “A US-Europe rare
earths partnership is sandwiched by China,” March 12, 2021.
63
   Reuters, “Pentagon awards $30 million in rare earths funding to Australia’s Lynas,” February 1, 2021; McCrae,
Michael, “Lynas wins U.S. Defense contract to build REE plant in Texas,” Kitco News, February 2, 2021.

17 | www.usitc.gov
operations, it may expand to including processing U.S. raw REE production.64 The U.S.
Department of Defense, which concluded the technology investment agreement with Lynas
over production of this facility, estimates that the successful completion of this project could
support the production of 25 percent of the world’s processed REOs.65
• In January 2021, the U.S. Department of Energy provided funding for the creation of two rare
earths processing facilities in Wyoming: a $22 million grant to General Atomics in Upton,
Wyoming to separate and process REEs extracted in a demonstration project at Bear Lodge; and
a $500,000 grant to the University of Wyoming in Laramie for research into the generation of
REEs using microwave plasma on REOs;66
• In November 2020, MP Materials announced it would spend $200 million following a DPA grant
to restart its light REEs processing facility to serve its Mountain Pass Mine in California.67 The
firm also indicated it may be able to operate throughout the supply chain by establishing a
facility to produce NIB magnets;68
• In Alaska, Ucore announced in October 2020 its plan to open a rare earths separation and
purification facility in Ketchikan to serve as a processing facility for U.S. raw REE production,
with an eventual goal of also establishing a REE mine in the nearby Bokan Mountain (which may
contain more than 30,000 metric tons of REEs, 40 percent of which are estimated to be heavy
REEs);69
• In June 2020, USA Rare Earth and Texas Mineral Resources Corp, jointly developing mining
capacity at the Round Top mountain in Texas, announced a pilot processing facility in Wheat
Ridge, Colorado.70 The facility is expected to be able to separate rare earths into heavy and light
REEs, as well as recover critical non-REE metals such as lithium, uranium, beryllium, and
hafnium.71
Vietnam
Vietnam has the second largest known reserves of rare earths on land, at 22 million metric tons (18
percent of global supply).72 This represents nearly one-half of China’s known rare earths reserves and is
64
Reuters, “Pentagon awards $30 million in rare earths funding to Australia’s Lynas,” February 1, 2021; McCrae,
Michael, “Lynas wins U.S. Defense contract to build REE plant in Texas,” Kitco News, February 2, 2021.
65
Defense.gov, “DOD Announces Rare Earth Element Award to Strengthen Domestic Industrial Base,” February 1,
2021.
66
Wyoming News, “Wyoming initiatives receive federal funding for rare earth mineral research,” January 22, 2021.
67
Reuters, “Factbox: Rare earths projects under development in U.S.,” April 22, 2020; Kozak, Frederick, “The Top 5
Rare Earths Companies for 2021,” Investor Intel, January 8, 2021.
68
Kozak, Frederick, “The Top 5 Rare Earths Companies for 2021,” Investor Intel, January 8, 2021.
69
Lasley, Shane, “Alaska is rich in critical rare earths,” Mining News North, June 22, 2020; Lasley, Shane, “Ucore
unveils Alaska2023 rare earths plan,” Metal Tech News, October 7, 2020.
70
Global Newswire, “USA Rare Earth’s Rare Earth & Critical Minerals Pilot Plant Development and Processing
Facility Officially Opens,” June 11, 2020.
71
Global Newswire, “USA Rare Earth’s Rare Earth & Critical Minerals Pilot Plant Development and Processing
Facility Officially Opens,” June 11, 2020.
72
U.S. Geological Survey, “Rare Earths 2021,” January 2021.more than 10 times larger than known U.S. reserves.73 Vietnam’s rare earths are largely concentrated in monazite and zircon deposits in the northwestern provinces of Lào Cai and Lai Châu, bordering southern China.74 The largest deposits, Mau Xe North, Mau Xe South, and Dong Pao, contain cerium, lanthanum, neodymium, praseodymium, yttrium, gadolinium, and europium.75 The Dong Pao deposit alone contains approximately 7 million metric tons of rare earths, more than double all global REE production from 2000 to 2020.76 Despite these substantial reserves, Vietnam produces very little rare earths. Before 2018, Vietnam had not produced more than 400 metric tons of rare earths in a given year, and between 2000 and 2011 the USGS estimates that Vietnam produced no substantial quantities of raw rare earths.77 Between 2018 and 2020, raw production of rare earths began to increase, with 400 metric tons of production in 2018, followed by 1,300 metric tons in 2019, and 1,000 metric tons in 2020.78 While this represents only a very small portion of global supply, the volume of rare earths supply has drawn investor interest during periods of disruption. In 2010, several Japanese firms, including Toyota, announced investment in REE mining in Vietnam, coinciding with investments from Japanese firms in increasing production capacity in Australia.79 Although this early interest did not appear to translate to substantial REE production, increased interest in diversification of supply may elevate interest in building out Vietnamese REE capacity. Brazil Broadly, Brazil shares several similarities with Vietnam with respect to rare earths. First, it has substantial reserves of rare earths deposits and ranks third in the world for estimated supply (21 million metric tons, approximately 17 percent of global supply). Rare earths deposits stretch along Brazil’s coast, in addition to those further inland in the states of Minas Gerais and Goias, and further north near the borders of Suriname and Guyana.80 These deposits contain a variety of REEs, including neodymium and cerium.81 Also similar to Vietnam, such despite large reserves, Brazilian production of raw rare earths is low. Recent production over the last few years has not exceeded 2,000 metric tons annually, and in several 73 U.S. Geological Survey, “Rare Earths 2021,” January 2021. 74 Kushnir, Imrich, “Mineral resources of Vietnam,” Act Montanistica Slovaca, 2000, 7. 75 Kushnir, Imrich, “Mineral resources of Vietnam,” Act Montanistica Slovaca, 2000, 7. 76 Kushnir, Imrich, “Mineral resources of Vietnam,” Act Montanistica Slovaca, 2000, 7. 77 U.S. Geological Survey, “Rare Earths,” 2000–2021 editions (for full list of USGS Rare Earths reports, consult bibliography). 78 U.S. Geological Survey, “Rare Earths 2021,” January 2021. 79 Some investment announcements preceded the disruption of Chinese rare earths exports to Japan, though several announced followed the disruption. In May 2010, Showa Denko Rare Earth Vietnam announced the competition of a new rare metal facility to produce dysprosium for use in neodymium magnetic allows. SDK, “Ensuring Stable Supply of High-Performance Magnetic Alloys,” May 11, 2010; Yuasa, Shino, “Japan to Mine Rare Earths in Vietnam,” Manufacturing.net, October 22, 2010; Watts, Mark, “Toyota expects Vietnam rare earth mining rights by end of year,” Metal Bulletin, June 29, 2011. 80 U.S. Geological Survey (USGS), “Rare earth element mines, deposits, and occurrences: Global Map,” n.d. (accessed March 17, 2021). 81 U.S. Geological Survey (USGS), “Rare earth element mines, deposits, and occurrences: Global Map,” n.d. (accessed March 17, 2021). 19 | www.usitc.gov
years between 2000 and 2018 estimated annual production was below 500 metric tons.82 However,
there is a growing interest in research and development of rare earth deposits in Brazil. In February
2021, Brazilian firm Brazil Minerals announced it had acquired the minerals rights for rare earths of
nearly 20,000 acres in northeastern Brazil.83 Although in very early stages of development, Brazil
Minerals has announced a longer term interest in investment and development of metals and minerals
for the “Green Energy Revolution,” including lithium and titanium, in addition to rare earths.84

Russia
Rounding out the top four countries for reserves, Russia contains an estimated 12 million metric tons of
REO equivalent, approximately 10 percent of global supply (and approximately eight times more than
estimated U.S. supply).85 These deposits are mostly concentrated in Siberia, along the Kola Peninsula, on
the northern edge of Lake Baikal, and in Russia’s Arctic region.86 These locations share difficult terrain
and weather conditions, and historically have made rare earths production in Russia challenging.87

Contemporary Russian production of rare earths is comparatively low (with an estimated 2,700 metric
tons of REE production annually in 2019 and 2020).88 During the Cold War, the Soviet Union was a
significant producer of REEs for its domestic market, due in part to an interest in extracting other
materials in deposits that contain rare earths (particularly uranium).89 However, with the fall of the
Soviet Union, rare earths production fell; although official statistics are inconsistent, in most years
production in Russia was estimated to be between 2,000 and 3,000 metric tons annually from 2000 to
2020.90

Some projects in Russia are in development, though the country’s mines have struggled with technical
capacity issues and financing difficulties. This includes the Tomtorskoye deposit north of the Sakha
Republic (with an eventual investor goal of 16,000 metric tons of REEs annually), and the Zashikhinskoye
deposit in the Irkutsk Oblast.91 The Tomtorskoye deposit, if successfully developed, could provide
promising returns for Russia’s REE mining capacity; by some estimates, the Tomtorskoye deposit is the
second largest single deposit of REEs in the world, after the Bayan Obo deposit in China (the principal
source of REE mining in China).92

82
   U.S. Geological Survey, “Rare Earths,” 2000–2021 editions (for full list of USGS Rare Earths reports, consult
bibliography).
83
   Yahoo Finance, “Brazil Minerals, Inc. Adds Large Rare Earths Project,” Newsfile Corp., February 9, 2021.
84
   Yahoo Finance, “Brazil Minerals, Inc. Adds Large Rare Earths Project,” Newsfile Corp., February 9, 2021.
85
   U.S. Geological Survey (USGS), “Rare earth element mines , deposits, and occurrences: Global Map,” n.d.
(accessed March 17, 2021).
86
   U.S. Geological Survey (USGS), “Rare earth element mines, deposits, and occurrences: Global Map,” n.d.
(accessed March 17, 2021).
87
   Cotting, Ashleigh, Toby Woodall, and Jose Miguel Fidel Javier, “Russia struggling to capitalize on rare earths
reserves,” SP Global, July 3, 2019.
88
   U.S. Geological Survey, “Rare Earths 2021,” January 2021.
89
   Mineral Prices, “Russia plans to become a global leader in rare earth metals production,” March 5, 2021.
90
   U.S. Geological Survey, “Rare Earths,” 2000–2021 editions (for full list of USGS Rare Earths reports, consult
bibliography).
91
   Cotting, Ashleigh, Toby Woodall, and Jose Miguel Fidel Javier, “Russia struggling to capitalize on rare earths
reserves,” SP Global, July 3, 2019.
92
   Cotting, Ashleigh, Toby Woodall, and Jose Miguel Fidel Javier, “Russia struggling to capitalize on rare earths
reserves,” SP Global, July 3, 2019.
In an effort to expand domestic capacity, in March 2021 the Russian government announced an
initiative to increase raw rare earths production. The new program, which foresees approximately
$4 billion in funding, would be jointly led by the Russian Ministry of Industry and Trade and the state
nuclear corporation Rosatom, and would fund the construction of 10 new plants to produce REE.93 In
addition to expected REE production of 7,000 metric tons by 2024 and 30,000 metric tons by 2030, this
initiative would also support the production of lithium, niobium, and tantalum.94 Although the focus of
these efforts would principally be to serve Russia’s domestic market initially, the extent of future
production could support REE exports to the global market.95

Decreased Consumption
Beyond REE supply, government agencies and firms are also reportedly looking at technologies that can
reduce REE demand. In Europe, several programs have been initiated to reduce rare earths use in
several industry sectors. The British firm GreenSpur Renewables developed the world’s first permanent
magnet synchronous generators using ferrite rather than rare earths.96 The German firm Enercon
developed a gearless design for wind turbines that does not require rare earths,97 while the EU-funded
EcoSwing project seeks to replace the permanent magnets used in machinery with superconductors that
reduce REE use by more than 95 percent.98

In the United States, some firms have begun investing in research to find alternatives to rare earths, or
to more efficiently use rare earths. For example, the University of Houston and Brookhaven National Lab
announced a 2016 research grant exploring the capacity to produce high-temperature superconductor
(HTS) magnets to replace permanent magnets used in wind turbines, which would reduce REE magnet
demand in wind turbines by over 95 percent (from more than 100 kilograms of neodymium and
dysprosium in certain NIB magnets to approximately 100 grams in HTS magnets).99 In another project,
researchers at Northeastern University developed iron-nickel alloys to replace neodymium and
dysprosium demand.100 Transitioning from rare earth lighting products to light-emitting diode
technology is a promising way to reduce REE use. One estimate reports that U.S. consumption of rare
earths per unit of manufactured products has fallen, but overall demand for REE products has risen,
contributing to higher overall demand).101

Both the wind turbine and automotive sectors have expressed interest in pursuing REE alternatives,
given their high consumption and increasing demand. One 2017 report found that alternatives to NIB

93
   Basov, Vladimir, “Russia plans to become a global leader in rare and rare earth metals production,” Kitco,
March 4, 2021.
94
   Basov, Vladimir, “Russia plans to become a global leader in rare and rare earth metals production,” Kitco,
March 4, 2021.
95
   Basov, Vladimir, “Russia plans to become a global leader in rare and rare earth metals production,” Kitco,
March 4, 2021.
96
   Sustainalytics, “Implications of the use of rare earth elements in the wind energy market,” July 11, 2019.
97
   Sustainalytics, “Implications of the use of rare earth elements in the wind energy market,” July 11, 2019; Dodd,
Jan, “Rethinking the use of rare earths elements,” WindPower Monthly, November 30, 2018.
98
   Sustainalytics, “Implications of the use of rare earth elements in the wind energy market,” July 11, 2019; Dodd,
Jan, “Rethinking the use of rare earths elements,” WindPower Monthly, November 30, 2018.
99
   Arpa, “Impact Sheet: University of Houston (REACT),” June 20, 2016.
100
    U.S. Department of Commerce, “A Federal Strategy to Ensure Secure and Reliable Supplies of Critical Minerals,”
January 2020, 18.
101
    King, Hobart, “REE Rare Earth Elements and Their Uses,” Geology.com, 2018.

21 | www.usitc.gov
You can also read