Part Two: Evaluating ASDA Solutions - Agile Demand-Supply Alignment: Responding to Demand Volatility
←
→
Page content transcription
If your browser does not render page correctly, please read the page content below

Agile Demand-Supply Alignment:

   Responding to Demand Volatility
        and Supply Disruptions
After Plans Are Set and Orders Placed

          Part Two:
 Evaluating ASDA Solutions

    By Bill McBeath
     January 2021

              © ChainLink Research 2021 – All Rights Reserved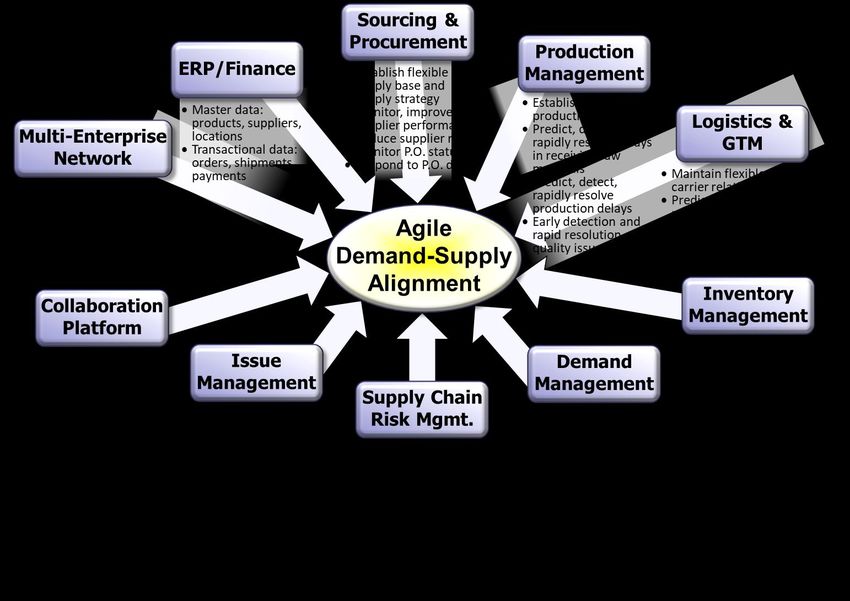
Table of Contents
What Problem(s) Are You Trying to Solve, Now and In the Future? ........................................ 1
Questions to Ask Solution Providers ...................................................................................... 3
  Data and Supply Chain Visibility—Getting the Complete Picture ............................................................. 3
  Detect, Contextualize, Prioritize—Finding the Needle(s) in the Haystack................................................ 4
          Scope of Issues Detected ........................................................................................................................ 4
          Prioritization Methodology and Capabilities........................................................................................... 5
          User Experience ...................................................................................................................................... 5
          Root Cause Analysis ................................................................................................................................ 5
  Predict and Prescribe—Receiving Early Warning, Quickly Finding Solutions ........................................... 6
  Multi-Enterprise Network Architecture—Foundation for ADSA and More.............................................. 6
          Visibility-only Control Tower vs. Supply Chain Application Network...................................................... 8
          On-Platform vs. Off-Platform Data and Intelligence ............................................................................... 9
          On-Platform vs. Off-Platform Optimization .......................................................................................... 10
  Functional Scope ..................................................................................................................................... 11
          ADSA Solutions Have Vastly Varying Functional Focus, Scope, and Internal Integration ..................... 11
          Sourcing and Supplier/Production Functionality .................................................................................. 11
          Quality Functionality ............................................................................................................................. 12
          Logistics and Global Trade Functionality ............................................................................................... 13
          Demand Management Functionality .................................................................................................... 14
          Collaboration Capabilities ..................................................................................................................... 16
  Analytics .................................................................................................................................................. 16
  Implementation, Services, Pricing, ROI, TCO .......................................................................................... 17
          Implementation—What Does it Take to Get Started? .......................................................................... 17
          Value-Add Services ................................................................................................................................ 18
          Solution Pricing ..................................................................................................................................... 20
          Financial Assessment and Comparison of SaaS Systems (ROI, TCO, et al) ............................................ 22
Evaluating Potential Solutions ............................................................................................. 23
  Discovering Potential Solutions .............................................................................................................. 23
  Shortlisting Potential Solutions ............................................................................................................... 23
          Industry Focus ....................................................................................................................................... 24
          Other Factors......................................................................................................................................... 24
  Selecting a Solution ................................................................................................................................. 25
          Requesting a Demo ............................................................................................................................... 25
          Due Diligence, Increasing the Chances of Success ................................................................................ 25

                                         © ChainLink Research 2021 – All Rights Reserved
Agile Demand-Supply Alignment: Part 2— Evaluating ASDA Solutions

This is Part Two of our research series on Agile Demand-Supply                         Acknowledgement
Alignment (ADSA). We define ADSA as “the capability to effectively        We are grateful for the support and par-
realign supply and demand, during execution, in the face of               ticipation of the Retail Value Chain Federa-
                                                                          tion and the National Retail Federation in
demand volatility and supply disruptions.” Regardless of how good
                                                                          making this research study possible.
companies get at planning, ‘stuff happens’ and companies then
need to be able to rapidly adjust to the evolving actual situation on the ground. Part One describes the phases of
supply chain planning and execution and lays out a framework for understanding the Elements of ADSA, as
shown in Figure 1 below. Part One also includes examples of specific ADSA capabilities, such as In-Season
Reordering, Agile Customer Mandate Compliance, and Opposite Hemispheres Strategy.

                                        Figure 1 - Elements of Agile Demand-Supply Alignment

Here in Part Two, we look at how to evaluate ADSA solutions, what questions to ask solution providers, and how
to shortlist providers.

What Problem(s) Are You Trying to Solve, Now and In the Future?
Agile Demand-Supply Alignment (ADSA) is not a category of software, per se—rather, it is a set of capabilities
(systems, processes, and practices) to better align demand and supply. Nevertheless, in this report we talk about
‘ADSA solutions,’ i.e., software and services that help companies achieve Agile Demand-Supply Alignment. Most
of these are not marketed or sold as standalone ADSA solutions,1 but rather the ADSA functionality they provide
is a portion of some broader set of functionality, that may be an ERP suite, or a supply chain suite, or some best-
of-breed software such as a sourcing and procurement system, quality, issues resolution, or demand
management/forecasting software.
Thereby, buying ADSA solutions is usually wrapped up within an initiative to buy one of these broader or more
focused enterprise software solutions. Users are often looking for solutions for their particular functional area,
such as a logistics manager buying a transportation management system or a demand planner seeking a better
forecasting system. These functional systems can help solve demand-supply mismatch because you need to

1
 One exception to this statement is ‘control towers’, an emerging category of solution. Control towers have been evolving and expanding
beyond the initial definition to include to more predictive and prescriptive platforms, and more integrated planning and execution. Agile
demand-supply alignment is one of the main purposes of control towers and their next generation iteration (sometimes called
autonomous supply chain platforms). We discuss this evolution more in the section below, Visibility-only Control Tower vs. Supply Chain
Application Network.

© 2021 ChainLink Research, All Rights Reserved.                                                                          Pg. 1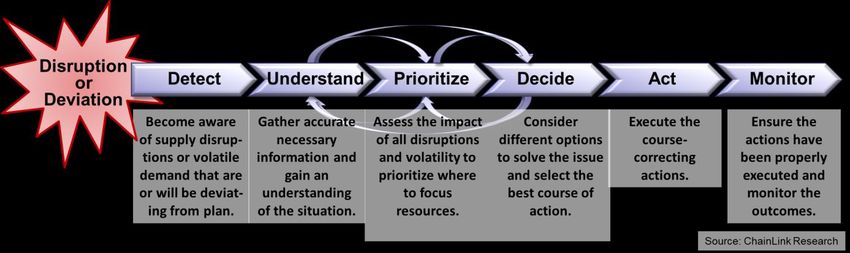
Agile Demand-Supply Alignment: Part 2— Evaluating ASDA Solutions

know when a shipment is delayed or how actual demand differs from the forecast. However, each of these
solutions only provides a piece of the puzzle. Supply chain processes are inherently cross-functional2 and inter-
enterprise so these systems should be integrated together to provide holistic situational awareness and identify
and execute a globally optimal response to issues that arise. To achieve an optimal response requires a holistic
platform that can see and execute actions across processes. Buying functional solutions without regard for how
they will be integrated into a holistic platform is shortsighted. When evaluating enterprise solutions, immediate
needs should be balanced with the longer-term needs and vision for the future.
Agile Demand-Supply Alignment encompasses a broad range of organizational functions, processes, and systems
across the enterprise and between trading partners, as shown in Figure 2 below. This is not just about the
technology; it includes the people, practices, and systems within each functional area. Ideally, an ADSA solution
integrates teams, data, workflows, and systems from across all these areas, incorporating trading partners and
third-party service providers (e.g., 3PLs, forwarders, etc.) as well.

                     Figure 2 - Many Organizational Functions and Systems Required to Achieve ADSA

2
 For example, a procure-to-pay process involves order management, supplier management, transportation management, inventory
management, global trade management, warehouse operations, and more.

© 2021 ChainLink Research, All Rights Reserved.                                                                  Pg. 2
Agile Demand-Supply Alignment: Part 2— Evaluating ASDA Solutions

Questions to Ask Solution Providers
Data and Supply Chain Visibility—Getting the Complete Picture
ADSA requires network-wide data about inventory, demand, supply, and logistics:
 • Inventory—An accurate and up-to-date picture
                                                                                      Data and Visibility
   of per-SKU, per-location inventory across the
                                                                        Potential Questions for Solution Providers:
   network. This starts with data feeds from a              • What data does your platform ingest to provide visibility? How
   company’s own perpetual inventory systems, for              is that data obtained (e.g., via EDI, supplier portal, API, XML,
   their factories, DCs, and stores. But it really             etc.)?
                                                            • Does your solution incorporate network-wide inventory (across
   should also include partners’ inventory, including          multiple tiers)? At what level of granularity and scope—down
   upstream finished goods inventory at suppliers’             to the SKU-location level? For which locations and entities?
                                                            • Does it incorporate forecast data? Near-real-time consumption
   locations, in-transit inventory in containers and
                                                               data?
   trucks, inventory at service partners such as            • Does it incorporate near real time order and production status?
   3PLs, and downstream inventory at channel                   What data is incorporated and how is that obtained; from what
                                                               sources?
   partners, retailers, and customers’ stocking             • Does it incorporate near real time logistics status? What
   locations. A broader network-wide picture is                granularity of status and what milestones are incorporated?
   harder to attain but provides a more complete               How is that data obtained?
                                                            • Which external systems (e.g., SAP, NetSuite), service providers
   picture of supply and enables finding many more             (e.g., 3PLs), and trading partners (e.g., Walmart) do you
   options for resolving shortages (such as using              provide pre-built connectors for? What is the effort required to
                                                               implement pre-built integrations?
   inventory from one dealer to fulfill demand at           • Do you integrate data from proprietary systems?
   another).                                                • How is all of this data presented and visualized?
 • Demand—At a minimum, a company’s own
   forecasts should be used to understand expected future demand. On top of that, demand sensing can help
   detect when there are changes in demand that are deviating from the forecast. Ideally, the solution helps
   enable a demand-driven supply chain, where visibility into end-user consumption and downstream3
   forecasts, consumption, and inventory data enable more accurate supply-chain-wide forecasting and
   execution. This is part of what CPFR was trying to accomplish. This turns out to be hard to do for a variety of
   reasons, so not many companies are able to pull it off. However, FMCG companies and some others are
   leveraging tools to pull together POS,4 syndicated retailer data, and other data, combined with analytics, to
   give them a demand sensing capability that incorporates end consumption. Demand sensing can include
   both the actual consumption information from the most downstream point possible (ideally end demand –
   such as POS or stock room withdrawals), as well as casual factors that have arisen that might not be
   considered by the traditional forecast tools (such as weather or major relevant events).
 • Supply—This starts with full visibility into all supply-side orders, including purchase orders and/or material
   releases being sent to suppliers, as well as work orders for internal manufacturing. The ability to track the
   status of an order throughout its lifecycle (issuance to receipt and payment) should include both production
   and shipment phases, thereby encompassing the logistics visibility described below as well. Ideally, there is
   visibility into product status at each stage, including knowing about delays in inbound raw materials to the

3
    Including visibility through multi-tiered distribution channels
4
    POS = Point-of-Sale

© 2021 ChainLink Research, All Rights Reserved.                                                                  Pg. 3
Agile Demand-Supply Alignment: Part 2— Evaluating ASDA Solutions
suppliers’ or your own factories. Most firms have some level of visibility into their own factories, but often
have poor visibility of the status of orders at suppliers’ factories. More broadly, it is valuable for the platform
to incorporate visibility into Industry-wide capacity constraints and material shortages, as well as disrupting
events, such as storms or political upheaval or pandemics, with insights into how those events will impact
supply for the company using the solution.
• Logistics—ADSA requires the ability to see the status of shipments correlated to the purchase orders, sales
orders, and stock transfer orders that the shipments are fulfilling. This includes seeing when shipments are
booked, tendered, and have passed various milestones on their journey such as ‘left factory’, ‘arrived at
consolidation center’, ‘loaded onto ship’, ‘departed origin port’, ‘cleared customs’, and so forth. More
advanced platforms will also ingest data to provide a more precise ETA,5 such as weather, port and road
congestion, and major events.
Understanding the sources, granularity, and accuracy/reliability of the data is important. For example, the
platform may show the date that the order is estimated to be shipped from the supplier’s factory. If that date is
based on the expected ship date stored in the buyer’s ERP system, it might be out-of-date and inaccurate by
days or even weeks, and not reflect the actual delays that have happened after the order was placed. At the
other extreme of advanced visibility, the supplier’s factory might be instrumented to automatically track each
production step, and that data automatically sent in near-real-time to the buyer’s supply chain visibility
platform. In that case, the buyer will have a highly accurate, granular, and up-to-date picture of the current
status of their order. They will know within hours, or even minutes, when a milestone has been missed and a
delay has occurred. Most implementations will be somewhere in-between those extremes. For example, a
common approach to supplier visibility is using a supplier portal, relying on the supplier to update the status of
their order in a timely manner.
Detect, Contextualize, Prioritize—Finding the Needle(s) in the Haystack
Collecting all this raw data in one place is not enough. To be effective, especially as supply chains grow larger
and more complex, the platform needs to continuously monitor and correlate those potentially massive flows of
data, to detect delays and disruptions to supply, as well as spotting when actual demand deviates from the
forecasted demand. These data should be put together, in context, to understand where there will be a
demand-supply imbalance that matters. Preferably the platform has enough intelligence to prioritize the
imbalances, so users can focus their attention on those imbalances that have the biggest impact. It should
predict future shortages and overages, and ideally prescribe resolutions to those problems. There is a lot to
unpack here in order to understand how a platform does all of that and know what questions to ask of the
solution provider.
Scope of Issues Detected
First is to understand what scope of disruptions and imbalances a platform is designed to detect or predict.
Some platforms focus primarily on supply chain disruptions. Others focus primarily on detecting demand
deviation. Others bring together forward-looking supply and demand analytics to predict imbalances (shortage
and overages).
5
ETA = Estimated Time-of-Arrival
© 2021 ChainLink Research, All Rights Reserved. Pg. 4Agile Demand-Supply Alignment: Part 2— Evaluating ASDA Solutions
Prioritization Methodology and Capabilities
Next is to ascertain how the platform prioritizes Detect, Contextualize, Prioritize
whatever issues it has detected. If the platform does Potential Questions for Solution Providers:
not prioritize the disruptions or deviations it • What kinds of supply disruptions, demand deviations,
shortages, and overages does the platform detect and predict?
discovers, then prioritization will have to be done
How does it do that?
manually.6 Understanding the prioritization • How does the platform prioritize different disruptions and
methodology and algorithms the platform uses is imbalances it has detected? What are the criteria or algorithms
used, and how are the priority issues displayed or presented to
important. For example, if the inbound supply is the user?
feeding the user’s own in-house factory, then it is • For each issue (demand/supply imbalance), what information is
brought together to help the user understand the situation?
important to know the production schedule for that
What UI paradigms, visualizations, and mechanisms are used to
in-house factory, in order to understand which navigate this information, such as map views, graphical supply
delays are most significant. A shipment of parts or chain flows, time-phased inventory-level diagrams, cost and
service level implications, and so forth?
materials may be running behind schedule, but if it is • What kind of root cause analysis capabilities does the system
still going to arrive in time for the production run it is have for diagnosing issues? Can it recognize common
scheduled for, then nothing special needs to be done bottlenecks or root causes across an aggregate set of
disruptions, such as congestion at a port or DC?
about it at this time. The delay of a different part
may cause a vital production run to be postponed and thereby shipments to a key client to miss a critical
promise date. The priority of that delayed part should therefore be elevated, and effort put to resolve it. The
platform should also present the cost and service level implications of disruptions and their potential
resolutions.
Those kinds of insights into relative priorities require that the platform not only detects the delay in the
shipment, but also understands how that shipment fits into the factory’s production schedule and customer
priorities. Not all platforms have the production schedule data and/or the intelligence to understand the
context, correlate it, and determine the impact on production. This same kind of context is needed across many
dimensions, such as whether or not a shipment will miss a sailing just because the truck is running late, how
much revenue or profit is at risk for a given delay, which customers are more important than others, and so
forth.
User Experience
Another thing to look at is how the system visualizes and organizes all that information—the UI paradigm used
to navigate (such as map views, graphical supply chain flows, time-phased inventory-level diagrams, and so
forth), diagnostic and analytic options it offers, and the workflow presented to find and weigh different potential
resolutions to the issue. The elements of the user experience make a huge difference in how productive users of
the system will be in identifying high-impact issues and quickly resolving them.
Root Cause Analysis
Some systems can analyze and highlight underlying root causes. For example, the system may notice that many
orders that are running late all flow through the same distribution center. It could then highlight that there is a
6 In any case, prioritization of the issues is required because there is not enough time, nor the need, to address every production delay,
late shipment, or surge in demand. If no prioritization is done, then members of an organization are in constant firefighting mode,
addressing whatever latest noisiest issue happens to land on their desk.
© 2021 ChainLink Research, All Rights Reserved. Pg. 5Agile Demand-Supply Alignment: Part 2— Evaluating ASDA Solutions
potential problem at that DC and, with the right information (possibly fed from the WMS system for that DC), it
might deduce that the facility is over capacity or having a problem with labor scheduling. By identifying the root
cause and addressing it (such as routing deliveries through alternative DCs and/or fixing the labor issue) many
individual delays are resolved all at once, rather than continuing to treat the symptoms and fixing problems one
at a time.
Predict and Prescribe—Receiving Early Warning, Quickly Finding Solutions
An emerging battleground for ADSA platforms is their
ability to predict disruptions and demand deviations Predictive and Prescriptive Capabilities
in advance, and their ability to prescribe effective Potential Questions for Solution Providers:
recommended actions to resolve the issues. • What kinds of predictions, if any, does the platform make? Can
it provide more precise ETA, predict production delays, predict
Predictive analytics uses advanced algorithms and
demand deviations?
AI/ML7 to look for patterns in the real-time data • What is the scope of these predictions? Does it cover multiple
received to provide much more accurate ETAs, tiers? Can it predict the cost and service level implications?
• How are these predictions made? Have you measured the
predict early or late deliveries, demand surges, accuracy of the predictions?
production delays, and various upstream supply and • Is the platform able to prescribe resolutions to demand-supply
downstream demand deviations across multiple imbalances? How does this work? Have you been able to
measure the effectiveness of prescribed actions?
tiers. AI/ML also learns from the actions taken for • Are multiple disruptions resolved simultaneously or are they
past issues. It looks at what worked in previous resolved one-at-a-time in a ranked way? Across what scope are
multiple disruptions simultaneously solved?
similar situations and prescribes the most effective
• How does the platform help users compare the expected
resolutions. The platform may present multiple outcome and impact of the different resolutions being
options for resolving an issue, ideally with a side-by- proposed by the platform?
side comparison of the impact of each option. This
impact analysis may include a time-phased view of the impact on inventory levels at specific locations in the
network. In some cases, a short out-of-stock situation may be tolerated for the sake of choosing a much less
expensive resolution option. Issues may be resolved to prioritize more strategic customers or to implement an
industry allocation approach across a segment.
Multi-Enterprise Network Architecture—Foundation for ADSA and More
The architecture and infrastructure a solution is built on determine a lot about what it can and cannot do. Most
of the systems we included in our research are architected as multi-enterprise platforms, but that is not the case
for most enterprise software. Most enterprise applications are architected for use within a single
enterprise, including virtually all major ERP systems and most best-of-breed applications. There is a big
difference between single-enterprise and multi-enterprise architectures in many areas such as:
• Shared ‘Single-Version-of-the-Truth’—The most central difference is where data is stored. In single
enterprise systems, each enterprise has their own copy of data and uses messages between trading partners
to keep those data in synch. For example, a buyer’s ERP system generates a PO which is sent to the supplier
and becomes a sales order in the supplier’s ERP system. Now there are two copies of the data
7 AI/ML = Artificial Intelligence/Machine Learning
© 2021 ChainLink Research, All Rights Reserved. Pg. 6Agile Demand-Supply Alignment: Part 2— Evaluating ASDA Solutions
about the same order. The process of exchanging data creates delays and errors.8 In a multi-enterprise
network system, there is a single copy of the data shared between everyone on the network, with
appropriate security controls so parties can only see data they are authorized to view. This means everyone
is looking at the same data. When the buyer
Multi-Enterprise Network Architecture
uploads a PO onto the network, there is now a Potential Questions for Solution Providers:
shared copy of that order that both the buyer • Does the architecture provide a shared single version of
and supplier use for execution. Depending on the truth for all parties on the network—a shared,
the scope of the multi-enterprise platform, a near-real-time view of demand and supply, including
inventories, orders, forecasts, shipments,
single-version-of-the-truth is also maintained for
manufacturing, and logistics?
data about inventory, demand forecasts, • How does the platform handle master data updates
logistics and shipment data, manufacturing from multiple enterprises and systems?
status, and so forth. Since this data is being used • What is the security architecture and how does it
to drive multi-enterprise execution, the accuracy handle multiple enterprises?
• What networks of trading partners are already on the
and timeliness of the data is critical. Ideally data platform? What are the tools, processes, and services
is near-real-time and there are quality check for onboarding new trading partners onto the network?
mechanisms in place. • Does the solution provider monitor and detect quality
issues for the data being passed back forth between
• Master Data Management—A multi-enterprise
trading partners? What kinds of problems can be
network needs to accommodate a much higher detected and what does the platform do once a
velocity of changes to master data, coming from problem is detected?
many different companies, with mechanisms to • What is the integration infrastructure? How are
internal systems and external trading partners
allow enterprise-specific variants, while still
integrated?
ensuring harmonization between the master • Is the platform capable of cross-functional and multi-
data coming from all the different enterprises on enterprise optimization, such as trading off the impact
the network. between transportation and warehouse labor and
inventory costs? Does it consider the tradeoff impact to
• Security—There must be mechanisms for data
all the different players in the supply chain? If so, how
owners to grant access rights based not just on a does that work?
person’s role, but also the trading partner
relationship (does the person work for a supplier, a customer, the government, etc.). This typically includes
the ability to grant administrator rights to someone within the trading partner organization, so that they can
do self-service onboarding and offboarding of users within their own company.
• Process Flows—Multi-enterprise platforms embody multi-enterprise processes and workflows which may
involve not only a buyer and seller, but also 3PLs, carriers, inspectors, banks, insurance companies, customs
agencies, and more. This will include partner-specific sub-workflows for each participating party.
• Network of Trading Partners—Multi-enterprise platforms often have pre-connected networks of trading
partners. Participants are typically onboarded on an as-needed basis, as each new customer brings their
trading partners (suppliers, customers, and service providers) onto the network. Often a trading partner
8
The delays mean each party has an out-of-date picture of what is happening. Errors cause incorrect execution and costly disputes about
what actually happened. These problems are especially acute when manual processes are used for sending transactions back and forth—
e.g., PDFs or spreadsheets are sent via email, with data entry on the receiving side. Even with EDI, there can be days of delays between
the time a transaction is entered in one system until it finally appears in the trading partner’s system.
© 2021 ChainLink Research, All Rights Reserved. Pg. 7Agile Demand-Supply Alignment: Part 2— Evaluating ASDA Solutions
network is concentrated in a particular industry. Most networks rely on customers to vet their own trading
partners, but some solution providers do vet, audit, and certify a subset of suppliers on the network.
• Onboarding—Network platforms need mechanisms to streamline onboarding9 of new trading partners to
the maximum extent possible.
• Data Quality—Transaction flows are the lifeblood of business activities between companies. Multi-
enterprise platforms should have the ability to monitor the quality, integrity, and timeliness of data flowing
through the platform to immediately correct malformed or missing data. This is described in more detail in
the section below, Data Management and Monitoring.
• Integration—The platform needs to integrate both existing internal applications, as well as trading partners
and their applications.
• Analytics & Optimization—Most existing optimization engines focus on a single functional area such as
transportation route optimization, manufacturing production optimization, inventory optimization, or
warehouse labor optimization. Multi-enterprise, network-level optimization is inherently different, as it
requires coming up with globally optimal answers, incorporating orders of magnitude more data. This is
needed to truly understand the network-wide tradeoffs and prescribe optimal resolutions to issues at
enormous scale and complexity.
This last point on cross-functional, multi-enterprise analytics and optimization is an important one in the context
of ADSA. Some form of analytics or intelligence is needed for almost everything an ADSA platform does,
including predicting future shortages and overages, prioritizing issues, prescribing resolutions, and comparing
the impacts of different disruptions and resolutions. This has implications for the platform architecture and
where functionality resides.
Visibility-only Control Tower vs. Supply Chain Application Network
Initial iterations of supply chain control tower technology were created to provide ‘end-to-end’ visibility across
functions and across a multiple-enterprise supply chain by being a central collection point for a wide array of
disparate information from many systems and sources. This data is then displayed in supply-chain-wide
dashboards, providing an overview of purchase orders, production, shipment, inventory, and in some cases
demand. A Visibility-Only Control Tower does not do any planning, optimization, or execution. It relies on other
existing systems to provide those functions. In contrast, a Supply-Chain Application Network has all the data
gathering and synthesizing capabilities of a control tower, but also has built-in capabilities to perform multi-
enterprise planning, optimization, and execution. Networked platforms are designed with the flexibility to allow
some of the functionality that they normally perform on the platform to instead be performed off-platform,10
thereby not forcing users to switch from their existing planning and execution systems that they already use.
9
For example, some platforms allow self-service onboarding to be integrated into an auto-generated email when the platform is sending
a document or transaction to the trading partner, such as an RFQ or an invoice. The trading partner clicks a link to do self-service
onboarding and the platform pre-fills as much information as possible. This way the trading partner is confirming rather than entering
data and the onboarding happens in a few minutes. The trading partner is motivated to complete the process at that moment in time
because they want to respond to that specific business request or transaction—i.e., they want to bid on the project or get paid.
10
Some platforms do this division of labor more elegantly, allowing more granular division of responsibility with legacy applications and
easier migration to the platform.
© 2021 ChainLink Research, All Rights Reserved. Pg. 8Agile Demand-Supply Alignment: Part 2— Evaluating ASDA Solutions
Type of Platform Main Purpose Integration/Data Source Embedded Functionality
Loosely integrated enterprise
Visibility-only Provide end-to-
applications (off-platform), trading Limited to visibility and simple alerts.
Control Tower end visibility.
partners, 3rd party sources.
Provide end-to- Tightly integrated, built-in on-platform Depends on the platform. Some focus
Supply Chain
end visibility, functionality and loosely integrated off- on production, others logistics/GTM,
Application
planning, and platform enterprise applications, demand/channel management, etc.
Network
execution. trading partners, 3rd party sources. or combinations of these.
Table 1 - Visibility-only Control Tower vs. Supply Chain Application Network
What’s in a Name?
This is not about whether a solution is called a Control Tower or not. Some platforms that have Control Tower
in their name have significant built-in planning and execution functionality. Some Supply Chain Application
Networks have a module within their suite that has control-tower-like functionality, which provides end-to-end
visibility, tightly integrated with their own planning and execution functionality, and the ability to integrate
external data. That module or capability may or may not be called a ‘Control Tower’ by the solution provider.
Pure visibility-only control towers have generally not succeeded in the marketplace—they have either evolved
to include some application functionality or have morphed into something else altogether. Those that survived
can map orders, shipments, suppliers, and parts together, and add other planning and execution functionality
and analytics to that data.
Rather than seeing a black and white distinction between visibility-only control towers and supply chain
application network, solutions can be viewed as sitting along a spectrum from having less to more functionality
and intelligence embedded in the platform. To understand this spectrum, it is useful to look at what data is
needed, what intelligence is needed, and where that data and intelligence resides.
On-Platform vs. Off-Platform Data and Intelligence
As described in Figure 2 - Many Organizational Functions and Systems Required to Achieve ADSA, data needs to
be ingested from many different sources. For data sources that are already built into the platform (i.e., data that
is part of the built-in planning and execution functionality), the integration is inherent, saving not only a lot of
upfront integration effort, but ongoing maintenance of those integrations. Reducing the number of external
integrations required increases the agility of the platform to evolve over time. For data sources that are
external, the amount of integration effort, cost, and time required depends on the extent and nature of pre-
built connectors available.11
Once the platform has the data, it can detect disruptions and deviations, but in order to prioritize those, it needs
context. For example, to prioritize disruptions to materials flowing into a factory, the platform may need to
11
We are seeing three different levels of data integration for these platforms, with many platforms providing some hybrid combination
of these: 1) the data is internal because it is part of the planning and execution application functionality of the platform, 2) the platform
has pre-built connectors and data models to get external data, and 3) the platform does not have pre-built connectors but has
mechanisms for creating new integrations to external data. For #1, there is no integration work required as the data already exists in the
system. For #2, there is some integration work required (setting up and testing connections), but it is a relatively modest effort, and you
can reasonably expect the vendor to update the mappings when the destination data changes. For #3, there is a significant amount of
upfront work required to get a new integration to work and the user’s IT group is on the hook for maintaining that integration, which
entails a lot of ongoing investment, unless the solution provider explicitly agrees to take on that responsibility (usually for a non-trivial
fee).
© 2021 ChainLink Research, All Rights Reserved. Pg. 9Agile Demand-Supply Alignment: Part 2— Evaluating ASDA Solutions know the production schedule and deadlines at that factory, which customer orders and revenue are dependent on each production run impacted by the delay, the value of those orders and potentially the lifetime value of each customer, options for rescheduling production, and so forth. Trying to bring in all that data and build the intelligence to understand it is daunting, due to the variety of semantics and the depth of logic needed to interpret it. The platform would be practically replicating much of the intelligence and logic already embedded in the external production planning and execution systems it is pulling the data from. A visibility-only control tower, which does not have any planning and execution functionality, does not inherently have the built-in intelligence and context required to prioritize and optimize. That doesn’t mean such a platform cannot do any prioritization. With the right engineering effort by those solution providers, some simpler prioritization can be accomplished by pulling in the right data, provided the platform understands the semantics/meaning of the data and has ensured it is pulling in the right data from the source systems, normalizing the values properly, and interpreting it correctly for the purpose. However, the scope and sophistication of prioritization and optimization that can be done by a visibility-only control tower is significantly constrained by the challenges inherent in doing all of the ‘reverse engineering’ work required and the lack of standard ways of expressing things like customer priority or lifetime value of a customer or production schedules. Thus, as a generalization, the less built-in planning and execution a platform has, the more rudimentary will be any prioritization or optimization it is able to provide. In contrast, a platform that has rich planning and execution capabilities built in, inherently has the intelligence that can serve as a foundation to contextualize and prioritize the issues that arise. On-Platform vs. Off-Platform Optimization Once issues have been detected and prioritized, they need to be resolved. The ultimate goal is for AI/ML to prescribe the optimal course of action. Several solution providers have started down that path, though we are still early on that journey. Some platforms provide useful approaches that do not involve AI/ML-generated resolutions. For example, they may gather information to show the user alternate sources of existing inventory, alternate suppliers, expediting options and costs, tools to invite suppliers to collaborate on a solution, and so forth. Saving the user the grunt work of finding, gathering, and organizing all that information, and making it easy and convenient to convene a team of co-workers and partners to resolve the issues—these are huge productivity boosters. Still, a more powerful approach is when the platform does the optimization work required to recommend the best resolutions. This enables supply chain professionals to make smarter, faster, more strategic decisions. Organizations often already have very capable optimization engines running within best-of-breed applications such as within their existing TMS, WMS, production, and inventory optimization applications. However, these engines only optimize within their own domain. ADSA requires global optimization, where multiple optimization engines12 iterate collectively to find the best overall solution, across functions and enterprises. The vast majority of best-of-breed optimization engines are not designed to iteratively cooperate with other function-specific optimization engines to mutually analyze the tradeoffs. Some solution providers are building exactly that 12 In theory, a solution provider could build a single cross-functional, multi-enterprise optimization engine that works on an entire end-to- end supply chain model, but we know of no provider taking that kind of monolithic approach. © 2021 ChainLink Research, All Rights Reserved. Pg. 10
Agile Demand-Supply Alignment: Part 2— Evaluating ASDA Solutions

capability into their supply chain application network—the ability to iteratively optimize across multiple
different functions and enterprise nodes to discover globally optimal solutions.

Functional Scope
ADSA Solutions Have Vastly Varying Functional Focus, Scope, and Internal Integration
The functional focus and scope of ADSA solutions                                      Functionality
varies widely. Some focus on supplier and                               Potential Questions for Solution Providers:
production management, others are logistics-centric,         • What is the primary purpose of the solution? What problem(s)
while others focus on monitoring downstream end-               is it trying to solve?
                                                             • What portion of the solution functionality was acquired and
point consumption. Some solution providers offer a             what portion was developed in-house? What is the approach to
complete suite of supply chain applications for                integration for the acquired functionality?
                                                             • What sourcing and procurement functionality, if any, is
planning and execution, while others are ERP                   included?
companies that happen to offer ADSA-related                  • What outsourced production management functionality is
solutions. Assessing the functional scope and                  included? How is production status tracked?
                                                             • Is there any quality management functionality included? How
integration of the solution provider is important.             are product quality issues addressed?
Even when seeking a solution for a specific problem,         • What logistics/transportation functionality is included?
it is wise to step back and look at the bigger and           • Is any global trade management functionality included?
                                                             • Are there capabilities for full traceability and chain-of-custody?
longer-term picture, considering what else the               • What is the scope of demand-side visibility, if any? Does the
solution provider and their platform have to offer             platform ingest forecasts, the user company’s own inventory,
                                                               channel inventory, channel consumption, and endpoint
and how well integrated the platform and its                   consumption (such as retailer POS data, or stockroom
components are.                                                withdrawals)?
                                                             • Are demand forecasting or demand sensing capabilities
Some providers have grown by acquiring best-of-                included?
breed applications while others have built most of           • Does the platform support omnichannel business models,
                                                               including ecommerce, physical store, consumer-direct, and
their capabilities inhouse. In general, solutions that         distributor models?
are entirely or mostly developed inhouse will be             • Does that platform provide time-phased views of predicted
better integrated with a more seamless workflow                shortages and overages? If so, how are those presented and
                                                               what data goes into those predictions?
than those consisting of stitched-together acquired
                                                          • What collaboration tools are provided and how do they work?
applications. However, amongst solutions that have
grown by acquisition there are big differences in how well integrated the applications are. Some have become
quite good at integrating the data, user interface, and processes of acquired applications. Some have even
rewritten acquired applications from scratch, essentially building an in-house developed application that
incorporates the domain knowledge and functionality learned from the acquired application.

Sourcing and Supplier/Production Functionality
Some solutions provide no visibility into the status of production at the supplier’s factories while others provide
extensive, granular, near-real-time visibility, including visibility into the ordering and receipt of raw materials at
the supplier’s factory, granular updates on work-in-progress steps, finished goods inventory movements, and
packing and shipping activities at the factory. This is often accomplished via a supplier portal, but some
platforms also allow instrumentation of the supplier’s factory, such as the use of RFID tags to track materials and

© 2021 ChainLink Research, All Rights Reserved.                                                                  Pg. 11
Agile Demand-Supply Alignment: Part 2— Evaluating ASDA Solutions processing steps at the supplier. The more capable platforms can often provide alerts when raw materials are late or individual process steps have fallen behind schedule. There is also wide variation in supplier-enablement tools provided by platforms. Many (but not all) ADSA solutions have some sort of supplier portal and/or EDI capabilities to let suppliers negotiate and accept purchase orders, update production status, request pickups/book shipments, issue invoices, and in some cases receive payments. This may include sophisticated transportation management tools for suppliers. For example, one platform we reviewed lets suppliers create requests for transportation for order lines ready to ship from their origin. An automated scheduled job can be run on an optimization engine that looks across multiple of these requests, considering carrier options, lanes, legs, service level, equipment type, transit time, rates, and mode constraints to find the least cost, best service level option respecting promised delivery dates on each order. While this may not strictly speaking be ADSA functionality, it is an example of the kind of additional, closely related functionality some ADSA platforms may provide, which will be part of the overall consideration of which platform best serves a set of needs. Some platforms provide various supplier compliance tools, such as enforcing the packing requirements outlined in a P.O. by calculating carton weights & measurements, as well as enforcing the actual packing of the physical product during the packing process. Platforms that let suppliers request transportation may improve compliance by using the buyer’s enterprise’s routing guides and allocations, with routing guide rules and desired outcomes configured on the platform. Some platforms provide sourcing and procurement tools, such as supplier discovery, RFQ management, contract management, PO management, invoice reconciliation, and payments/settlement. Advanced ADSA platforms allow suppliers and their customers to collaborate on orders, shipments, transportation, inventories, forecasts, and plans on a single network-based platform. Quality Functionality Supply disruptions and delays are sometimes caused by quality issues at the supplier. The timeliness with which quality issues are identified and mitigated has a huge effect on the financial impact of the quality problem. It is strongly preferred for suppliers to have robust quality processes and systems that catch problems before any components have been shipped, rather than after the component has been received and assembled into a finished good, or in the worst case already shipped to customers. Problems discovered at these latter stages can be hundreds or thousands of times more expensive to correct than if those same problems were resolved early on. Some ADSA platforms include tools to help detect, identify, track, and resolve quality issues. These include a wide range of capabilities from direct connections into the suppliers’ MES systems to mobile quality applications for use by suppliers’ and buyers’ quality personnel to enter and track quality and compliance activities, capture and document quality defects on the factory floor, including sample photos, and upload that documentation for sharing and collaborative resolution. Some have approval and escalation workflows, as well as root cause analysis tools. Some let customers configure custom milestones for tracking such as when inventory is put on hold and quarantined, root cause discovered, fix proposed, fix tested and approved, fix implemented, material © 2021 ChainLink Research, All Rights Reserved. Pg. 12
Agile Demand-Supply Alignment: Part 2— Evaluating ASDA Solutions

taken off hold, and so forth. Others have serial number and/or lot-level traceability capabilities to trace the
origin and chain-of-custody handoffs for any ingredient, product, lot, or batch, as well as identify quality
violations during transport such as temperature excursions for the food or pharmaceutical cold chains. This
traceability can help in managing recalls, including commonality analysis algorithms to identify common points
of failure and the associated lots.

Logistics and Global Trade Functionality
There is wide variation in the degree and granularity of logistics visibility and functionality included. Most
platforms provide a basic ETA13 and many can ingest EDI data from LSPs or carriers with updates throughout the
journey, though these data can be delayed by one to two days, or more. Less commonly, some platforms ingest
IoT/GPS data or updates from one of the tracking networks,14 to provide a near-real-time view of where the
vessel or vehicle is, and thereby a more dynamic ETA. The more sophisticated platforms use AI/ML to factor in
other elements, such as weather, traffic, port congestion, and major events (e.g., conventions or sporting
events) to develop a more precise dynamic ETA. This is an area of competition that many solution providers are
investing in—trying to provide more precise dynamic ETAs, providing more advanced and reliable warnings
about delays—and there is still room for a lot of improvement. More advanced and reliable warnings of late
arrivals enable a broader range of mitigation options.

Beyond precise ETA, ADSA solutions offer a wide variety of logistics management functionality. Some offer full
suites of tools such as RFQ and spot bids, contract management, booking tools, load boards and freight-
matching marketplaces, rating, freight invoicing and payment, and freight audit tools. Some providers offer
Global Trade Management (GTM) functionality with regulatory export and import compliance and transactional
functions. GTM functionality may include automated harmonization code classification, country customs
controls, restricted party screening, license determination and tracking, automated document generation, and
automated filing with various government systems.15

Less commonly, a few providers offer Container Freight Station (CFS) functionality, such as receiving,
comparison of receipts against Shipping Orders and FCRs,16 consolidating shipping orders, transportation/
shipping plan creation and approval workflow, and so forth. These can be used to run a cross-dock or transload
facility while providing visibility to the inventory passing through. This added visibility can help provide more
precision in the end-to-end tracking of goods and notifications when things are running late. A sophisticated CFS
system can provide capabilities to modify in-transit shipment plans, such as changing the destination to a
location that has a critical shortage, to help deal with demand-supply misalignments.

13
   ETAs (Estimated Time of Arrival) are often based on an estimate from the forwarder or carrier, which is typically just the average transit
time plus some buffer of time so that most trips arrive on time or early. A static ETA does not reflect any updates during the trip as
conditions change.
14
   There are a number of increasingly capable transportation tracking services that combine data from many sources to provide updates
on the status and location of in-transit shipments. Examples include MacroPoint, FourKites, Project44, and MobileSTAR.
15
   Some solutions interface with various customs and border control agencies’ electronic interfaces for automatic filing such as US AES,
US ACE, US ISF, US FTZ, DE ATLAS Export, BE PLDA Import & Export, CN GAC (CTM), and others.
16
   FCR = Forwarder’s Cargo Receipt, aka FIATA Certificate of Receipt

© 2021 ChainLink Research, All Rights Reserved.                                                                            Pg. 13
Agile Demand-Supply Alignment: Part 2— Evaluating ASDA Solutions

Demand Management Functionality
Scope of Demand-Side Visibility
Some ADSA systems focus exclusively on supply side disruptions and do not consider demand side data at all.
Others ingest forecasts, but do not monitor actual consumption. Solutions with the most complete demand-side
visibility monitor end-point consumption, as well as inventory at all downstream tiers between the enterprise to
the end consumer.

                    Figure 3 - Different Solutions Provide Different Scope of Demand-Side Visibility

As shown above, a solution that includes downstream inventory and end-customer consumption provides a
picture that more closely matches the reality on the ground and is more complete and up to date than ones that
only look at the forecast or sales/deliveries to the immediate customer. The higher up this demand-side visibility
stack a solution is, the more precise and earlier are the warnings of shortages and outages it can provide.

Time-Phased Views, Simplifying High-SKU Large-Network Visualization
Some of the systems will display a forward-looking time-phased view, making it easier to visualize which SKUs
will run out or have excess, including when that will happen and how large and prolonged the imbalance will be.
Visualization is trickier when there are thousands of SKUs and hundreds of locations across the network,
creating potentially millions of SKU-location combinations. An excellent UI/UX design is required to help the user
to easily monitor those millions of combinations, aggregating the related ones and bringing the most important
ones to the top. A good UI helps the user intuitively navigate the data and find the required information to
resolve the issues. This is one of the areas where various ADSA platforms tend to be differentiated. That is why it
is important to get demos of scenarios with high-SKU/location counts within large, complex network settings to
evaluate the platform’s UI/UX’s ability to make those scenarios manageable.

© 2021 ChainLink Research, All Rights Reserved.                                                        Pg. 14
Agile Demand-Supply Alignment: Part 2— Evaluating ASDA Solutions POS and Channel Data Visibility The ability for a supplier to obtain and use retailers’ POS data is not trivial in either the value it brings, or the effort required to realize those capabilities. Services such as IRI and Nielsen syndicate data from multiple retailers, but that data is not as timely or granular as getting daily POS data directly from retailers. Two of the solution providers we reviewed provide services and systems to obtain retailer’s POS data, cleanse it, format it, and bring it into a common canonical data structure so that it can be used in ADSA processes. Another specialized area is channel inventory data. This is frequently a blind spot for manufacturers selling through distribution channels. Only one solution provider amongst those we reviewed has the capabilities and preconnected network of channel partners required to provide channel inventory visibility off-the-shelf. Order Pegging Some platforms provide the ability to peg available supply (purchase orders, inbound shipments, and on-hand inventory) to demand (customer orders and/or store or DC locations replenishment).17 This lets users know ahead of time how many unallocated units there are in each stage of the pipeline. As soon as units get allocated to an outbound customer order or to a specific location and purpose,18 those units are no longer available for a different customer (unless due to significantly higher priority of the new order, the units are reallocated and 'taken away' from the first customer’s order or location’s allocation). Demand Sensing Some solution providers offer forecasting and demand sensing capabilities. Demand sensing is particularly relevant to ADSA as it provides a more accurate short-term prediction of demand, incorporating a variety of casual factors such as weather, competitor’s actions, and other events. Demand sensing thereby helps better predict when demand will deviate from the plan which makes the time-phased views of future overages and stockouts more accurate. Some solutions also have specialized demand capabilities, such as managing limited time offers (LTO) for the restaurant and food service industries and the impact on the supply chain of associated promotional programs. Retail Planning Capabilities Some platforms support Open-to-Buy and/or WSSI19 planning capabilities, which helps ensuring demand-supply alignment. A few have deep retail suites, including capabilities such as category management, assortment planning, allocation and replenishment, promotion planning and execution, and product transition planning and execution. These tools all play a role in keeping demand and supply balanced, which is particularly challenging for retailers trying to get the right inventory levels for a mix of size, color, and style at each location across a large and diverse network of stores and ecommerce fulfillment centers. 17 For example, if a brand owner gets three orders from different retailers for 1,000, 5,000, and 10,000 of a specific item, and the brand owner has 5,000 at their DC, 5,000 in transit, and 5.000 on order (in production at their supplier), they could allocate those units against the orders, based on expected receive dates and the priority of each retailer. In this hypothetical scenario, the brand owner would still be 1,000 units short as the total on order (PO to supplier), inbound, and on-hand is 15,000, whereas the orders from the brand owner’s customers total 16,000 units. 18 Such as anticipated replenishment for an ecommerce DC or store location. 19 WSSI = Weekly Sales, Stock, and Intake, a process whereby retailers monitor actual consumption and perform planning to ensure the right inventory will be in stock. © 2021 ChainLink Research, All Rights Reserved. Pg. 15
You can also read


