A Big Data Platform for Real Time Analysis of Signs of Depression in Social Media - MDPI
←
→
Page content transcription
If your browser does not render page correctly, please read the page content below
International Journal of
           Environmental Research
           and Public Health

Article
A Big Data Platform for Real Time Analysis of Signs
of Depression in Social Media
Rodrigo Martínez-Castaño * , Juan C. Pichel                      and David E. Losada *
 Centro Singular de Investigación en Tecnoloxías Intelixentes (CiTIUS), Universidade de Santiago de Compostela,
 15705 Santiago de Compostela, Spain; juancarlos.pichel@usc.es
 * Correspondence: rodrigo.martinez@usc.es (R.M.-C.); david.losada@usc.es (D.E.L.)

 Received: 28 May 2020; Accepted: 25 June 2020; Published: 1 July 2020

 Abstract: In this paper we propose a scalable platform for real-time processing of Social Media data.
 The platform ingests huge amounts of contents, such as Social Media posts or comments, and can
 support Public Health surveillance tasks. The processing and analytical needs of multiple screening
 tasks can easily be handled by incorporating user-defined execution graphs. The design is modular
 and supports different processing elements, such as crawlers to extract relevant contents or classifiers
 to categorise Social Media. We describe here an implementation of a use case built on the platform
 that monitors Social Media users and detects early signs of depression.

 Keywords: Social Media; text mining; depression; public health surveillance; stream processing;
 real-time processing

1. Introduction
     In recent years, the impact of Social Media (SM) on public health aspects has received increasingly
more attention. This paper focuses on the technological challenges related to the construction of
effective and scalable systems able to support Social Media Intelligence tasks. Although our approach
is general and the system can assist different surveillance tasks, we concentrate here on showing its
potential for early detecting signs of depression.
     Computational methods for screening Social Media and supporting mental state assessments is a
thriving area of research. Many SM users publicly share their feelings and emotions. The availability
of large samples of user-generated contents provides a unique opportunity for designing health
surveillance tools that proactively analyse signs of mental disorders such as anxiety or depression.
Such online screening tools are valuable and might act in the future as a complement to more standard
assessment strategies.
     The impact and prevalence of common mental disorders, such as depression, is severe. In January
2020, the World Health Organisation (WHO) estimated that, globally, more than 264 million people of
all ages suffer from depression (https://www.who.int/news-room/fact-sheets/detail/depression).
The burden of depression is on the rise and it is a major cause of disability worldwide. Although there
are effective treatments for depression, a large percentage of people receive no treatment for their
disorder. WHO states that inaccurate assessment is a barrier to effective care. Most computer-based
analytical tools focus on structured clinical data [1]. We follow here a different route and claim that
innovative online screening methods can advance in early detecting cases of depression.
     Lack of early detection of depression might lead to serious health consequences, such as disability,
psychotic episodes and even suicide. It is crucial to identify the onset of mental disorders at early
stages and develop appropriate psychological intervention strategies.
     SM data provide substantive evidence about the behaviour and mental state of people. Popular
SM platforms, such as Twitter or Reddit, have millions of users worldwide and receive huge amounts

Int. J. Environ. Res. Public Health 2020, 17, 4752; doi:10.3390/ijerph17134752           www.mdpi.com/journal/ijerph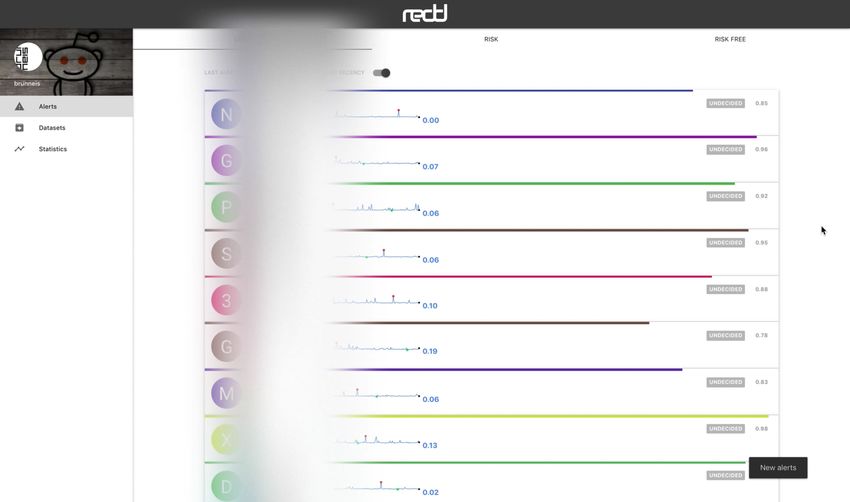
Int. J. Environ. Res. Public Health 2020, 17, 4752                                                   2 of 23

of publications per minute. These vast repositories of user-generated text give us an opportunity
to design new SM tools that analyse texts and extract signs or symptoms related to the onset of
depression. As argued by [2], SM analytics is promising in the mental health domain because popular
SM sites provide access to naturalistic, first person accounts of people’s behaviour, thoughts, and
feelings. SM evidence can therefore supply valuable indicators related to the emotional well-being of
the individuals.
     There is evidence that people increasingly turn to online platforms to share their moods, thoughts
and feelings [3–8]. There are a variety of reasons for individuals to publicly disclose information about
their personal concerns and mental state [3]. This includes seeking or offering support, and fighting
the stigma of mental disorders.
     Automatic extraction of well-known symptoms of depression (e.g., guilt, sadness or pessimism)
might be done from SM data, leading to new forms for the screening of this mental disorder. The words
or expressions that people use can be revelatory of their psychological states. A large stream of
studies have engaged in the psychological aspects of natural language use [9–11]. Explicit and implicit
factors, including subtleties in the linguistic styles of the individuals, can link text to a wide array of
dimensions, such as personality, psychological state, and social and situational fluctuations, just to
name a few. For example, textual (or content-based) features can act as markers of personality [12,13],
psychological state [9,14], personal values [15], or can even inform about drug effects [16].
     The use of SM data to design novel intelligent tools for public health surveillance is therefore a
real possibility. By leveraging online data we can assist health experts (or other stakeholders involved
in public health surveillance) in screening communities or specific individuals at-risk. Large-scale
analysis of SM data offers low-cost and non-intrusive methods that, following proper ethical guidelines,
could be employed by health institutions [17]. However, the large volume of SM users and contents
demands new technological solutions that support real-time text mining of health-related pieces of
evidence. This is precisely the main aim of this paper.
     There are many technologies designed for massive data processing. Some of them are open source
and, thus, research teams or institutions can freely adopt them for public health surveillance. However,
as shown in this paper, they have limited scalability. We contribute here with a library that naturally
eases the development of applications that process massive amounts of stream data. SM sites are
environments where millions of users produce contents in real-time. Our library can support the
construction of new SM intelligence tools to analyse the onset of psychological problems. As a matter
of fact, we present here a use case of the library where we built a depression analysis tool. The tool
exploits existing labelled depression data [18] for monitoring in real-time the appearance of signs
related to depression. Related to this, we build an automatic classifier that scans the thread of posts and
comments sent by users to a popular SM platform and predicts the occurrence of signs of depression.
     The rest of the paper is structured as follows. Section 2 puts this research in context by briefly
introducing stream processing technologies and their main characteristics. Section 3 presents our
Python library that facilitates the construction of execution graphs. Section 4 develops a use case
where we build an early risk detection system that is connected to SM data and alerts about signs
of depression. Section 5 explains how systems developed using other programming languages can
be connected to our execution graph. In Section 6, we compare our solution with other Big Data
technologies. Finally, Section 8 presents the main conclusions of this study and suggests lines of future
work.

2. Stream Processing Technologies
     Existing solutions for massive data processing work with clusters of computers and typically
focus on horizontal scalability. This means that more tasks can be performed by incorporating more
similar nodes to the cluster. For example, in SM, if we are processing users and the cluster becomes
exhausted then we can add new nodes to the cluster, resulting in a proportional increase of the number
of users that can be monitored. An important advantage of this approach is that the new nodes do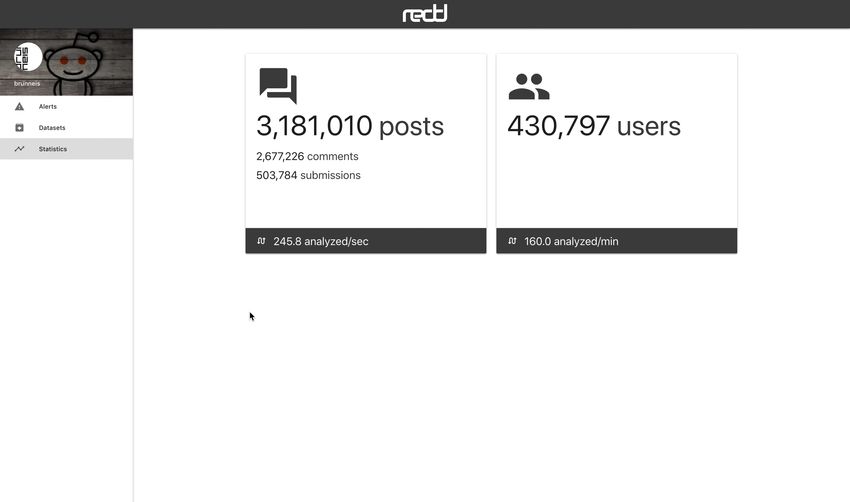
Int. J. Environ. Res. Public Health 2020, 17, 4752                                                 3 of 23

not need to be more powerful than the existing ones. Horizontal scalability requires that the data
can be partitioned. Different data items are processed by different processes that are distributed on
the cluster’s nodes and, therefore, run in parallel. At some point, partial results can be merged or
aggregated to generate final results. Many data processing frameworks follow this paradigm now,
democratising its use through commodity hardware.
      Batch and stream are the two main classes of processing technologies. When using batch,
the results are obtained after processing a full batch of data. An execution graph is responsible for
performing the computation. The graph defines the path to be followed by the data and it is composed
of a series of nodes or stages (e.g., filters or transformers that are applied to the data items). Each
computer in a cluster receives partitions of the input data and executes one or more instances of the
entire graph. When there is a sequential dependency among stages, individual results are delayed
since the subsequent stages are not started until the previous ones are completed. With stream
processing, the stages of an execution graph are not dependant of a global instance of it and the
data flow through all the stages without locks until all the items are processed in the previous ones.
Such an approach is appropriate for designing real-time applications because independent results are
obtained as soon as data items complete their path through the execution graph. Since the processing
stages are independent and there aren’t fixed partitions of the input data, stages can be scaled out by
launching new instances even when the application is already running. Furthermore, given new data,
the execution graph does not need to be relaunched since the instances of each stage of the execution
graph are constantly waiting for new input data.
      Most applications need to define processing stages whose computational requirements show
a high variance. For example, a word filtering stage (e.g., remove common words from an online
publication) might be substantially quicker than a summarisation stage (produce an abstractive or
extractive summary of the publication). The wide range of computational needs can naturally be
handled by assigning more resources to heavier modules and, thus, balancing the execution times of
different stages.
      In SM analytics, multiple use cases require Information Retrieval and Text Mining techniques
and can take advantage of stream processing. For example, monitoring user data and analysing the
onset of signs of depression for Public Health surveillance needs to work in real time. In this way, the
resulting automatic screening tools can quickly alert about users at risk and take appropriate preventive
measures. Furthermore, this type of SM intelligence tools have easily identifiable stages, associated
to different processing steps. Data should follow one or several paths through the execution graph
because a module could output data to multiple modules (or receive input from multiple modules).
Two common stages are data extraction, which often runs at the beginning of the execution graph, and
storage, which often runs at the end of the execution graph and is responsible for storing results. By
designing an execution graph that incorporates the proper stages, we can implement multiple text
analytics and mining processes on stream data. For example, we can support Real-Time Filtering (with
a filtering stage that removes non-relevant contents), Real-Time Summarisation (with proper filtering
and summarisation stages), Real-Time Clustering (grouping users or contents based on similarity and
assigning them to clusters in real-time), Real-Time User Classification (categorising users based on
predefined classes), and Real-Time Trend Detection (detecting new events), just to name a few.
      In this paper, we make two main contributions. First, we present C ATENAE (https://github.
com/catenae), a publicly available framework that facilitates the design of real-time applications
that need to process stream data, such as SM publications. In Figure 1 we sketch an example of an
execution graph, which is represented in the form of a directed graph. The nodes in the graph represent
elements of filtering or data transformation, while the edges represent how data flows from one node
to another. The example shows that a node can be connected to several nodes (the output of one
node connected to several nodes, or the input of one node connected to several nodes). It is possible
to create cycles because the data can be sent to a previous stage. This cyclical feature is useful, for
example, when a temporal condition is not met and we need to redirect the data to a previous stage. A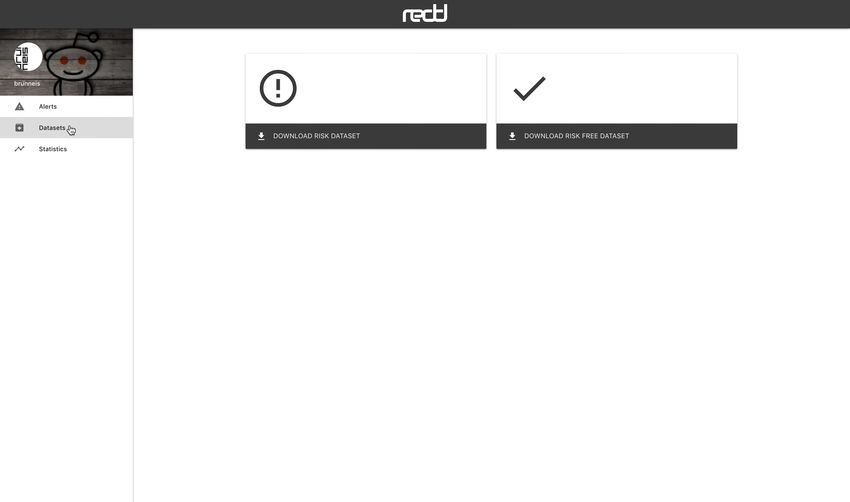
Int. J. Environ. Res. Public Health 2020, 17, 4752                                                                 4 of 23

second contribution of this study is to build a user classifier that categorises SM users and estimates
the presence of signs of depression. This classifier can be naturally incorporated as a processing
element in C ATENAE and this incorporation leads to a use case of the platform to support public health
surveillance.

3. Catenae Topologies
     An important component of execution graphs is the way in which nodes communicate with each
other. In our library, communication is handled by queues of messages that are managed by Apache
Kafka [19]. As argued above, if the workload of some processing element or node becomes too high
then the node can be replicated. This ability to create multiple instances prevents the execution graph
from experiencing bottlenecks. Batch processing solutions assign hardware resources to the entire
execution graph, while C ATENAE assigns resources to node instances as required.
     In the following, the nodes or stages of the graph will be referred to as microservices. In C ATENAE,
microservices are tiny and loosely couple scripts written in Python and packaged into Docker
containers. This processing technology can quickly scale up or down by launching or stopping
instances of the microservices.
                                         SOURCE                                       SOURCE

                                        MICROSERVICE                                 MICROSERVICE

                                                        MIDDLE         MIDDLE                        MIDDLE

                                                       MICROSERVICE   MICROSERVICE                  MICROSERVICE

                                                         LEAF                          LEAF

                                                       MICROSERVICE                  MICROSERVICE

                                   Figure 1. Example of an execution graph in C ATENAE.

      There are three main classes of microservices in C ATENAE:

•      Source microservices. These microservices are responsible for collecting data from external
       sources, such as API services, access to databases or web crawlers. For example, connecting the
       execution graph to a stream source, such as a SM site, requires to define a source microservice
       that reads from the SM’s API or constantly crawls the site. This class of microservices does not
       receive data from other nodes and, thus, does not get input from Kafka.
•      Middle microservices. These microservices receive data from other modules, make some sort
       of transformation or filtering, and emit data to other modules. For example, filters or classifiers
       constantly consume and emit data and can be developed in a very simple way. To further prove
       this point, Figure 2 shows how to code a simple filter in C ATENAE. The Python class works from
       a set of allowed tokens (e.g., pre-defined keywords) and only those texts that have some of the
       allowed tokens are passed to the next stage.
•      Leaf microservices. These microservices consume data from other nodes but do not send data
       back to the execution graph. They are responsible for storing results (for example, by writing on
       a database or generating an output file). When monitoring SM data, an instance of the execution
       graph can contain a leaf node that generates alerts about users “at-risk” (based on the output of a
       user classifier).

    The microservices run into Docker containers and the administrator of the execution graph
can scale it up by launching more containers (this also avoids the GIL problem, which happens
when multiple threads cannot execute bytecodes of Python at once: https://wiki.python.org/moin/
Int. J. Environ. Res. Public Health 2020, 17, 4752 5 of 23
GlobalInterpreterLock). In our case, each instance has its own interpreter of CPython and, thus, the
platform is free from this problem.). Furthermore, CPU or memory resources can be restricted for
each instance of a microservice. Another advantage is that modules are isolated and can have their
own dependencies. This prevents execution problems derived from lack of dependency or conflicts
between the nodes of the cluster. The microservices can even have different versions of Python, as long
as the shared data between microservices remain compatible.
1 from catenae import Link , Electron
2
3 class TokenFilter ( Link ) :
4
5 def setup ( self ) :
6 self . a llowed _token s = set ([ ’ bitcoin ’ , ’ gold ’ ])
7
8 def transform ( self , electron ) :
9 text = electron . value
10 tokens = text . split ()
11 if self . a llowed _token s . intersection ( tokens ) :
12 return text
13
14 if __name__ == " __main__ " :
15 TokenFilter () . start ()
Figure 2. Implementation of a middle microservice (token filter).
The proposed platform supports multiple inputs for a given node. There are two possible ways to
handle this case:
• Parity, where the microservices receive data indistinctly from their inputs.
• Exponential, where the microservices apply time windows to ingest data from their inputs. Each
input is assigned a fraction of the time. This fraction grows exponentially with the input priority.
The microservices can output any Python object. Python objects are automatically serialised and
compressed (and, after reception at the next microservice, objects are automatically deserialised).
It is possible to load external resources during the initialisation of a given microservice (for
example, load a Python dumped object) with C ATENAE. In addition, it supports Aerospike [20],
a key-value distributed store, that can be used to quickly load data during the initialisation stages.
Aerospike utilises RAM memory or SSD disks to store data and supports disk persistence when
using memory.
4. Use Case: Real Time Analysis of Signs of Depression
In this section we explain how to employ the Big Data technologies described above for designing
and deploying a SM intelligence tool that supports public health surveillance. More specifically, we
designed, implemented and deployed an automatic screening tool that ingests SM contents in real-time
and estimates the appearance of symptoms related to depression.
The SM source selected was Reddit, which is currently ranked in Alexa [21] as the 6th website
with more traffic in the United States and the United Kingdom, and the 20th globally. It has more than
430 million monthly active users, more than 130,000 active communities (https://redditinc.com/press)
and an average of 21 billion screenviews per month. According to our preliminary tests (https:
//github.com/brunneis/reddit-crawler), there are at least 2.9 million posts a day with peaks of
76 posts per second.
Reddit offers quite open data policies in comparison with other SM sites. It has thousands of
active communities (also known as subreddits) and some of them are oriented to mental health support.
These features make Reddit an ideal candidate for our case study.
First, we describe the crawling technology developed on our platform in order to ingest
publications made in Reddit. Next, we present our classification strategy to process user-generatedInt. J. Environ. Res. Public Health 2020, 17, 4752 6 of 23
data and estimate the onset of depression. Then, we proceed to explain the topologies needed to
deploy this user-based classification technology. Finally, we present the resulting online screening tool.
4.1. Social Media Crawler
In Reddit, user submissions are in the form of posts or comments that can contain text, pictures or
links. Reddit users, known as redditors, can vote for or against any submitted content. This SM site is
organised into subreddits, which are communities focused on specific themes.
A key goal when monitoring users in SM is to maximise the number of users and contents
that can be analysed. To this aim, we need to constantly collect new user submissions (posts or
comments) and, thus, we developed a web crawler to extract contents published in Reddit. We followed
standard Robot Exclusion Protocol guidelines and respected the constraints imposed by Reddit in
its robots.txt file. Our crawler uses C ATENAE and incorporates multiple horizontally-scalable
microservices. The architecture is shown in Figure 3. The main elements of the crawler are:
post_storer
user_document user_document
user_id
comment_crawler
user_id
user_document
user_id
Early risk
user_document detection pipeline
early_risk new_user_filter
user_ids_to_check
user_id
boolean
user_document new_texts
user_document
user_id
submission_crawler last_submissions last_comments user_probabilities
user_id
known_users
user_content_crawler
submission_id Effective data flow
comment_id of microservices
Real data flow
user_id
user_probability of microservices
user_id user_id
Database
Python microservice
new_users p1 users p2 users pn users
Figure 3. Diagram of the Social Media crawler.
• Crawlers of posts and comments. These crawlers constantly extract new posts and comments in
order to discover author’s usernames.
• User filter. Usernames are filtered to avoid repetitions. An efficient memory-based storage
system, Aerospike, is employed to support this filtering task. The users who pass the filter are
sent to a queue of new users. The queue of users to be crawled is organised as a priority queue.
In this way, usernames can be ordered following criteria, such as user’s activity. At this point,
we can also analyse the partial information available from the user (e.g., last extracted submission,
obtained when the username was discovered) and insert the username in the queue using a
priority score that estimates how probable is that the user shows signs of depression.
• Crawlers of user’s contents. All textual items (posts or comments) submitted by the users in the
queue are extracted. In Reddit, collecting all the posts made by a given user requires to make
n calls to the Reddit web server (where n is the number of submissions made by the user and
a maximum of 100 requests are allowed), while collecting the comments submitted by a user
requires only a single call. An output queue stores the extracted textual items.
• Content storer. It stores the textual contents in a document-oriented database. These texts will
later be fed to the early prediction modules (see Section 4.3).
Usernames can be quickly extracted because a single instance that monitors the appearance of
new contents in Reddit is able to discover multiple usernames. The main bottleneck is the User ContentInt. J. Environ. Res. Public Health 2020, 17, 4752 7 of 23
Crawler, which needs to make multiple calls to extract all user’s data. This is the only module in our
execution graph that requires a large number of instances.
4.2. Depression Classification
The Social Media crawler described above constantly extracts SM users and permits to keep
an updated representation of each user. New submitted contents are quickly detected and stored.
This incremental representation of the users can be thought of as a sequential accumulation device that
permanently learns about each user. Although this technology has the potential to support multiple
SM intelligence tasks, we focus here on how to employ it to support the detection of early signs
of depression.
There is substantial evidence in the literature that shows that the words people use are revelatory
of their psychological condition. In particular, depression has been associated with distinctive linguistic
patterns [4,9,10,22–24]. With the increasing use of Social Media, this type of patterns can be extracted
and analysed using online data.
Language use is a powerful indicator of multiple aspects of the individuals, such as their social
status, their personality, or their emotions. In terms of mental health, the interactions between natural
language use and different psychological disorders has received increasing attention. For instance,
Pennebaker [9,10] showed that depression is associated with an elevated use of first person pronouns.
Text analytics techniques can therefore be useful to estimate the onset of depression. Indicators
such as an increasing use of words related to negative emotions, words related to feelings of guilt,
or words related to the self can be valuable signs of risk. Traditional instruments, such as Beck’s
Depression Inventory [25], measure the severity of depression based on multiple-choice self-report
questions (composed of items relating to symptoms of depression such as fatigue, guilt, or weight
loss). The application of Big Data techniques to massive amounts of SM data can also provide valuable
insights about this type of symptoms and, following proper ethical guidelines, new depression
screening tools could be designed.
With supervised learning technology we can build a depression language classifier, an automatic
tool able to distinguish between the language of depressed and non-depressed individuals. However,
such construction requires a sample of labelled data (examples of text written by a depressed group and
examples of text written by a control group). Traditional research studies on depression and language
have been confined to clinical environments (for example analysing written essays or spontaneous
speech) and data cannot be redistributed. On the other hand, some studies on depression and
SM [4,22–24] suggested innovative methods to gather SM contents published by individuals diagnosed
with depression. However, these teams often worked with SM sources whose contents cannot be easily
distributed (e.g., tweets) and, in most cases, there are not publicly available collections of SM data.
One of the few exceptions are the datasets developed under the CLEF eRisk challenge [18,26–29]. This
is a series of shared tasks on early risk detection. The lab had a special orientation to psychological
disorders and several datasets have SM data from depressed and control group individuals. We focus
here on the eRisk 2017 and 2018 collections. The characteristics of these benchmarks are discussed next.
4.2.1. Datasets: eRisk 2017 and eRisk 2018
The source of data used to build the eRisk collections was Reddit. This fits well with our Big Data
platform, which ingests data from Reddit in real-time. Reddit has a large community of users and
many of them have a large history of interactions on the platform. There is substantive content about
psychological disorders, such as depression.
In creating these collections, a fundamental issue was how to determine what users have
depression. As argued above, some researchers [4] have employed clinical depression surveys.
But relying on self-reported questionnaires is tedious and requires to contact with every candidate.
Furthermore, the amount of data obtained in this way is limited. Other authors, e.g., [7], designed
automatic methods for identifying people diagnosed with depression. This was the approach followedInt. J. Environ. Res. Public Health 2020, 17, 4752 8 of 23
in building the eRisk datasets. It is based on extracting self-expressions of diagnoses from the user’s
SM submissions. These can be obtained by submitting certain queries to Reddit’s search service (for
example, “I was diagnosed with depression”). The retrieved results, which are posts that contain
some type of explicit mention of a diagnosis, were manually reviewed by the collection’s creators
to ensure that the information given in the posts really looked genuine. The quality of the resulting
collections is high and these benchmarks have been employed by dozens of research groups worldwide.
Reddit posts tend to be long and explicit, and many of the retrieved posts come from the depression
subreddit, a supportive space for users struggling with depression. Users suffering from depression
often submit content to this subreddit and many of them are very explicit about their psychological
diagnosis. The manual checks of the retrieved posts were strict. Expressions like “I am depressed”,
“I have depression”, or “I think I have depression”, were not considered as an explicit declaration
of a diagnosis. A user was included into the depression group only when there was an explicit and
clear mention of a diagnosis (e.g., “Last week, I was diagnosed with depression by my doctor”).
Following standard practice in this field, a control group was obtained by random sampling from
the entire community of Reddit users. Furthermore, the creators of the eRisk datasets included into
the control group some users who were active on the depression threads but had no depression (e.g.,
a doctor giving support to depressed users or a wife whose husband has depression). This type of
users often discuss topics related to depression and incorporating them into the control group makes
the collections more realistic (it is not only about distinguishing users based on the topic of their
conversations). It is possible that the control group has some truly depressed user and it is possible that
the depressed group has some user who has not depression (a user’s declaration about his diagnosis
might be untrue). However, as argued in [18], the impact of such cases is expected to be negligible and
other screening strategies (e.g., based on surveys) are not exempt from noise or false claims.
For each user, the eRisk collections contain up to 1000 posts and 1000 comments. The most active
users have nearly 2000 submissions covering a large period of time. This includes posts or comments
submitted to any subreddit. This allows to study the users’s natural language use (regardless of the
topic of the conversation). Each user’s thread of submissions is organised in chronological order. In
this way, the eRisk datasets allow to analyse not only language differences between the two groups
of users, but also the evolution of the text written by each group. For each user, the post where he
explicitly declared that he was diagnosed was removed from the collection. This removal prevents
depression language classifiers from overfitting to the specific phrases (e.g., “diagnosed with”) used
for creating the depression group.
Table 1 reports the main statistics of the eRisk 2017 and 2018 collections. Both datasets have two
splits, a training set of users and a test set of users. Following the evaluation scheme proposed in the
eRisk labs, we employed the train split to build a depression language classifier (using two-class
supervised learning technology) and, next, the learned classifier was evaluated against the test
examples. The performance of the test stage takes into account not only the accuracy of the decisions
but also the delay (i.e., how many submissions per subject were needed to make the decisions).
The main features of this evaluation scheme are explained next.Int. J. Environ. Res. Public Health 2020, 17, 4752 9 of 23
Table 1. Main statistics of the eRisk 2017 and 2018 collections.
eRisk 2017
Train Split Test Split
Depressed Control Depressed Control
Num. users 83 403 52 349
Num. submissions (posts+comments) 30,851 264,172 18,706 217,665
Num. of user submissions (avg) 371.7 655.5 359.7 623.7
Num. of days from first to last submission (avg) 572.7 626.6 608.31 623.2
Num. words per submission (avg) 27.6 21.3 26.9 22.5
eRisk 2018
Train Split Test Split
Depressed Control Depressed Control
Num. users 135 752 79 741
Num. submissions (posts+comments) 49,557 481,837 40,665 504,523
Num. of user submissions (avg) 367.1 640.7 514.7 680.9
Num. of days from first to last submission (avg) 586.43 625.0 786.9 702.5
Num. words per submission (avg) 27.4 21.8 27.6 23.7
4.2.2. Early Risk Evaluation Metrics
Given a language classifier (typically built from a set of training examples), and a set of test
examples, which are chronologically ordered sets of SM submissions made by test users, an early risk
detection challenge [18] consists of sequentially processing the available submissions and detect users
at risk as soon as possible. For each user, his submissions have to be processed in the order they were
created. Algorithms that effectively perform this task can be naturally incorporated into our Big Data
platform, which monitors SM submissions in real time.
Let us consider a collection of SM submissions written by k different users: U1 , . . . , Uk . Each
user Ui (i ∈ {1, . . . , k}) has ni submissions in the collection. The chronologically ordered sequence (or
stream) of Ui ’s submissions is denoted as: SUi ,1 , SUi ,2 , . . . , SUi ,ni ; where SUi ,1 is the oldest submission
and SUi ,ni is the newest submission. Given k streams of submissions (one per user), the early risk
detection task is defined as follows:
• An early risk detection system has to process the submissions following the order in which the
submissions were created. At some point p (p ∈ {1, . . . , ni }) the system has to emit a binary
decision. This binary flag represents the system’s estimation about the user showing signs of
depression.
• Positive cases need to be detected as soon as possible. However, there is a tradeoff between
making more informed decisions (based on many submissions) and making early decisions
(we act earlier but we base our decisions on fewer pieces of evidence).
Given golden truth judgements, which inform us about what users belong to the depressed
group, we can compute standard classification metrics (e.g., F1, Precision or Recall) to evaluate the
system’s estimations. However, these metrics are time-unaware and, therefore, the eRisk challenges
complemented them with a new metric, ERDE, that rewards early alerts.
ERDE stands for Early Risk Detection Error and takes into account the correctness of the (binary)
decision and the delay taken to emit the decision. The delay is a function that grows with the number of
user submissions seen before giving the answer. Essentially, ERDE is an error measure that incorporates
a penalty associated to the delay in detecting true positives. In the extreme case of detecting a true
positive after hundreds of submissions, the error score assigned is equivalent to the error assigned to a
false negative (i.e., late detection equals to no detection). Further details about ERDE can be found
in [18].Int. J. Environ. Res. Public Health 2020, 17, 4752 10 of 23
4.2.3. Validation of Depression Classifiers
In order to inject an effective depression classifier into C ATENAE, we implemented several
early detection methods and compared them with the collections and performance measures
described above.
The training splits were used to create a depression language classifier, which was subsequently
employed to support a number of early detection methods. In the training stage, each available user
was represented with a single text, formed by concatenating all his writings. This single-document
user representation was transformed into a vector of weights (one weight per word) using tf/idf
[30]. This weighting method is a statistic that estimates how important a word is to a document
based on a term frequency factor (which grows with the number of times the word appears in the
document) and an inverse document frequency factor (which favours words that appear in fewer
documents in the corpus). Given these vectorial user representations, we employed an effective
two-class classification approach, based on Logistic Regression, to learn a depression language classifier
from the available training users. More specifically, we performed L1 regularised Logistic Regression,
which leads to sparse classifiers (uninformative features, i.e., uninformative words, are removed)
whose computational requirements are prediction time are reduced. The classifier’s parameters were
set by running 4-fold cross-validation on the training data. We finally proceeded to fix the optimal
parameter setting and built the classifier from the whole training data.
Next, we tested different methods to sequentially process the chronology of texts written by
the users in the test split. Some methods require the classifier built from the training data and some
methods do not. The methods that we compared are:
• Random. This is a basic method that simply emits a random decision. It serves as a baseline for
comparison. The decision is emitted right after seeing the first user submission. This method is
fast but we expect it to perform poorly.
• Depressed. This is another fast (but naïve) baseline. It assigns the depression class to all users
(after seeing the first submission). Observe that the alternative “non-depressed” baseline would
not find any depressed user and, thus, it would score 0 on all performance metrics.
• First n. This method consists of concatenating the oldest n user submissions, sending them to the
depression language classifier, and making the prediction based on the output of the classifier. The
delay is therefore always equal to n. A particular instance, where n is larger than the maximum
number of user submissions, will be referred to as “All” (which sees all user submissions before
making any prediction).
• Incremental. This method does not consider a fixed number of user submissions. Instead, it starts
from the oldest user submission and incrementally builds a user representation. After each user
submission the method passes the aggregated representation (submissions seeing so far) to the
depression language classifier, and makes a “depressed” decision only if the depression language
classifier is confident enough (the depression language classifier outputs a probability score
that represents its confidence on the user being depressed; we tested the following confidence
thresholds: 0.5, 0.75 and 0.9). Observe that this method can emit the decision at any point (for
example, right after the first user submission or right after the last submission). If the stream of
user submissions gets exhausted then the method concludes assigning “non-depressed”.
Table 2 reports the results of these experiments. The comparison includes three standard
metrics, namely:
TP
Precision( P) = (1)
TP + FP
TP
Recall ( P) = (2)
TP + FN
2·P·R
F1 = (3)
P+RInt. J. Environ. Res. Public Health 2020, 17, 4752 11 of 23
where TP are the true positives (depression cases correctly labelled by the system), FP are the false
positives (non-depression cases labelled as depressed by the system), and FN are the false negatives
(depression cases labelled as non-depressed by the system).
Table 2. Comparison of classifiers. Classification and early detection metrics.
eRisk 2017
F1 P R ERDE5 ERDE50
Random 0.176 0.110 0.442 0.133 0.133
Depressed 0.230 0.130 1.000 0.113 0.113
First 10 0.254 0.474 0.173 0.113 0.112
First 100 0.574 0.592 0.558 0.073 0.070
First 500 0.571 0.533 0.615 0.069 0.066
All 0.584 0.541 0.635 0.067 0.064
Incremental 0.50 0.497 0.376 0.731 0.064 0.059
Incremental 0.75 0.600 0.625 0.577 0.068 0.065
Incremental 0.90 0.513 0.769 0.385 0.086 0.084
eRisk 2018
F1 P R ERDE5 ERDE50
Random 0.169 0.100 0.532 0.089 0.089
Depressed 0.176 0.096 1.000 0.087 0.087
First 10 0.263 0.429 0.190 0.082 0.082
First 100 0.563 0.556 0.570 0.051 0.050
First 500 0.551 0.495 0.620 0.048 0.047
All 0.565 0.510 0.633 0.047 0.046
Incremental 0.50 0.464 0.348 0.696 0.046 0.043
Incremental 0.75 0.530 0.506 0.557 0.052 0.050
Incremental 0.90 0.432 0.587 0.342 0.068 0.067
For each measure the highest performance (F1, P, R) or lowest error (ERDE5 , ERDE50 ) is marked in bold.
Two configurations of the ERDE measure were tested, ERDE5 and ERDE50 . With ERDE5 ,
the penalty for late detection of true positives grows quickly after 5 submissions. ERDE50 is a less
stringent version of the measure where the penalty grows after 50 submissions. Note that, unlike P,
R and F1, ERDE is an error measure and, therefore, the lower the better.
It is not surprising that the random method and the depressed method are the worst performers.
Of course, the depressed method yields perfect recall but its precision and ERDE scores are really poor.
The fixed-length methods (First) score reasonably well in terms of F1 but their ERDE performance
scores show that they are slow at detecting depression cases. In one of the collections, the All method,
which consists of analysing all user’s submissions, yields the highest F1. However, this method is
suboptimal in terms of early risk detection. The incremental variants are the most consistent methods.
They can make quick decisions and still yield competitive F1 scores. The incremental method with
threshold equal to 0.5 is the most solid approach. It has a good balance between correctness and delay
(yields the lowest ERDE scores and has competitive F1 scores). We therefore decided to adopt this
method for our Big Data platform.
Although the overall performance levels are modest, these classification methods are not meant
to be used for taking automatic decisions about particular individuals. As shown below, our platform
is oriented to support expert users in identifying risks of depression. The capability of the platform to
ingest massive amounts of user data and the ability of the classifier to focus on signs of depression
make a good combination to screen SM data.
Next, we explain how to deploy this classifier into our streaming architecture. To this aim,
we incrementally analyse the stream of texts written by each SM user and estimate the onset ofInt. J. Environ. Res. Public Health 2020, 17, 4752 12 of 23
signs of depression. The system incrementally builds a representation of each user, passes the user
representation to the depression language classifier, and, if the classifier is confident enough, the system
fires an alert. The system is oriented to early risk detection and, thus, it alerts as soon as it finds evidence
of a potential risk.
4.3. Pipeline Architecture
The classification tasks are handled by modules that will be referred to as predictor microservices.
The resulting architecture naturally scales up. If a preprocessing microservice is slower than the
predictor then we can augment the number of instances associated to the preprocessing stage. This
stream-based approach is highly efficient and more convenient than a batch processing approach for
generating alerts as soon as possible.
The prediction stage requires several microservices, which are sketched in Figure 4:
• A Text Vectorisation module transforms any input text into a vector of counts (number of
occurrences of each term in the vocabulary).
• An Aggregator receives the new vectors of counts (coming from new posts or comments) and
is responsible for producing an accumulated vector for each user. This vector represents all
posts and comments submitted by the corresponding user. The aggregator constantly merges the
current vector of counts with vectors coming from any new post or comment.
• The Tf–idf Transformation module takes the accumulated vectors, which store term frequency
counts, and produce a normalised tf/idf representation. To this aim, inverse document frequency
(idf) statistics are obtained from offline data (More specifically, corpus statistics are obtained from
the depression and language test collection [18]).
• Model Prediction module, which estimates the onset of signs of depression from the normalised
tf/idf representations. It employs the L1-penalised logistic regression classifier and produces a
probability estimate for each user. This probability value is stored by the next microservice.
• Probability Storer module, which receives and stores the estimated probabilities, and the Alert
manager module, which also receives the estimated probabilities and is responsible for emitting
alerts when probabilities are greater than a given threshold.
The storage and access operations are fast because we utilise Aerospike to store the accumulated
vectors and other required objects, such as the representation of the vocabulary, the classifier and the
tf/idf transformer. In our architecture, microservice initialisations and vector updates happen in a
very efficient way.
user_document
text_vectoriser vector_aggregator
count_vector
count_vector
count_vector
setup_objects count_vector
count_vectorizer
tfidf_transformer
lr_model
post_updater Reddit crawler
aggregated_vectors
text_probability tfidf_vector
user_probabilities
model_predictor tfidf_transformer
alerts
user_probability
early_risk
text_probability
user_probability
alert_feedback
proba
user_probability
user_probabilities alert
text_probability
alert
probability_storer alert_storer Effective data flow
of microservices
Real data flow
of microservices
submission_id comment_id Database
http_api
last_alert_submissions last_alert_comments Python microservice
alert_manager
text_probability
Figure 4. Architecture that supports early detection of signs of depression.Int. J. Environ. Res. Public Health 2020, 17, 4752 13 of 23
4.4. Social Media Depression Screening Tool
Using the Big Data technologies described above, we developed a prototype screening tool that
constantly analyses SM data and emits real-time alerts about the appearance of signs of risk. Such a
tool could be used in the future by public health experts. For example, the tool helps to analyse specific
groups or SM communities, to understand the onset and evolution of psychological disorders, to learn
about the main symptoms or topics discussed by people suffering from depression, etc. It can also
help researchers to build new datasets and test collections from SM data. As a matter of fact, we are
currently collaborating with psychologists in order to further exploit this tool to build new collections
for different disorders. As argued above, the platform is modular and adaptable to multiple monitoring
tasks and by incorporating other types of user classifiers we could support different SM intelligence
tasks and users (e.g., it could help SM moderators to early identify inappropriate behaviours).
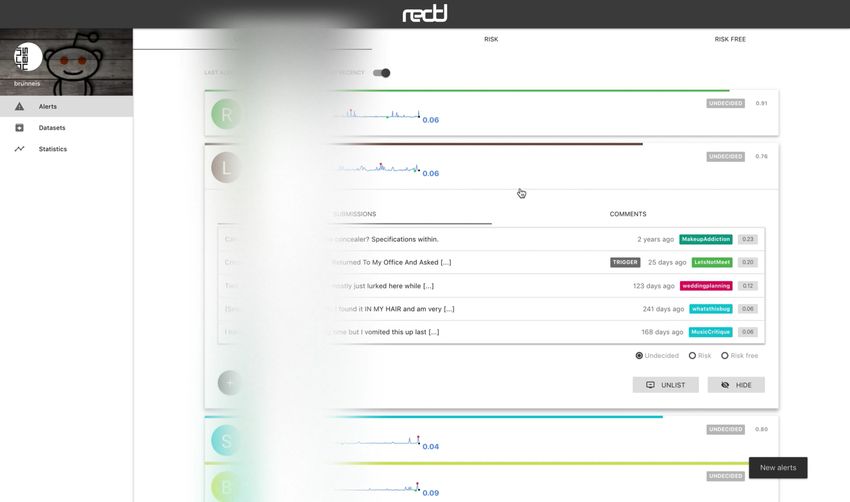
The web interface has three main views, which are connected to a HTTP API. Figure 5 shows the
“Alerts” view, where the user can inspect the alerts emitted by the system in real time. The alerts can be
ordered by recency or priority (where the users whose probability of depression is higher are shown
first). Each alert corresponds to one user and the tools presents the user’s posts and comments. The
individual submissions are ordered by decreasing probability and the expert can review the user’s
history of submissions. After inspection, the expert can label the alert as a true positive (risk) or false
positive (non-risk). In this way, the tool facilitates the construction of new SM datasets and benchmarks.
When an alert is fired, the tool also plots a line chart that represents the temporal evolution of the user
(see Figure 6). Each point in the plot represents the estimated probability of depression obtained at a
given point of time. These probability values are generated at the time points where the user made
new submissions (the new post or comment is employed to update the user’s representation and, next,
the user classifier produces a new probability estimate). The alerts are organised into three tabs in the
view. The default tab contains the untagged alerts, while the tagged alerts are organised into a true
positives tab and a false positives tag. The “Datasets” view allows the expert to download the true
positives, the false positives or all users (see Figure 7). The “Statistics” view reports basic real-time
information about the screening tool (total number of post or comments processed, number of users
analysed, and processing speed (see Figure 8)).
Figure 5. View of real-time alerts of signs of depression (real usernames have been obfuscated).Int. J. Environ. Res. Public Health 2020, 17, 4752 14 of 23
Figure 6. View to inspect the user’s submissions that generated a given alert (user data have
been obfuscated).
Figure 7. View to download the extracted dataset.
Figure 8. Statistics view.
4.5. Performance Analysis
We deployed the architecture described above in a well-known cloud computing service, Amazon
Web Services (AWS). AWS supports a wide range of virtual machines in its EC2 infrastructure.
We utilised c5.4xlarge instances that have the following characteristics:
• CPU: Intel(R) Xeon(R) Platinum 8124M CPU @ 3.00 GHz (16 assigned virtual cores).
• Memory: 32 GB.
• Storage: 100 GB SSD General Purpose volumes (EBS).
• Dedicated Bandwidth: up to 2.250 Mbps for EBS storageInt. J. Environ. Res. Public Health 2020, 17, 4752 15 of 23
The general network performance is around 5 Gbps. In this series of experiments, we considered
that processing was performed in real time when all texts were classified within seconds (with no
growing queue of pending texts). In order to remove bottlenecks, we determined experimentally the
proportion of each type of microservice instances in each execution graph. For crawling purposes, the
User Content Crawling module was the only module that required scaling. For classification purposes,
the most demanding stages are Text Vectorisation, Tf-idf Transformation, Vector Aggregation and
Model Prediction and we assigned the proportions 2-4-4-1 (respectively) in order to balance the
workload.
The parallelism score refers to the number of times that the selected microservices were replicated.
For instance, a parallelism score equal to 4 in the classification execution graph would assign 8x Text
Vectorisation instance, 16x Tf-idf Transformation instances, 16x Vector Aggregation instances and 5x
Model Prediction instances.
Figure 9 reports the number of extracted texts per second for two crawling experiments performed
on Reddit in different days. A single virtual machine was launched and crawler parallelism was tested
from 1 to 400. Each configuration was executed during five minutes. Reddit’s workload and response
times varied over the experiments and, thus, the two tests show slightly different patterns. With higher
response times, the optimal number of instances of the crawler is higher. When the parallelism score
was greater than 320, performance starts to degrade for both experiments.
1,300
No. of extracted texts per second
1,100
900
700
500
300 Ideal case
Test A
100 Test B
1 80 160 240 320 400
Crawler parallelism
Figure 9. Performance of the crawler with varying parallelism settings (one node).
Figure 10 reports the results of two experiments run with the classifier and the crawler during
different days. To ensure real-time processing of the submissions, crawler parallelism was evaluated
from 1 to 50 (with crawler parallelism scores higher than 50, real-time processing was not achieved) and
the parallelism of the classifier was directly set based on the crawler’s parallelism score. Each
configuration was executed during five minutes. This experiment was repeated for Test B with
the same parallelism settings. The results were highly satisfactory (higher efficiency of the crawler
compared with Test A, while still maintaining real-time processing).
In a final experiment, we configured a three-node cluster using Apache Kafka and ran an
experiment for three hours (see Figure 11). There were large fluctuations on crawling capacity (between
500 and 1000 extracted submissions per second). As a consequence, the size of the queue of pending
(unclassified) aggregated vectors oscillated substantially. This suggested that a fixed parallelism in
both topologies (or even a fixed number of nodes) is not an optimal choice. In order to perform better,
the system should scale up and down automatically and avoid wasting resources. In the future, we will
work on designing an execution graph controller that automatically adapts the parallelism levels to
the current workload.Int. J. Environ. Res. Public Health 2020, 17, 4752 16 of 23
No. of texts classified per second (real time)
400
Ideal case
350
Test A
300 Test B
250
200
150
100
50
10
1/1 5/1 10/2 20/5 30/8 40/12 50/19
Crawler / classifier parallelism
Figure 10. Parallelism level required to achieve real-time processing in one node.
·105
No. of extracted texts per second
5 1,000
900
4
No. of texts
800
3 700
600
2
500
1 Classifier queue
Crawler perf.
0
17:00 17:30 18:00 18:30 19:00 19:30 20:00
Time (UTC)
Figure 11. Three-hour experiment (using 3 nodes). The parallelism levels (crawler/classifier) were
170/0, 0/50 and 0/50.
5. Connection with External Systems
The library utilises Kafka and this choice facilitates the connection between our execution graph
and external systems. We can set up producer connections (where the external source emits data to
the execution graph) or consumer connections (where the external source consumes data from the
execution graph). To this aim, we only need to incorporate a Kafka consumer or producer into the
external system.
Frameworks such as P OLYPUS [31] can be easily connected to our library. P OLYPUS [31] is a
modular platform that provides functionalities such as data extraction from SM, real-time sentiment
analysis, and distributed non-relational storage (just to name a few). The core modules of P OLYPUS
are not written in Python but P OLYPUS can naturally act as a data source for C ATENAE. Figure 12
illustrates how to include a Kafka producer that connects P OLYPUS with C ATENAE. The resulting
Twitter crawler sends tweets to the input of a C ATENAE execution graph. This connects a module
written in Java (from P OLYPUS) and an execution graph written in Python (from C ATENAE) and, thus,
data should be in the form of basic types.Int. J. Environ. Res. Public Health 2020, 17, 4752 17 of 23
TWITTER
STREAMING API WEB INTERFACE
TWEETS
TWEETS
TWITTER CRAWLER
IDs TWEETS
API CONSUMER WEB SCRAPERS IDs
TWEETS
Text
Figure 12. P OLYPUS ’ Twitter crawler.
6. Related Work
6.1. Social Media Intelligence
In recent years, many studies have explored the potential of SM to predict the onset of
psychological problems. The interactions between SM activity and psychological traces have been
the focus of attention of popular evaluation campaigns, such as the CLPsych shared tasks [32,33],
organised within the Computational Linguistics and Clinical Psychology Workshop, or the eRisk
tasks [26–28], oriented to early detection of signs of psychological problems and organised within the
Conference and Labs of the Evaluation Forum (CLEF). These shared tasks have instigated research
on how different search and language technologies (e.g., Text Classification, Information Retrieval
and Text Mining) can support health intelligence. To this aim, the organisers of these challenges
collected data from SM (e.g., CLPysch collected posts in online peer-support fora and eRisk collected
SM submissions –posts and comments– from Reddit) and asked participants to perform a certain task.
For example, CLPsych asked participants to distinguish between the posts written by individuals
who suffer from a certain mental disorder from the posts written by individuals who do not suffer
from such disorder. Rather than a two-class classification problem, the eRisk shared tasks focused
on early identification of signs of psychological problems and, thus, the participants had not only to
make accurate predictions about the presence of psychological problems but to do it quickly (e.g.,
after seeing few pieces of evidence in the form of SM submissions).
Over the years, many research efforts have been focused on SM and psychological disorders.
The team led by De Choudhury has been very active on analysing SM and mental health [4,6,22,34].
In [4], they explored the potential to use Twitter feeds to detect and diagnose depression episodes.
To this aim, they employed existing tools such as Linguistic Inquiry and Word Count (LIWC) [35] and
well-known medical questionnaires, such as the Center for Epidemiologic Studies Depression Scale
(CES-D). A discussion on the role of SM and its potential in developing automatic screening tools can
be found in [6]. In [22], it was analysed how to employ SM data as a measurement tool of depression
in populations. The study suggests that evidence obtained from SM can complement traditional
survey techniques. Furthermore, the results show that a SM-based depression index confirms several
psychiatric findings and correlates with statistics reported by health institutions.
Coppersmith and colleagues [36] considered Post Traumatic Stress Disorder (PTSD) and
demonstrated the utility of Twitter data in building automatic classifiers that exploit differences
in language use between PTSD and non-PTSD individuals. In a similar vein, the same team of
researchers showed in [7] that Twitter can be a valuable source of evidence to enhance the data about
PTSD, depression, bipolar disorder and seasonal affective disorder available to clinicians. Cohan and
colleagues [37] explored how to create large-scale, labelled datasets related to mental health. To thisYou can also read


