InsideInsights: Integrating Data-Driven Reporting in Collaborative Visual Analytics
←
→
Page content transcription
If your browser does not render page correctly, please read the page content below

Eurographics Conference on Visualization (EuroVis) 2019                                                                         Volume 38 (2019), Number 3
M. Gleicher, H. Leitte, and I. Viola
(Guest Editors)

                    InsideInsights: Integrating Data-Driven Reporting in
                               Collaborative Visual Analytics

                                 A. Mathisen,1          T. Horak,2     C. N. Klokmose,3    K. Grønbæk,1      and N. Elmqvist4
                                                       1 Department of Computer Science, Aarhus University, Denmark
                                                      2 Interactive
                                                                 Media Lab, Technische Universität Dresden, Germany
                                           3 Department of Digital Design and Information Studies, Aarhus University, Denmark
                                             4 College of Information Studies, University of Maryland, College Park, MD, USA

     A                                            B                                                                             D

                                                  C

Figure 1: The InsideInsights system: (a) a narration hierarchy allows gradually expanding and reviewing details. The annotation cells are
linked to presentation views, either showing (b) selected visualizations, or (c) a part of the underlying analysis pipeline. Furthermore, (d)
annotation cells can encapsulate multiple states for a linked component.

         Abstract
         Analyzing complex data is a non-linear process that alternates between identifying discrete facts and developing overall as-
         sessments and conclusions. In addition, data analysis rarely occurs in solitude; multiple collaborators can be engaged in the
         same analysis, or intermediate results can be reported to stakeholders. However, current data-driven communication tools
         are detached from the analysis process and promote linear stories that forego the hierarchical and branching nature of data
         analysis, which leads to either too much or too little detail in the final report. We propose a conceptual design for integrated
         data-driven reporting that allows for iterative structuring of insights into hierarchies linked to analytic provenance and chosen
         analysis views. The hierarchies become dynamic and interactive reports where collaborators can review and modify the anal-
         ysis at a desired level of detail. Our web-based I NSIDE I NSIGHTS system provides interaction techniques to annotate states of
         analytic components, structure annotations, and link them to appropriate presentation views. We demonstrate the generality
         and usefulness of our system with two use cases and a qualitative expert review.
         CCS Concepts
         • Human-centered computing → Visual analytics; Visualization toolkits; Collaborative and social computing;

1. Introduction                                                                       and sometimes the analyst will formulate priori hypotheses that
                                                                                      are tested in a confirmatory fashion. Furthermore, data analysis
Modern society—from business and journalism to medicine and
                                                                                      is seldom confined to a single person; multiple collaborators will
policy—is increasingly data-driven. Data analysis itself is itera-
                                                                                      often contribute to the same analysis, or intermediate results can
tive, non-linear, and fragmented with both top-down and bottom-
                                                                                      be shared with stakeholders. Thus, an important aspect of col-
up characteristics [PC05, KPHH12, Tuk77]; sometimes the analyst
                                                                                      laborative data analysis is to enable communication of insights
lets the data itself inform assessments in an exploratory fashion,

 c 2019 The Author(s)
Computer Graphics Forum c 2019 The Eurographics Association and John
Wiley & Sons Ltd. Published by John Wiley & Sons Ltd.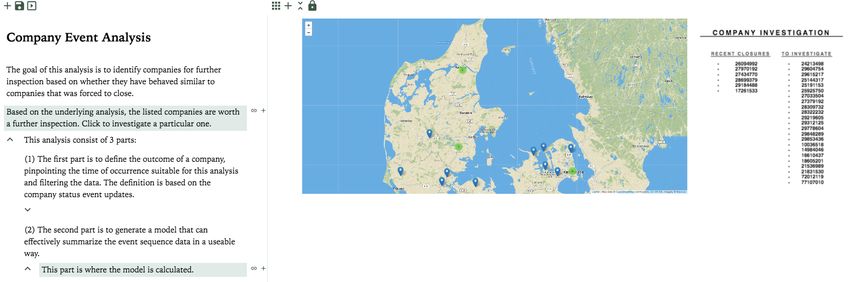
A. Mathisen et al. / InsideInsights: Integrating Data-Driven Reporting in Collaborative Visual Analytics

even before the analysis has concluded [MT14, ST15, ZGI∗ 18].                   ing, and interpreting data [Tuk77, PC05, KPHH12]. Consequently,
However, transferring knowledge is especially difficult for non-                analysts will often try multiple analysis avenues, of which several
routine and ill-defined tasks [Sha08], hence effective communi-                 will be dead ends, until they arrive at usable insights and conclu-
cation requires a correspondingly rich mechanism to match the                   sions [KPHH12]. Furthermore, exploration often proceeds itera-
complexity of exploratory data analysis. In the context of report-              tively through several levels of abstraction: sometimes from low-
ing insights, a proven communication method is data-driven story-               level insights to high-level explanations, and sometimes from gen-
telling [GP01, SH10], but such mechanisms are not well integrated               eral schemas to concrete data [PC05, CBYE18]. In this work, we
within the iterative and branching nature of sensemaking. For ex-               are interested in the entire data analysis pipeline, from cleaning and
ample, Tableau [Sof18] allows users to build stories to convey their            modelling to visualization and interpretation.
insights, but this is done as a separate task once data analysis has
concluded. Similarly, computational notebooks [RTH18, KRA∗ 18,                     Maintaining an accurate record of this non-linear process is chal-
UPSK18] (such as Observable and Jupyter) have limitations when                  lenging, and has led to a large body of research focused on prove-
used for exploration and presentation simultaneously. Furthermore,              nance tracking [DF08,RESC16] to support recall, replication, com-
slideshows and notebooks alike force analysts to linearize their                munication, and presentation. Interactive visualization is particu-
findings and fixate on the level of detail presented to the audience,           larly useful for communicating provenance, and several systems
which again is not commensurate with its incremental nature.                    thus incorporate provenance tracking. For example, GRASPARC
                                                                                tracks exploration histories as a branching hierarchy [BPW∗ 93],
   In this paper, we present I NSIDE I NSIGHTS, a conceptual design             which was later extended by Shrinivasan and van Wijk [SvW08]
and a web-based system for capturing both low-level insights and                by allowing users to append annotations. VisTrails [BCC∗ 05] was
high-level abstractions during data analysis. The idea is to sup-               an early provenance management system for scientific visualiza-
port data-driven reporting as an integral part of the analysis process          tion and analysis workflows. Similarly, the Burrito system auto-
by bridging proven concepts from literate computing, provenance                 matically captures low-level computational activities to allow re-
tracking and storytelling. In essence, InsideInsights is a hierarchi-           searchers to compare different analysis stages [GS12]. Gotz et
cal insight management system allowing analysts to interchange-                 al. [GZ09] instead used such low-level user events to infer high-
ably (1) coalesce findings into higher-level abstractions, and (2)              level semantic meanings for the analytic process. Similar to our
subdivide composite assumptions into items that can eventually be               approach, this results in a hierarchical structure but is fixed to pre-
validated. The result is a multi-level report supporting hierarchical           defined task classes and probably is not able to adequately represent
(pyramidal) thinking [Min09] that a collaborator or stakeholder can             the analysts mental model. Further, as with all approaches of fully
expand to the desired level of detail in order to understand the find-          automated tracking of user interactions, it remains challenging to
ings and the process. Our system (Figure 1) provides a structured               make sense of the resulting, often large, provenance graphs.
data-flow environment where analysts can load, transform, and vi-
sualize data on an interactive canvas. Thus, InsideInsights supports               Recently Kery et al. [KHM17] described how analysts rarely use
the entire sensemaking loop [PC05], from information foraging and               conventional version control, such as Git, thus motivating their de-
marshalling, to schematizing and presentation.                                  sign of a lightweight inline versioning method for programming
                                                                                environments to support EDA. In our work, we also employ prove-
   The proposed concepts are a step on the way to what we call lit-             nance tracking of the entire analysis pipeline. However, the tracking
erate analytics, where the goal is to document not only the final               is triggered by user annotations to support lightweight versioning,
outcomes, but also provide a narrative of the actual analysis pro-              and to avoid cluttering the provenance history.
cess itself. We envision that by unifying the analysis and commu-
nication components of sensemaking, our tools can better support
the dynamic data analysis scenarios that organizations increasingly             2.2. Data-Driven Storytelling
face [KPHH12, UPSK18]. The contributions of our work are the
following: (1) a conceptual design that address core challenges for             Data analysis is arguably meaningless if its findings cannot be
integrating data-driven reporting by bridging literate computing,               effectively communicated to stakeholders, other analysts, or the
provenance tracking, and presentation techniques. (2) the Insid-                general population [TC05]. One way to convey data analysis re-
eInsights system, a proof-of-concept implementation using modern                sults is through data-driven storytelling [LRIC15], where annota-
web technologies; (3) application scenarios of the system to two                tions, rich media (videos, images, sound, tables, etc), and visual-
real world datasets; and (4) findings from an expert review indicat-            izations are combined into a narrative [GP01, SH10, HD11]. The
ing the soundness of our approach.                                              increased focus on creating interactive presentations to commu-
                                                                                nicate findings has led to several related concepts. Examples in-
                                                                                clude active reading with live documents [WKM02], literate hier-
2. Background
                                                                                archies using supplemental materials [GRSG17], interactive narra-
In this section, we review existing work on supporting exploratory              tives [CH18], and external representations [Kir10,RRH∗ 19]. How-
data analysis and data-driven communication.                                    ever, because design choices for visual communication impact
                                                                                comprehension [Kir10, HDR∗ 13], there often is no single presen-
                                                                                tation that fits all audiences. For example, a C-level executive may
2.1. Tracking Exploratory Data Analysis
                                                                                only need the top three take-aways from a quarterly sales report,
Exploratory data analysis (EDA) is typically an iterative process               whereas a strategic account manager will want to understand the
that involves multiple cycles of, e.g., cleaning, modeling, visualiz-           provenance and details of the same analysis.

                                                                                                                                                    c 2019 The Author(s)
                                                                                   Computer Graphics Forum c 2019 The Eurographics Association and John Wiley & Sons Ltd.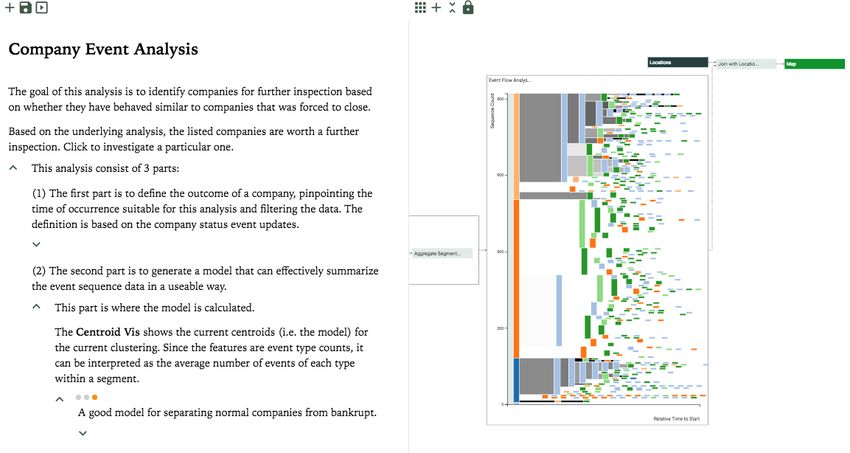
A. Mathisen et al. / InsideInsights: Integrating Data-Driven Reporting in Collaborative Visual Analytics

   Current tool support for data-driven storytelling mostly consists                     the analyst will backtrack to explore a different avenue of inquiry;
of linearizing analytical findings into a sequence [SH14], which                         sometimes entire paths will be abandoned; and sometimes the cur-
requires the designer to fixate on a specific abstraction level in                       rent strand of investigation proves to be the right one. Supporting
their narrative. This discards the richness of non-linear analyses                       this type of workflow is a challenge in itself, and in collaborative
and makes it difficult to review the findings at the desired level                       scenarios it is also a challenge to share, hand off, and communi-
of detail. Separating analysis from presentation also fragments the                      cate insights from such a process, as amply pointed out in past
sensemaking process further, often making the communication of                           work [HA08, Sha08, KPHH12, MT14, RTH18, ZGI∗ 18]. In addi-
analytic products an afterthought instead of a mechanism to sup-                         tion, there is no watertight boundary between analysis and pre-
port collaboration throughout the exploration [RTH18, KRA∗ 18,                           sentation [PC05]; sometimes a presentation may even return back
VW06]. For this reason, Gratzl et al. [GLG∗ 16] created a method                         to exploration. Thus, as described already in the initial research
for seamlessly switching between visual exploration, authoring,                          agenda for visual analytics [TC05], all this indicates an explicit
and presentation specifically for interactive visualizations using                       need for integrating presentation in the analytic process.
provenance tracking of user interaction. In our work, we extend
                                                                                            For example, consider a team of analysts tasked with finding cor-
previous work by focusing on the entire analysis pipeline, i.e., the
                                                                                         rupt companies in financial data. In order to identify potential viola-
provenance of cleaning and modelling parts as well as user inter-
                                                                                         tors, they may analyze known cases and identify typical conducts,
action in visualization parts. Furthermore, our hierarchical insight
                                                                                         e.g., specific registration changes, financial statements, or share-
structure allow users to build interactive reports targeting multiple
                                                                                         holder changes. Within the team, the members have varying com-
user types while still preserving the provenance in full detail.
                                                                                         petences; some are expert programmers, some have knowledge of
                                                                                         data science methods, and others possess domain knowledge. Shar-
2.3. Notebooks and Toolkits                                                              ing data work and insights in this environment is a challenge as
                                                                                         highlighted above, and especially when sharing partial progress. In
In recent years, literate computing in the form of computational                         addition, the team occasionally needs to consult with their stake-
notebooks [KRKP∗ 16, RNA∗ 17, Goo18, Obs18, TME08] have be-                              holders to discuss next steps as well as share their work with other
come an essential part of data science [RTH18, KRA∗ 18], even                            teams within the organization to support reuse and to align knowl-
of entire organizations [UPSK18]. Notebooks combine executable                           edge about risk patterns. This scenario is based on data from the
code, their output, and text in a single document, which has                             Danish Business Authorities, indicating that blending analysis and
proven to be very useful for quick prototyping and exploration.                          reporting is an intrinsic challenge within larger organizations (we
Thus, notebooks already possess qualities suitable for data-driven                       expand on this scenario in Section 5.2). In this section, we first ex-
communication and replicability. For these reasons, recent ef-                           plore core challenges for integrating data-driven reporting and then
forts have tried to enhance their functionality; for example, syn-                       describe design concepts that address them.
chronous collaboration in notebooks is becoming the de facto stan-
dard [Goo18,RNA∗ 17], and reactive execution flows are also being
supported [Obs18, BMR∗ 19]. Nevertheless, the linear document                            3.1. Challenges for Integrating Data-Driven Reporting
nature that is fundamental to all computational notebooks yields
                                                                                         Through an analysis of related work and systems, we have identi-
a tension between exploration and presentation [RTH18,KRA∗ 18],
                                                                                         fied three core challenges for integrating data-driven reporting:
making it difficult to support non-linear workflows that alternate
between generating and presenting insights.
                                                                                         C1 – Annotations & External Representations. Insights are
   Beyond notebooks, several toolkits exist for quickly creating                         pieces of information relevant to the analysis [Nor06] that can
visualizations for exploratory data analysis [SWH14, SMWH17a,                            be characterized in manifold ways—complex, deep, qualitative, or
MNV16, YEB18]. However, these systems generally do not pro-                              even unexpected—and refer to different artifacts, e.g., single data
vide support for insight management during EDA. A prominent                              points, patterns, or the overall analysis structure. Capturing and pre-
example is the Tableau [Sof18] suite that takes analysts from data                       senting such insights is a challenge and often require rich mecha-
preparation, to visual exploration, and finally to presentation. How-                    nisms for creating interactive narratives [WKM02,LRIC15,CH18],
ever, narration is typically a separate step in current tools, or done                   annotating visualization states [VWVH∗ 07, HVW09], and con-
in completely different tools [BE18, NK18]. In our work, we build                        structing external representations [Kir10, RRH∗ 19]. Still, few tools
on the success of collaborative notebooks and pipeline-based meth-                       incorporate such methods as part of the analysis environment.
ods for data analysis by implementing our system on top of Code-                         For example, in notebooks, it is mainly the layout that specifies
strates [RNA∗ 17] and Vistrates [BMR∗ 19] (cf. Section 4.4).                             the relation between annotations and computations, which means
                                                                                         that describing the iterative nature of an analysis is challeng-
                                                                                         ing [KRA∗ 18]. This challenge therefore includes maintaining ex-
3. Design Framework: Data-Driven Reporting
                                                                                         actly what parts of the analysis annotations refer to and simultane-
The sensemaking loop [PC05] is an iterative process for foraging                         ously supporting interactive representations [HVW09, Kir10].
data, building schemas from specific findings, and creating pre-
sentations from the schemas. In this way, the analyst engages in                         C2 – Adaptive Details. Expertise and level of interest vary in col-
a gradual, bottom-up, and data-driven refinement that slowly in-                         laborative workflows, which means that every detail is not always
creases in abstraction level. The whole process is iterative, me-                        beneficial, but should be readily available for review when required.
andering, and prone to branching [BPW∗ 93, SvW08]: sometimes,                            This challenge has been highlighted in various ways in related

 c 2019 The Author(s)
Computer Graphics Forum c 2019 The Eurographics Association and John Wiley & Sons Ltd.
A. Mathisen et al. / InsideInsights: Integrating Data-Driven Reporting in Collaborative Visual Analytics
work. It has been described how preparing a notebook for presen- A B Presentation Layer
tation often requires the analyst to delete parts—parts that may be Narration Layer
A1
higher level
of benefit at a later stage [RTH18,KRA∗ 18]. Rule et al. [RDTH18] literate elements
A1
A4 A12
have subsequently motivated how dynamic restructuring of note-
books can support sharing. Research has also shown how hierarchi- A12
state
A7 A8 A11 A15 annotation
cal structuring of supplemental materials can benefit comprehen-
A11
sion [GRSG17] and how analysis history can support collaboration
Σ analysis
and task hand-off [ST15, ZGI∗ 18]. Thus, it is not only a challenge components
Σ
to dynamically maintain details of an analysis, but also in a way A8
Analysis System
that indicates how insights are related. Current tools provide little
support for such multi-level and broad-audience analysis products Figure 2: Bridging narration and analysis: (a) the dynamic anno-
that can capture the full richness of the data analysis process, in- tation hierarchy ties low-level insights to analysis states and links
cluding not just findings, but also dead ends and failed hypotheses. them to higher-order schemas; further, (b) the annotations can be
linked to specific presentation views.
C3 – Fragmented Workflows. An overarching challenge is the
non-linear nature of collaborative data analysis [Sha08, HA08,
KPHH12,MT14]. An analysis frequently alternates between explo-
ration and reporting, with the same analysis parts often revisited 3.3. Dynamic Insight Hierarchies
several times. However, in most current visual analytics tools— For tackling challenge C2 and supporting the flexible nature of the
with a few exceptions [GLG∗ 16]—analysis and presentation are sensemaking loop, we propose to maintain all annotations in a hier-
separate stages that are poorly integrated [RTH18, KRA∗ 18]. By archical structure. This is motivated by the observation that people
forcing the user to create presentations as a separate activity, the tend to organize information in hierarchies, in order to break down
rich provenance of the analysis is easily lost and it becomes non- ideas and make them easier to capture [Min09]. The natural alter-
trivial to go back to the analysis stage or reuse analysis parts. native to a hierarchical information structure is a graph structure.
However, it has been shown that hierarchical structures can better
3.2. Linking Annotations to Analysis States support overview and comprehension, especially for readers with
low prior knowledge of the content [ATM09,SVLV16]. In contrast,
To address C1, we adopt the concept of linking annotations to vi-
graph structures are better for certain information seeking tasks for
sualization states [VWVH∗ 07,HVW09], but we expand it to incor-
readers with higher prior knowledge, but this structure imposes a
porate the full provenance of the analysis pipeline. Conceptually,
more demanding process on the reader [ATM09,SVLV16]. To build
an annotation can be linked to a snapshot of the analysis parts it de-
up such a hierarchy, analysts can capture an annotation in a cell (as
scribes (Figure 2a). For example, the states can capture selections in
in computational notebooks). Similar to the concept of structured
visualizations, input values of UI elements, or computational out-
writing [Hor98], these annotation cells allow the analyst to orga-
put. The subset of the analysis which an annotation depends on
nize the analysis details and abstract multiple specific insights into
is defined by how various parts are linked. For example, annotat-
generalized structures that we call dynamic insight hierarchies.
ing the first cleaning step does not depend on a later visualization,
but annotating the visualization depends on the first cleaning step. As annotations can be grouped based on the same analysis parts
While the provenance information is automatically maintained, the they describe, related annotation cells can automatically be kept as
user defines which states should be captured by triggering the track- groups within the hierarchy. The active annotation cell can then be
ing through annotating insights. As this force the user to actively shown as the top (visible) cell in a group and the inactive anno-
create annotations throughout an analysis, it addresses the issue of tations can be thought of as tabs with alternative explanations. By
making sense of a potentially inflated provenance graph after EDA. supporting this as the default behavior, users are assisted in adding
new annotations to relevant places of the hierarchy. This way, the
This concept also addresses C3 in that it is possible to return to
annotations can capture the alternative decisions that were consid-
old stages of an analysis and use the annotations to recall any rea-
ered (and thus which ones were omitted), kept in a semantically
soning. However, changing the analysis state during EDA can have
sound location of the hierarchy. For example, there is typically a
the side effect of negating certain annotations as they no longer de-
specific model or visualization selection that proves to be the ideal
scribe the active analysis states. We therefore introduce the concept
choice for a given analysis. However, this behavior does not fit all
of active and inactive annotations. If the current states matches the
analysis types, and if multiple annotations about the same visual-
linked states of an annotation, it is active; otherwise it is inactive.
ization state are created there is more than one active annotation.
Analogously, manually activating the annotation restores the snap-
Thus, it should be possible to split up annotation groups to have
shot of the analysis system. This enables bi-directional interaction
annotations about the same analysis parts in different places of the
for exploring annotations, contrary to the one-directional interac-
hierarchy. Note, all annotation cells in a hierarchy does not have to
tion in, e.g., Idyll [CH18]. But, it also introduces design challenges
depend on analysis states. It should also be possible to create nor-
for adequately indicating when annotations become active or in-
mal cells as in the literate computing paradigm [KRKP∗ 16] within
active. Finally, annotations can be grouped based on whether they
the hierarchy that e.g. describe the logic behind an algorithm.
describe, and thus depend, on the same analysis parts (represented
as stacks in Figure 2a). If each annotation in a stack describes a The insight hierarchies can be constructed during the analysis
different state, only one annotation can be active. process and at any point be restructured, thus supporting chal-
c 2019 The Author(s)
Computer Graphics Forum c 2019 The Eurographics Association and John Wiley & Sons Ltd.A. Mathisen et al. / InsideInsights: Integrating Data-Driven Reporting in Collaborative Visual Analytics
lenge C3. Conceptually speaking, annotation cells can either be Parent P1
merged by introducing a parent cell, which summarizes the high- P1
level meaning or interpretation of the underlying cells, or split by S1 S2 S3
adding children to an existing cell, and thereby subdividing the par- S1 S2 S3
ent into multiple supporting pieces of evidence (Figure 2a). Sup-
Prior Sibling Next Sibling C1 C2
porting both types of operations interchangeable is critical to sup-
C1 C2
port the non-linear nature of EDA. By structuring insights during First Child
the analysis, the author is already creating a narrative similar to
data-driven storytelling [GP01, SH10, HD11], i.e. a guided way of Figure 3: The hierarchical presentation concept. Navigating the
understanding the current content. In addition, the dynamic insight report entails not just visiting annotations on one level, but also
hierarchy supports precisely the adaptive level-of-detail outlined in ascending and descending the hierarchy.
challenge C2. A viewer presented with an insight hierarchy will
initially only see the top-level element (or potentially only a few 4. The InsideInsights System
levels down). Depending on their expertise, available time, and in-
The I NSIDE I NSIGHTS system is a proof-of-concept of the design
terest, the viewer can then expand annotations with children as far
described above, implemented as a collaborative web-based solu-
as desired, potentially down to the atomic annotations at the bot-
tion (github.com/90am/insideinsights). The system is build on top
tom of the hierarchy. Readers can also choose to stay on a single
of the computational notebook Codestrates [RNA∗ 17] and the Vis-
level-of-detail and thus use the report as a linear story.
trates component model [BMR∗ 19]. The novel combination of lit-
erate computing, hierarchical structure, provenance tracking, and
presentation techniques allows for an iterative workflow interleav-
ing composing analysis parts, capturing insights, and sharing the
3.4. Hierarchical Presentation Views current progress. The workflow is therefore similar to the open-
ended workflow of computational notebooks. In this section, we
To complement the annotations and address C1, we propose the will explain the system with its three main parts: (A) compose anal-
concept of presentation views. By default, annotation cells remem- ysis, (B) develop insight hierarchy, and (C) share and review.
ber the analysis view during their creation, allowing to restore it
later along with the analysis state. Presentation views are an addi-
tion that allow to define a different representation. For example, a 4.1. Part A: Compose Analysis
user can manually create a canvas containing visualizations along- The InsideInsights system supports a visual data-flow approach,
side with hand-drawn elements. This flexible creation of external where a user performs sensemaking by assembling components
representations supports the comprehension of insights in the same to transform and visualize the data on an interactive canvas (Fig-
way visual elements are used in data-driven storytelling [LRIC15]. ure 1c). For this purpose, Vistrates [BMR∗ 19] provides a com-
Similar to linking annotations to analysis states, annotation cells ponent template and a reactive data-flow based execution model
can be linked to presentation views (Figure 2b). When browsing within a notebook environment. A component in Vistrates is essen-
the annotation cells, the linked view is automatically shown to the tially a piece of code that consumes one or multiple input sources,
user and the analysis state restored. By supporting easy creation of process the data (e.g., to create a view), and eventually provide an
such views throughout the analysis process, the gap between the output. The component observes the data output of its sources and
analysis and the presentation (C3) is effectively minimized. reacts on any updates, causing a recalculation of any views, data,
or filters. A wide range of existing components (e.g., aggregation
Furthermore, traditional presentation tools such as Microsoft
methods, visualizations, input controls) can be instantiated from a
PowerPoint, or even Tableau’s story points, force the analyst to lin-
global repository, or new ones programmed and shared, either by
earize a rich and branching analysis process into a flat sequence.
inheriting from a prototype or written from scratch. Instantiating a
Linking the information cells of the dynamic insight hierarchy to
component will insert the prototype code in the notebook. This way,
presentation views effectually creates hierarchical presentations,
components can be edited or reconfigured in the notebook anytime.
further supporting C2. In our concept, it is simply the insight hi-
The configuration of a component contains input mappings as well
erarchy that defines the hierarchy of the report. Instead of merely
as the current state of the component.
being able to go backwards and forwards in the presentation se-
quence, our hierarchical approach also provides “up” and “down” The component model allows for the interactive pipeline abstrac-
operations that will roll-up and drill-down into the hierarchy, re- tion in our system (Figure 1c) showing the data flow between com-
spectively (Figure 3). This way, the reader can lower or raise the ponents. The pipeline supports both component configuration and
abstraction level as needed. To support interactive reading, presen- inspection of views (cf. Figure 9). With InsideInsights, we also ex-
tation views remain interactive such that readers can explore the tend the core functionality of Vistrates by introducing composite
visualizations, and the annotation cells will then adapt to user in- components, which allow users to build hierarchical pipeline parts
teraction by changing to active or inactive. Hierarchical presenta- that can be collapsed or open as seen in Figure 4. Besides help-
tions can be explored directly in the workspace interface where the ing to structure the pipeline in a meaningful way, these composite
insight hierarchy is constructed, but it is also possible to create ded- components also allow users to share and instantiate a set of pre-
icated presentation interfaces that support different types of review configured components. We will return to the implementation of
experiences and controls (Figure 3). composite components in section 4.4. To ease the understanding of
c 2019 The Author(s)
Computer Graphics Forum c 2019 The Eurographics Association and John Wiley & Sons Ltd.A. Mathisen et al. / InsideInsights: Integrating Data-Driven Reporting in Collaborative Visual Analytics
the pipeline, we also automatically distinguish between four high-
level component types. Dark components are data sources, which
include both data as well as parameter inputs. Green components
are visualizations, and light components are computations with
no view, such as a filter or a k-means clustering algorithm. The
Figure 5: Creating an annotation cell linked to a component state
unfilled components are composites. A key strength of our sys-
can be done simply using the pen icon on the specific component.
tem is the ability to seamlessly switch between working in the In-
Whenever the state of the component changes active (orange dots)
sideInsights interface and developing components with the under-
and inactive (grey dots) annotations update accordingly.
lying notebook interface. It is the individual components that de-
cide what is piped downstream, but a typical visualization compo-
A Bottom-Up B Top-Down
nent will output the current selection and store this as its state. The
generality of our approach is inherited from the generality of the 1
underlying component model. In essence, there is no restriction on
2
what a component can do as long as it adheres to the general tem-
plate. Still, the integrated data-driven reporting design can also be
implemented with other analysis systems.
2 1
1 2 1 2
Figure 6: Illustration of bottom-up (a) vs. top-down (b) analysis
workflows as supported by InsideInsights. In (a) multiple annota-
Figure 4: Part of a pipeline showing a clustering component that
tions are summarized in a new parent, and in (b) a high-level goal
takes as input a parameter K . The resulting centroids are visual- is further specified with a new child.
ized in Centroid Vis . The components have been grouped into two
(currently open) composites . performed in both top-down and bottom-up fashion (Figure 6). For
top-down, the user may create annotation cells with merely textual
or rich media content that are not yet linked to any analysis state
At any point when constructing the pipeline, the analyst can cap-
or presentation view. In the confirmatory fashion of a top-down
ture important insights in the data by creating an annotation cell to
approach, such cells would describe high-level hypotheses about
describe specific component. The full provenance of the analysis,
the data. A series of conceptual split operations would populate
i.e., the states of the previous components in the pipeline, is auto-
these hypotheses with annotation cells as children, and this process
matically maintained in the background. We describe this in detail
would be repeated until the analyst can anchor each claim in ac-
in Section 4.4. Annotation cells can contain any HTML content,
tual data. For a bottom-up, exploratory approach, the analyst would
similar to text cells in, e.g., Observable [Obs18]. As mentioned in
instead let the data itself guide them, surfacing specific low-level
Section 3.3, annotations about the same component are by default
insights in the dataset and then letting these be gradually aggre-
grouped together in the hierarchy, and the different annotations are
gated into higher-level findings using annotation cells in concep-
then represented as dots (see Figure 5). Orange dots are active an-
tual merge operations. Specifically, the hierarchy can be extended
notations and grey are inactive. Unless the annotations describe the
by selecting an existing cell and append a child (Figure 6b), or by
exact same set of states (cf. subsection 4.4), usually only one anno-
selecting multiple cells and append a parent (Figure 6a). Alterna-
tation will be active at the time, and thus be the visible one. Oth-
tively, the pen icon on a component is a shortcut for creating an
erwise, the latest active annotation will be visible as default, and
annotation cell that is linked to that component (cf. Figure 5). We
the user can browse both active and inactive annotations. When the
expect that a practical analysis and authoring session in InsideIn-
component states change, the active and inactive annotations will
sights will alternate between both of these modes. Thus, an existing
update accordingly, surfacing the current active annotation. While
cell can at any point be selected and moved around in the hierarchy.
it is not possible to split up these groups in the current prototype, it
is trivial to implement. Alternatively, annotation cells without links Analysts can also link a presentation view to an annotation cell.
to any component states can also be created in the hierarchy. We currently support two view types: (1) the analysis pipeline it-
self, configured with certain composites open or closed, or (2) a
canvas with selected component views, such as a single full-screen
4.2. Part B: Develop Insight Hierarchy
visualization or a dashboard of multiple visualizations, rich media
The dynamic insight hierarchy is always visible, even during anal- and hand-drawn elements (Figure 7). When an annotation cell has a
ysis, on the left side of the screen in our prototype (Figure 1a). This linked presentation view, that view will be shown instead of the full
hierarchy contains all annotation cells, both those that depend on pipeline when reviewing the cell later on (see Part C). This allows
the analysis state (cells with dots above) and cells with general de- the analyst to author external representations that show specific
scriptions. Composing a data-driven report in InsideInsights can be items of interest and hide the complexity of the full pipeline (Fig-
c 2019 The Author(s)
Computer Graphics Forum c 2019 The Eurographics Association and John Wiley & Sons Ltd.A. Mathisen et al. / InsideInsights: Integrating Data-Driven Reporting in Collaborative Visual Analytics
ure 7). To attach a specific cell to a presentation view, users will mechanism of Webstrates. On top of this, Vistrates provides a gen-
first create an empty slide (or canvas) and populate it with items eral component model, a data-flow based execution model, and
from the pipeline as well as rich media (text, images, video, etc). view abstractions such as the pipeline and visualization dashboards.
They can then use the link icon next to the selected cell to connect In theory, any computational or visualization component can be
the presentation view to the cell. programmed using Vistrates. The InsideInsights system extends
the existing technologies with composite components, annotation-
driven provenance tracking, and interactive hierarchical reports.
Composites components are implemented with the classic com-
posite software pattern [Gam95] applied to the existing component
model. Thus, a composite component is a component itself that
contains a list of child components and specifications of their con-
figurations. This way, a composite component can be instantiated
as any other component; which also instantiates child components
with the specified configurations. Already instantiated components
can be combined to form a new composite by the user. Subse-
quently, the user can share the new type of composite through the
component repository.
As components store their configuration and state encoded as
JSON [BMR∗ 19], the provenance tracking in InsideInsights is im-
Figure 7: A presentation slide with two freely arranged views; an plemented using these specifications. The analysis state of compo-
event flow visualization and a prediction accuracy view. The pre- nent X is therefore defined by the state specification of X itself
sentation slide is linked to the bottom narration cell as indicated along with the states of the previous components in the pipeline
by the link icon next to the cell. that X depend on. This way, the pipeline defines a state depen-
dency graph which is automatically maintained by the system. But,
as mentioned previously, the provenance tracking in InsideInsights
4.3. Part C: Share and Review is triggered by user annotations. Thus, not all state changes will re-
sult in an expansion of the state dependency graph; whenever a user
Sharing and reviewing a report in InsideInsights is not a separate
links an annotation to a component, only the relevant states for that
mode; at any point during the exploration process, a user can tra-
insight are appended to the graph. Restoring an analysis state then
verse the growing insight hierarchy, either by clicking on cells or
simply consists of traversing the state dependency graph and update
by using the arrow keys. Sharing an analysis is simply done by
the relevant components. The insight management and provenance
sharing a link to the web-based document—multiple collaborators
tracking—forming the InsideInsights system—is implemented as a
can even modify the same document simultaneously. Having said
meta-package for Vistrates. Along with the state dependency graph,
that, InsideInsights also supports a dedicated presentation mode,
this package maintains annotation and state links along with map-
where the report can be navigated similar to a traditional slideshow
pings between text cells in the underlying notebook and the anno-
and where edit controls are removed. The reviewer can choose to
tation cells of the InsideInsights system. This way, there is a one-
stay on a single level in the hierarchy, and thus read a linear story,
to-one mapping between text cells in the two interfaces.
but a reviewer can also choose to traverse the hierarchy to learn
additional details or abstractions. As mentioned previously, Insid-
eInsights supports bi-directional interaction (Figure 5). Activating
an annotation can be done by clicking the appropriate dot, which 5. Usage Scenarios
will restore the analysis state of that annotation. Vice versa, mod- There are many possible applications for a data-driven reporting
ifying the analysis state (e.g. interacting with a visualization) will system such as InsideInsights. To showcase the breadth of our sys-
update active and inactive annotations, and surface the active ones. tem, we provide two conceptually different application examples:
This way, the visible narrative always match the current analysis
state. Thus, if a reviewer modifies the analysis such that it violates • Crime data analysis: Baltimore crimes data analysis, where
a given reasoning, the insight hierarchy will reflect this by making findings inform the next steps in the analysis, yielding a share-
the involved annotations inactive. able data-driven report. This conceptual scenario illustrates how
a basic workflow can unfold.
• Company event analysis: The development of a method for
4.4. Implementation Details finding companies that may face imminent bankruptcy. The
The InsideInsights system is implemented with standard modern method is based on prior development of new analysis meth-
web technologies (JavaScript, HTML, CSS, etc.) as a top layer on ods in collaboration with the Danish Business Authorities
the existing technology stack consisting of Webstrates [KEB∗ 15], (DBA) [MG17]. This scenario is in part informed by the existing
Codestrates [RNA∗ 17, BRK18], and Vistrates [BMR∗ 19]. Code- collaborative practices at DBA, which involve people with vary-
strates is a JavaScript-based computational notebook that provides ing expertise, and in part by how InsideInsights can foster new
collaborative editing of code through the DOM synchronization collaborative work practices.
c 2019 The Author(s)
Computer Graphics Forum c 2019 The Eurographics Association and John Wiley & Sons Ltd.A. Mathisen et al. / InsideInsights: Integrating Data-Driven Reporting in Collaborative Visual Analytics
5.1. Baltimore Crime Peaks American man killed by Baltimore police. John then notes that the
location of the aggravated assaults coincides with the protests that
Let us follow a fictional crime analyst (John) who has been tasked
followed the funeral. Therefore, he merges the underlying anno-
with analyzing crime peaks in the city of Baltimore, MD. John
tations into a high-level interpretation, noting that the increase in
loads a dataset of 110,074 crimes (data.baltimorecity.gov) from the
burglaries was likely caused by looters taking advantage of the con-
period of 2012 to 2015 into the InsideInsights system with a CSV
fusion of the riots. The resulting analysis is shown in Figure 8.
component. He generates a line chart of crimes over time by first
instantiating an existing composite component from the repository
that consists of three internal components; time-based aggregation, 5.2. Danish Company Event Analysis
a line chart visualization and a data filter. He then configures the
Elina is a fictional analyst at the DBA. The DBA maintains infor-
composite component in the pipeline by selecting the CSV compo-
mation about Danish companies, performing analyses to aid po-
nent as the data source and by specifying property mappings, i.e.,
litical decisions and to catch non-compliant behavior. Elina has
the names of the time and crime count variables. Upon comple-
been tasked with finding early indicators of involuntary closure.
tion, he identifies two large peaks warranting further investigation.
She starts by loading a dataset of 10,005 events into InsideInsights.
He therefore creates two state annotations on the line chart using
Her goal is to develop an analysis method that subsequently can be
the pen icon, one for each crime peak. This way he can focus his
used on other subsets of the database that consist of more than 50
analysis on one peak without having to remember the other.
million events (datacvr.virk.dk/data). Events include business type
The first crime peak occurs on April 27, 2015. John creates updates, board member changes, accountant replacements, etc.
a bar chart of the crime type distribution for the selected date,
Elina quickly realizes that given the status registration event in
which shows large peaks for aggravated assaults and burglaries.
the data, it is not straightforward to define what qualifies as an in-
He quickly annotates both selections. To confirm that the peak is
voluntary closure. Using a bar chart of the different status updates
not only caused by one of the individual crime types, he creates
and their frequency, she creates an initial definition. She adds an-
a line chart of crimes over time separated by crime type. Then he
notations to the visualization selections motivating why these have
merges the state annotations for the crime type visualizations into
been chosen. Further, she merges these into annotations describing
a high-level annotation that describes the intuition and purpose be-
how the definition is currently calculated. Elina then links the high-
hind this additional comparison. He also links the high-level anno-
level annotations to presentation views with the appropriate visu-
tation to a presentation view with the two crime type visualizations
alizations. To check the validity of this definition, Elina shares her
that support this comparison, by organizing the views on a canvas
current work with a domain expert on the registration data. The ex-
and pressing the link icon next to the annotation cell.
pert browses the insight hierarchy aided by the presentations views
John now creates a map visualization where the selected crimes to understand the current definition. To improve the definition, he
are shown. Interestingly, almost all aggravated assaults occur at modifies the visualization selections and adjusts the annotations to
the same location, while burglaries are scattered throughout town. also include companies that have closed due to other involuntary
John finds this pattern curious and annotates both states of the map. closure types than just bankruptcy. Further, he selects the date of
Since the states of the map are linked to previous components, it the outcome to be the first time the companies were warned by the
is easy for John to retrace how he arrived at these findings and un- DBA. Since both the calculation and motivation have been captured
derstand exactly how the visible crimes have been selected. As his in the InsideInsights system, future investigations into troublesome
analysis is set to April 27, John googles this date and finds mul- companies can now easily be performed with the same definition.
tiple articles about the funeral of Freddie Gray, a young African- Elina continues her analysis by envisioning the computational
parts she needs: (1) outcome definition and event filtering, (2) event
aggregation, and (3) event hierarchy and prediction potential visu-
alizations. She creates high-level annotations describing her envi-
sioned analysis, and then repeatedly splits this description into mul-
tiple children that eventually can be realized in the pipeline. After
composing the pipeline for the second and third part of the analysis,
Elina realizes that the initially envisioned hierarchical aggregation
of the raw event sequences is insufficient. The event sequences vary
too much to be efficiently aggregated. Elina therefore develops an-
other version; however, she keeps the first attempt as a subtree to
motivate why the new approach was needed. As the new approach
requires a component not already in the repository, she uses her
current report to coordinate with an internal programmer. The pro-
grammer then implements components that cluster the sequences
and computes high-level events. Elina now uses these components
in her pipeline prior to the hierarchical aggregation. She stores her
Figure 8: Crime peaks analysis document after John’s initial anal- entire exploration using state annotations that she links to each part
ysis session. of the planned analysis. The resulting event flow visualization of
the new model can be seen in Figure 9.
c 2019 The Author(s)
Computer Graphics Forum c 2019 The Eurographics Association and John Wiley & Sons Ltd.A. Mathisen et al. / InsideInsights: Integrating Data-Driven Reporting in Collaborative Visual Analytics
6.2. Expert Feedback & Findings
The tasks were designed to be open-ended since we wanted the par-
ticipants to explore all parts of the system and get their feedback
on its usefulness. Both participants were able to solve the tasks;
however, the open-ended nature of the evaluation resulted in them
employing different approaches in Phase 1. P1 mainly followed the
narrative and observed the attached views and how the pipeline un-
folded, while P2 instead investigated the pipeline and consulted the
narrative only when something was unclear.
In general, both participants were engaged by the dynamic work-
flow of the prototype, and they both felt that there was “great po-
Figure 9: Company event analysis document with an active model tential” in the concept. P2 explicitly mentioned that they would like
that is good for separating the bankrupt (dark) from the normal to spend more time using the prototype. The participant specifically
(light) event sequence flows [MG17]. emphasized that gradually diving into further detail was a nice way
to understand an analysis, either by going down the narration hi-
erarchy or by browsing the pipeline hierarchy. Both participants
pronounced the close link between narrative and analysis useful.
One year later, the DBA has started to collect additional registra- P1 noted that in our prototype, it is hard to navigate both hier-
tion events, and Jenna is accordingly tasked with revising the analy- archies (narration and pipeline) at once since they do not necessar-
sis. She goes through Elina’s annotations, motivations, and descrip- ily align. While this provides freedom to develop many complex
tions to gain an understanding of the current method. She quickly types of data reports, it is “freedom under responsibility,” as P2
identifies where to modify the analysis and begins her work. Be- said. This complexity also manifested itself when the participants
cause the narrative is linked to the program, she can easily update found a lack of additional explanations in certain parts of the analy-
old motivations that no longer hold true for the updated analysis. sis in Phase 1. In addition, P1 found it confusing when the narration
changed perspective between method annotations (how) and analy-
sis result annotations (what). The participant suggested to explicitly
6. Expert Review provide how, what, and why annotations—similar to the structured
We conducted an expert review of the InsideInsights system with tagging in CommentSpace [WHHA11]—and allow the user to ex-
two experienced visualization researchers: an associate professor plicitly choose a certain perspective to read, or to have different
of computer science with 15 years of experience (P1), and a visual narratives for different audiences. Having explicit annotation types
analytics specialist employed in industry for the past 3 years fol- could also support authors in developing the narration, as it would
lowing his Ph.D. (P2). Our goal was to gather early feedback and highlight what has already been described and what is missing.
insights on the potential use of the integrated data-driven report- Overall, the participants also noted that the current InsideIn-
ing functionalities. We chose an expert review because qualitative sights prototype has usability limitations. Some interactions still
methods are generally better suited to capturing the form of high- have latency due to the size of the datasets and the complexity of
level sensemaking tasks typically performed using exploratory data the pipeline. However, these issues can be resolved by optimizing
analysis [Car08, Pla04], and expert reviews in particular have been the underlying analysis system, as well as by offloading computa-
shown to be effective for visualization evaluation [TM05]. tion onto the server. Other usability issues arise when the analyti-
cal components in InsideInsights did not offer functionality desired
by the participants. P1 also suggested providing a more restricted
6.1. Method
(or guided) interaction to assist novices. Once more experience is
Each session was structured in two phases. In Phase 1, partici- gained, novices can then move on to the full system.
pants were given the full report of the company event analysis sce-
nario, and in Phase 2, they were given only the analysis pipeline
7. Discussion & Future Work
of the crime peaks scenario without annotations. For the full report
(Phase 1), the experts were tasked with explaining the analysis and We believe that our proposed system is a first step to better sup-
the interplay between the involved components, modify parameters port existing analysis and reporting workflows. In the following,
to generate a better model, and subsequently summarize what the we will discuss current limitations of our implementation as well
most important events were. For the analysis pipeline in Phase 2, as multiple interesting avenues of future research.
the experts were tasked with exploring the data and building a nar-
ration hierarchy of their insights from scratch. Prior to beginning,
7.1. Limitations
participants were given an introduction to the purpose of our re-
search and a tour of the main features in our prototype. During the While the contribution of our work resides within data-driven re-
phases, the participants were instructed to follow a think-aloud pro- porting, our work requires the scaffolding of an analytical system
tocol. Sessions lasted around an hour and were screen-captured and to provide the necessary functionality. We chose to build on the ex-
voice-recorded. Also, observation notes were collected. isting Vistrates [BMR∗ 19] and Codestrates [RNA∗ 17] frameworks
c 2019 The Author(s)
Computer Graphics Forum c 2019 The Eurographics Association and John Wiley & Sons Ltd.A. Mathisen et al. / InsideInsights: Integrating Data-Driven Reporting in Collaborative Visual Analytics
for this purpose, but our efforts understandably still fall short in 7.3. Towards Literate Analytics
certain aspects compared to mature data analysis systems such as The key contribution of InsideInsights is to bridge data-driven nar-
Tableau. Specifically, user-friendliness of the analysis system was ration, provenance, and collaboration to assist users in organizing
touched upon by the expert reviewers (Section 6). This is a limita- and understanding findings at variable levels of detail. The long-
tion that could be remedied by integrating our data-driven reporting term goal behind our work is to empower users with the ability
method in other analytical environments in the future. In addition, to dynamically structure their analysis to promote comprehension
InsideInsights provides visual feedback about how an annotation of increasingly complex data and algorithms. Similar to how the
connects to the pipeline, but the visual feedback in the reverse di- motivation behind literate programming was to write programs not
rection can be improved. While annotations update when the user only for the sake of the computer but also to promote human under-
interacts with pipeline components, this can happen out of sight of standing [Knu84], there is an increasing focus to promote human
the user when the narration hierarchy becomes sufficiently large. understanding of data analytics [WKM02,CH18,KPN16]. Accord-
To overcome this issue, improved visual indicators for occurring ingly, we think the method presented in this paper is a step on the
changes could make such connections apparent. way to a new paradigm we tentatively call literate analytics.
Another challenge is how to help non-experts navigate the dy- The descendants of literate programming [MP14, WKD19] are
namic insight hierarchy. We currently represent the insight hierar- a testament to the unique way narration and annotation can sup-
chy as indented text cells, but this design may have certain limita- port human comprehension. Literate computing [MP14] extended
tions with respect to scalability. Although collapsing branches of the literate programming concept by combining narrative with ex-
the hierarchy allow users to keep cells of interest within view, in- ecutable code. However, current literate computing solutions (e.g.,
denting cells exceedingly have visual limitations. Thus, exploring notebooks [KRKP∗ 16,Obs18,Goo18,RNA∗ 17]) do not support the
alternative cell layouts or interaction methods becomes important. creation of hierarchical structures within the document—an impor-
On a conceptual level, the grouping of related annotations supports tant concept of literate programming. Our work combines hierar-
the user in keeping the hierarchy of a manageable size, but keeping chies with interactive analytics within the same document.
entirely different analysis paths as subbranches may make the hier-
archy too deep. Supporting the user to maintain different variations The goal in our notion of literate analytics is to document the en-
of a story may be a way to address this limitation, e.g., by having tire data analysis rationale, including insights about the method and
several hierarchies or utilize different cell types (cf. Section 6.2). In the data as well as interpretations. While our method support the
other words, our novel integration of data-driven reporting is also capturing of such documentation, our expert review revealed that
yielding interesting design challenges for future work. it is also important to support completeness of the documentation.
In general, we characterize literate analytics as integrated narration
Finally, our experts also noted that the freedom afforded by and analysis. This integration is manifested in the concept of live
InsideInsights can be a burden to the analyst, and that some documentation, where annotations always match the state of the
structured guidance would be helpful. Supporting insight genera- analysis they aim to describe, and thus enable interactive reading
tion [CBYE18, WMA∗ 16] and automatically inferring visual an- of data analytics. To support this, it becomes important that users
alytic activities from user interactions [GZ09] are already active understand how the documentation changes when interacting with
research focuses. Combining these methods with support for gen- the analysis, which is another aspect where our current approach
erating comprehensive annotations could be interesting. can be extended. In addition, literate analytics aims to support doc-
umentation throughout the process such that the current progress
7.2. Implications for Visual Analytics at any time can be shared and replicated. Although this paper is
only an initial step, we hope that our work will help spark future
Recent developments on interactive notebooks [She14] have set a
discussions about what literate analytics should incorporate.
trend towards reproducible and shareable data analytics. InsideIn-
sights continues this trend by allowing the creation of data-driven
reports that can be accessed by many different users, thereby mak- 8. Conclusion
ing data analytics accessible to a wider audience. The interaction We have proposed InsideInsights, an exploration of the design for
methodology we propose can essentially change how analysts and integrated data-driven reporting, where insights are organized into
stakeholders collaborate by supporting the creation of common an information hierarchy linked to analytic provenance and pre-
ground, which is a vital part of collaborative data analysis [HA08]. sentation views. Our system allows analysts to tag views, items,
While our current prototype is built on top of a collabo- and entire states of a visualization and computational components
rative notebook [RNA∗ 17] and a visual analytics component with annotations as part of their analysis. We have also presented
model [BMR∗ 19], the design itself is independent of any data anal- two scenarios and results from an expert review to demonstrate the
ysis system that exposes its internal state. This can be achieved in validity of the idea. The novel combination of literate computing,
at least two general ways: either by directly supporting provenance provenance tracking, and storytelling elements have the potential to
tracking through an API to navigate and reactivate states, or by ex- bridge the gap between data analysis and reporting, thus pointing
posing declarative specifications for the internal state, such as as towards a new paradigm we tentatively call “literate analytics.”
in Vega [SWH14] and Vega-lite [SMWH17b]. The latter is exactly
the type of system our current prototype is built upon. By exposing Acknowledgments
their internal state in this way, future data analytics applications can This work was supported by the DABAI project (IFD-5153-
more easily become part of larger data analysis ecologies. 00004B), the Stibo travel grant, and the DFG grant DA 1319/3-3.
c 2019 The Author(s)
Computer Graphics Forum c 2019 The Eurographics Association and John Wiley & Sons Ltd.You can also read