VOLUME 4.5 TRANSMISSION AND DISTRIBUTION ANALYSIS KANSAS CITY POWER & LIGHT COMPANY (KCP&L) INTEGRATED RESOURCE PLAN 4 CSR 240-22.045 APRIL, 2015 ...
←
→
Page content transcription
If your browser does not render page correctly, please read the page content below
VOLUME 4.5
TRANSMISSION AND
DISTRIBUTION ANALYSIS
KANSAS CITY POWER & LIGHT
COMPANY (KCP&L)
INTEGRATED RESOURCE PLAN
4 CSR 240-22.045
APRIL, 2015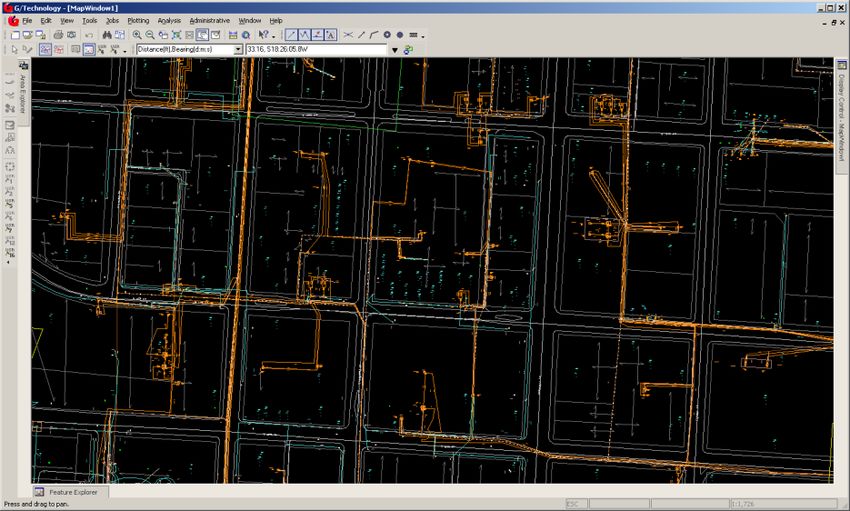
TABLE OF CONTENTS

SECTION 1: ADEQUACY OF THE TRANSMISSION AND
           DISTRIBUTION NETWORKS .................................................................... 2
 1.1    OPPORTUNITIES TO REDUCE TRANSMISSION POWER
        AND ENERGY LOSSES ................................................................................... 2
   1.1.1 DISTRIBUTION SYSTEM OVERVIEW ........................................................ 5
   1.1.2 ANNUAL SCOPE OF WORK....................................................................... 8
 1.2    ASSESMENT OF INTERCONNECTING NEW FACILITIES ........................... 26
 1.3    ASSESSMENT OF TRANSMISSION UPGRADES FOR
        POWER PURCHASES ................................................................................... 27
 1.4    ASSESSMENT OF TRANSMISSION OR DISTRIBUTION
        IMPROVEMENTS WITH RESPECT TO COST
        EFFECTIVENESS OR DSM OR SUPPLY-SIDE RESOURCES ..................... 29
   1.4.1 CAPACITOR AUTOMATION EFFORTS.................................................... 29
   1.4.2 DYNAMIC VOLTAGE CONTROL .............................................................. 31
SECTION 2: AVOIDED TRANSMISSION AND DISTRIBUTION COST ........................ 33
 2.1  IMPACT OF DSM ON DISTRIBUTION EXPANSION ...................................... 33
SECTION 3: ANALYSIS OF TRANSMISSION NETWORK PERTAINENT
           TO A RESOURCE ACQUISITION STRATEGY........................................ 35
 3.1    TRANSMISSION ASSESSMENTS ................................................................. 35
   3.1.1 TRANSMISSION ASSESSMENT FOR CONGESTION
          UPGRADES .............................................................................................. 35
   3.1.2 TRANSMISSION ASSESSMENT FOR ADVANCE
          TECHNOLOGIES ...................................................................................... 38
   3.1.3 AVOIDED TRANSMISSION COST ESTIMATE ......................................... 39
   3.1.4 REGIONAL TRANSMISSION UPGRADE ESTIMATE ............................... 40
   3.1.5 REVENUE CREDITS ESTIMATE .............................................................. 41
   3.1.6 TIMING OF NEEDED RESOURCES ESTIMATE ...................................... 43
 3.2    USE OF RTO TRANSMISSION EXPANSION PLAN ...................................... 44
   3.2.1 UTILITY PARTICIPATION IN RTO TRANSMISSION PLAN ...................... 44
   3.2.2 ANNUAL REVIEW OF RTO EXPANSION PLANS .................................... 45
   3.2.3 ANNUAL REVIEW OF SERVICE TERRITORY EXPANSION
          PLAN ......................................................................................................... 46
   3.2.4 DOCUMENTATION AND DESCRIPTION OF ANNUAL
          REVIEW OF RTO OVERALL AND UTILITY-SPECIFIC
          EXPANSION PLANS ................................................................................. 46
   3.2.5 AFFILIATE BUILD TRANSMISSION PROJECT
          DISCUSSION ............................................................................................ 47
 3.3    RTO EXPANSION PLAN INFORMATION....................................................... 48
 3.4    TRANSMISSION UPGRADES REPORT ........................................................ 49
   3.4.1 TRANSMISSION UPGRADES REPORT – PHYSICAL
          INTERCONNECTION WITHIN RTO .......................................................... 49

Volume 4.5: Transmission and Distribution Analysis                                                                Page i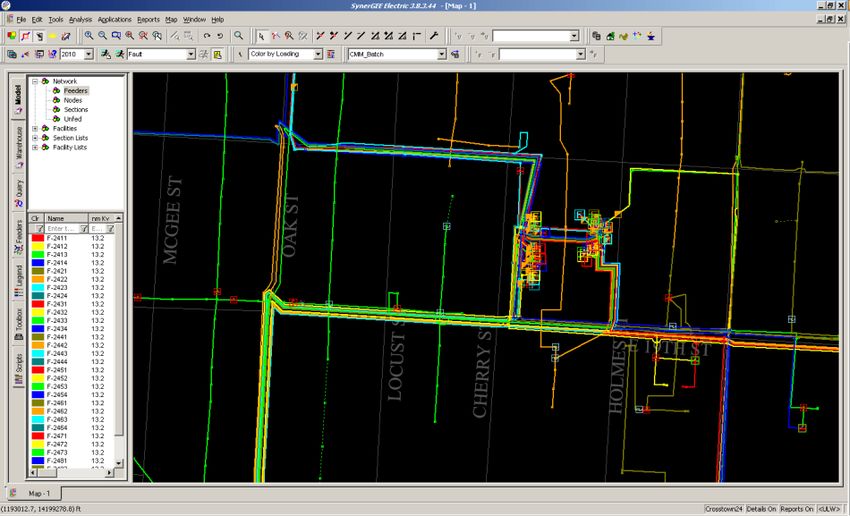
3.4.2      TRANSMISSION UPGRADES REPORT – DELIVERABILITY
                 ENHANCEMENT WITHIN RTO ................................................................. 50
      3.4.3      TRANSMISSION UPGRADES REPORT – PHYSICAL
                 INTERCONNECTION OUTSIDE RTO ....................................................... 51
      3.4.4      TRANSMISSION UPGRADES REPORT – DELIVERABILITY
                 ENHANCEMENT OUTSIDE RTO .............................................................. 51
      3.4.5      TRANSMISSION UPGRADES REPORT – ESTIMATE OF
                 TOTAL COST ............................................................................................ 51
      3.4.6      TRANSMISSION UPGRADES REPORT – COST
                 ESTIMATES .............................................................................................. 53
SECTION 4: ADVANCED TECHNOLOGY ANALYSIS .................................................. 54
 4.1    TRANSMISSION UPGRADES FOR ADVANCED
        TRANSMISSION TECHNOLOGIES................................................................ 54
 4.2    DISTRIBUTION UPGRADES FOR ADVANCED DISTRIBUTION
        TECHNOLOGIES ........................................................................................... 54
 4.3    OPTIMIZATION OF INVESTMENT IN ADVANCED
        TRANSMISSION AND DISTRIBUTION TECHNOLOGIES ............................. 55
   4.3.1 OPTIMIZATION OF INVESTMENT – TOTAL COSTS AND
           BENEFITS ................................................................................................. 55
   4.3.2 OPTIMIZATION OF INVESTMENT – COST OF
           ADVANCED GRID INVESTMENTS........................................................... 56
   4.3.3 OPTIMIZATION OF INVESTMENT – COST OF NON-
           ADVANCED GRID INVESTMENTS........................................................... 56
   4.3.4 OPTIMIZATION OF INVESTMENT – REDUCTION OF
           RESOURCE COSTS ................................................................................. 57
   4.3.5 OPTIMIZATION OF INVESTMENT – REDUCTION OF
           SUPPLY-SIDE COSTS.............................................................................. 57
 4.4    COST EFFECTIVENESS OF INVESTMENT IN ADVANCED
        TRANSMISSION AND DISTRIBUTION TECHNOLOGIES ............................. 57
   4.4.1 COST EFFECTIVENESS – INCREMENTAL COSTS
           ADVANCED GRID TECHNOLOGIES VS NON-ADVANCED
           GRID TECHNOLOGIES ............................................................................ 57
   4.4.2 COST EFFECTIVENESS – INCREMENTAL BENEFITS
           ADVANCED GRID TECHNOLOGIES VS NON-ADVANCED
           GRID TECHNOLOGIES ............................................................................ 58
   4.4.3 OPTIMIZATION OF INVESTMENT – NON-MONETARY
           FACTORS ................................................................................................. 58
   4.4.4 OPTIMIZATION OF INVESTMENT – SOCIETAL BENEFIT ...................... 58
   4.4.5 OPTIMIZATION OF INVESTMENT – OTHER UTILITY-
           IDENTIFIED FACTORS ............................................................................. 59
   4.4.6 OPTIMIZATION OF INVESTMENT –OTHER NON-UTILITY
           IDENTIFIED FACTORS ............................................................................. 59
 4.5    NON-ADVANCED TRANSMISSION AND DISTRIBUTION
        INCLUSION .................................................................................................... 60

Volume 4.5: Transmission and Distribution Analysis                                                                Page ii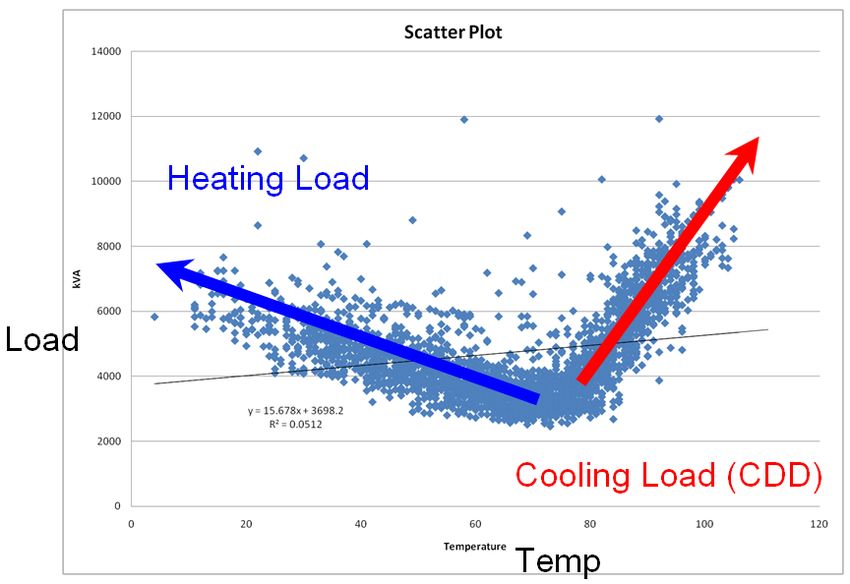
4.5.1 NON-ADVANCED TRANSMISSION AND DISTRIBUTION
           REQUIRED ANALYSIS ............................................................................. 60
    4.5.2 NON-ADVANCED TRANSMISSION AND DISTRIBUTION
           ANALYSIS DOCUMENTATION ................................................................. 60
  4.6    ADVANCED TRANSMISSION AND DISTRIBUTION
         REQUIRED COST-BENEFIT ANALYSIS ........................................................ 61
    4.6.2 ADVANCED GRID TECHNOLOGIES UTILITY’S EFFORTS
           DESCRIPTION .......................................................................................... 61
    4.6.3 DISTRIBUTION ADVANCED GRID TECHNOLOGIES
           IMPACT DESCRIPTION ............................................................................ 69
SECTION 5: UTILITY AFFILIATION.............................................................................. 72
SECTION 6: FUTURE TRANSMISSION PROJECTS ................................................... 74

Volume 4.5: Transmission and Distribution Analysis                                                        Page iii
TABLE OF TABLES
Table 1: Cost Analysis for 161kV Transmission Line Loss Reduction .................. 4
Table 2: SPP 2015 Transmission Losses by Area ................................................ 5
Table 3: Distribution Planning - Annual Scope of Work ........................................ 9
Table 4: SPP Projected ATRR Allocated to KCP&L............................................ 40
Table 5: KCP&L Transmission Service Revenues from SPP .............................. 43
Table 6: KCP&L Transmission Upgrades 2015 SPP STEP ................................ 52
Table 7: Transmission Upgrade Cost Allocated to KCP&L ................................. 53
TABLE OF FIGURES
Figure 1: PI Screenshot ...................................................................................... 10
Figure 2: G/Tech Screenshot .............................................................................. 11
Figure 3: SynerGEE Screenshot ......................................................................... 12
Figure 4: Example of Weather-Adjustment Scatter Plot ...................................... 13
Figure 5: Example Scatter Plot after data filtered to show collating loads ........... 15
Figure 6: Cumulative Distribution Plot - 95% certainty at 100 degrees F .......... 15
Figure 7: Screenshot from Cable De-rating Program .......................................... 17
Figure 8 ............................................................................................................... 25
Volume 4.5: Transmission and Distribution Analysis Page ivTABLE OF APPENDICES Appendix 4.5 - 3.3A: 2009 SPP Balanced Portfolio Report Appendix 4.5 - 3.3B: SPP Priority Projects Phase II Report Appendix 4.5 - 3.3C: SPP 2013 ITP20 Report Appendix 4.5 - 3.3D: SPP 2015 ITP10 Report Appendix 4.5 - 3.3E: SPP 2015 ITPNT Assessment Appendix 4.5 - 3.3F: 2015 STEP Report Appendix 4.5 – 3.3G: 2015 STEP Project List Appendix 4.5.A: Spatial Electric Load Forecast (Electric Vehicle Study) Appendix 4.5.B: KCPL Electric System Loss Analysis Appendix 4.5.C: KCPL Green Circuits Analysis Appendix 4.5.D: KCPL Green Impact Zone SmartGrid Demonstration Volume 4.5: Transmission and Distribution Analysis Page v
INDEX OF RULE COMPLIANCE

       22.045 Transmission and Distribution Analysis
          (1) (A) ................................................................................................. 2
          (1) (B) ............................................................................................... 24
          (1) (C) ............................................................................................... 25
          (1) (D) ............................................................................................... 27
          (2)).................................................................................................... 31
          (3) (A) ............................................................................................... 33
          (3) (A) 1. ........................................................................................... 33
          (3) (A) 3. ........................................................................................... 37
          (3) (A) 4. ........................................................................................... 38
          (3) (A) 5. ........................................................................................... 39
          (3) (A) 6. ........................................................................................... 41
          (3) (A)2. ............................................................................................ 36
          (3) (B) ............................................................................................... 42
          (3) (B) 1. ........................................................................................... 42
          (3) (B) 2. ........................................................................................... 43
          (3) (B) 3. ........................................................................................... 44
          (3) (B) 4. ........................................................................................... 44
          (3) (B)5. ............................................................................................ 45
          (3) (C) ............................................................................................... 46
          (3) (D) ............................................................................................... 47
          (3) (D) 1. ........................................................................................... 47
          (3) (D) 2. ........................................................................................... 48
          (3) (D) 3. ........................................................................................... 49
          (3) (D) 4. ........................................................................................... 49
          (3) (D) 5. ........................................................................................... 49
          (3) (D) 6. ........................................................................................... 51
          (3)).................................................................................................... 33
          (4) ..................................................................................................... 52
          (4) (A) ............................................................................................... 52
          (4) (B) ............................................................................................... 52
          (4) (C) ............................................................................................... 53
          (4) (C) 1. ........................................................................................... 53
          (4) (C) 1. A. ....................................................................................... 54
          (4) (C) 1. B. ....................................................................................... 54
          (4) (C) 1. C. ...................................................................................... 55
          (4) (C) 1. D. ...................................................................................... 55
          (4) (C) 2. ........................................................................................... 55
          (4) (C) 2. A. ....................................................................................... 55

Volume 4.5: Transmission and Distribution Analysis                                                                   Page vi
(4) (C) 2. B. ....................................................................................... 56
(4) (C) 2. C. ...................................................................................... 56
(4) (C) 3. ........................................................................................... 56
(4) (C) 3. A. ....................................................................................... 56
(4) (C) 3. B. ....................................................................................... 56
(4) (C) 3. C. ...................................................................................... 57
(4) (C) 3. D. ...................................................................................... 57
(4) (C) 4. ........................................................................................... 57
(4) (C) 5. ........................................................................................... 57
(4) (D) ............................................................................................... 58
(4) (D) 1. ........................................................................................... 58
(4) (D) 2. ........................................................................................... 58
(4) (E) ............................................................................................... 59
(4) (E) 1. ........................................................................................... 59
(4) (E) 2. ........................................................................................... 67
(5) ..................................................................................................... 70
(6) ..................................................................................................... 72
Volume 4.5: Transmission and Distribution Analysis Page viiVOLUME 4.5: TRANSMISSION AND DISTRIBUTION
ANALYSIS
HIGHLIGHTS
KCP&L’s transmission losses as a percent of peak load served are low
relative to the SPP footprint as a whole.
SPP identified one economic project in the KCP&L footprint through its
2015 ITP10 process – a voltage conversion of the Iatan – Stranger Creek
161 kV transmission line to 345 kV. A need date was set at 1/1/2019.
SPP identified one reliability project in the KCP&L footprint through its
2015 ITPNT process – an upgrade to the 161/69 kV transformer at South
Waverly. A need date was set at 6/1/2015.
A total of five transmission projects have been identified in the KCP&L
territory, with need dates between 2015 and 2033.
PURPOSE: This rule specifies the minimum standards for the scope and
level of detail required for transmission and distribution network analysis
and reporting.
Volume 4.5: Transmission and Distribution Analysis Page 1SECTION 1: ADEQUACY OF THE TRANSMISSION AND DISTRIBUTION NETWORKS (1) The electric utility shall describe and document its consideration of the adequacy of the transmission and distribution networks in fulfilling the fundamental planning objective set out in 4 CSR 240-22.010. Each utility shall consider, at a minimum, improvements to the transmission and distribution networks that— 1.1 OPPORTUNITIES TO REDUCE TRANSMISSION POWER AND ENERGY LOSSES (A) Reduce transmission power and energy losses. Opportunities to reduce transmission network losses are among the supply-side resources evaluated pursuant to 4 CSR 240-22.040(3). The utility shall assess the age, condition, and efficiency level of existing transmission and distribution facilities and shall analyze the feasibility and cost-effectiveness of transmission and distribution network loss-reduction measures. This provision shall not be construed to require a detailed line-by-line analysis of the transmission and distribution systems, but is intended to require the utility to identify and analyze opportunities for efficiency improvements in a manner that is consistent with the analysis of other supply-side resource options; Electrical losses in a transmission line are primarily dependent on the specific characteristics of the line (conductor type, line length, etc.) and the amount of power flowing (I2R) on the transmission line. KCP&L uses 161 kV transmission lines (approximately 1000 miles) for the majority of its load serving substations. Most of KCP&L’s existing 161 kV transmission lines use a single 1192 ACSR conductor per phase on H-frame wood structures. This design provides a normal line rating of 293 Mva and an emergency rating of 334 Mva for summer conditions. For increased transmission capability and lower line losses, KCP&L Transmission Engineering recommended using a line design with two, 1192 Volume 4.5: Transmission and Distribution Analysis Page 2
ACSR conductors per phase on H-frame wood or steel structures. This design
provides a normal line rating of 586 Mva and an emergency rating of 668 Mva for
summer conditions. Adding the additional conductor per phase reduces the
line’s electrical resistance by half and results in reduced transmission losses.
Transmission Engineering estimated the cost to rebuild a single conductor per
phase line to a two conductor per phase line at $862,200 per mile.

In order to “analyze the feasibility and cost-effectiveness of transmission network
loss-reduction measures”, KCP&L Transmission Planning staff analyzed the
costs and loss reductions associated with rebuilding five of KCP&L’s most
heavily loaded 161kV transmission lines. This analysis involved calculating new
impedances values for the five transmission lines converted from single 1192
conductor to bundled 1192 conductors and performing a loadflow analysis to
determine the level of loss reduction for the rebuilt lines. Results of this analysis
for 2015 summer peak conditions are shown in Table 1, below.

Volume 4.5: Transmission and Distribution Analysis                             Page 3
Table 1: Cost Analysis for 161kV Transmission Line Loss Reduction
 TRANSMISSION LINES    2015 SP        LINE IMPEDENCE         LINE
                         Flow
   FROM        TO        MW          R         X       B     MILE
                                     1192 ACSR CONDUCTOR
MARTCTY5    STHTOWN5     203.2    0.00339   0.02230 0.01170   7.76
WGARDNR5    MOONLT 5     197.4    0.00188   0.01692 0.00928   6.04
RNRIDGE5    NASHUA-5      169     0.00202   0.01750 0.00930   6.10
CRAIG 5     LENEXAN5     162.8    0.00100   0.00840 0.00460   3.00
STILWEL5    HICKMAN5     159.4    0.00460   0.03870 0.02050  13.54
                                 TOTAL KCP&L LOSSES AT PEAK LOAD          65.2

                                 1192 BUNDLED CONDUCTOR
MARTCTY5    STHTOWN5      236     0.00170 0.01115  0.01630    7.76
WGARDNR5    MOONLT 5     217.6    0.00094 0.00846  0.01268    6.04
RNRIDGE5    NASHUA-5     202.4    0.00101 0.00875  0.01281    6.10
CRAIG 5     LENEXAN5     179.6    0.00050 0.00420  0.00630    3.00
STILWEL5    HICKMAN5     200.5    0.00230 0.01935  0.02843   13.54
                                 TOTAL KCP&L LOSSES AT PEAK LOAD          63.1

MW LOSS REDUCTION using 1192 BD conductor in KCP&L                        2.10

TOTAL LINE MILES                                                          42.5
TOTAL COST TO RECONDUCTOR/REBUILD AT $862,200 PER MILE               $36,626,256

AVERAGE COST OF LOSS REDUCTION                       $/KW             $17,441

The average cost of loss reduction for these five transmission lines is
$17,441/kw. This is approximately five times the average $/kw construction cost
of Iatan 2. Clearly transmission loss reduction is not cost effective for KCP&L
when compared to the cost of construction for new supply side resources. This
is mainly due to the fact that KCP&L already has a relatively low loss
transmission system.

The KCP&L transmission system is a relatively low loss network due to good line
design, concentration of load, and the distribution of its generation resources
throughout its service territory. As shown in Table 2, KCP&L’s projected
transmission loss as a percent of peak load served for 2015 summer peak load
conditions is only 1.7%. The comparative value for the rest of the Southwest
Power Pool (SPP) is 2.43%.

Volume 4.5: Transmission and Distribution Analysis                               Page 4
Table 2: SPP 2015 Transmission Losses by Area AREA Load Mw Loss Mw % Loss 515 667.3 20.6 3.1% 520 10168.0 234 2.3% 523 1102.0 21.8 2.0% 524 6197.7 136.6 2.2% 525 1568.4 44.1 2.8% 526 6252.7 201 3.2% 527 356.8 0.4 0.1% 531 440.9 9 2.0% 534 1302.4 33.7 2.6% 536 5817.2 133.4 2.3% 540 2054.5 29.9 1.5% KCP&L 3942.8 65.2 1.7% 542 501.7 2.2 0.4% 544 1138.9 31 2.7% 545 306.3 2.5 0.8% 546 772.4 10.5 1.4% 640 3778.7 140.7 3.7% 645 2787.0 34.6 1.2% 650 766.7 8.7 1.1% SPP 49922.4 1159.7 2.3% 1.1.1 DISTRIBUTION SYSTEM OVERVIEW The various KCP&L planning groups (Supply, Transmission, and Distribution) assimilates a broad set of engineering inputs to determine how the company will invest in improving the respective systems to meet ongoing load growth, system reliability, operational efficiency and asset optimization needs. The Distribution Planning group analyzes data, identifies patterns, develops electrical models representative of the KCP&L distribution system, and performs studies to understand and prioritize system improvement needs. The inner urban core can be characterized by high utilization of its distribution assets and its aging infrastructure. Reliability risk in this area is addressed by installing replacement or contingency infrastructure. The distribution system over many decades has been built by adding only enough capacity to serve immediate load requirements. These types of problems have been categorized Volume 4.5: Transmission and Distribution Analysis Page 5
as condition or contingency, and specific recognizable projects like Troost
Substation and the Twelfth Street Duct Bank Reconstruction are good examples
of this type of investment.

In contrast are the suburban areas of the KCP&L system, where new
development of open land requires the build-out of the distribution system. The
highest load growth is seen on the fringe, demanding investments to serve new
emerging electrical loads – largely a capacity issue. Circuits must be tied
together more effectively to allow for contingency switching and disperse the load
across a larger number of circuits, all the while expanding substation breaker
positions for these new circuits. Many investments like this have been made in
recent years, especially around Tiffany Springs, Cedar Creek, and Riley
Substations.

The rural areas have the most widespread infrastructure components and have
the fewest or most limited emergency ties, where any load manipulation can
cause large disturbances to customers’ voltage. Distribution Planning carefully
examines these systems to assure customer voltages are within tolerance, a
process which demands high-quality mapping and device load data. With so
many widespread components, acquiring data has become one of the greatest
challenges in these areas.

 The Distribution Planning group is tasked with elevating the highest priority and
highest-risk projects to a point where investments are made earlier than those
with lower priorities and risk profiles. Many years of constant review have
provided the group with a robust set of criteria within which these problems are
evaluated, and even today process improvements are being made to further
analyze how well to build out the distribution system to assure cost-effectiveness.

Furthermore, the Long-Term Planning component handled by Distribution
Planning assures strategic long-term investments are made. Solutions are
selected based upon how well they fit into an area-plan, not only the cost-
effectiveness for the immediate need. Between the robust planning criteria and

Volume 4.5: Transmission and Distribution Analysis                            Page 6
the strategic long-term vision, Distribution Planning will continue to construct the
distribution system capable of serving tomorrow’s needs by making appropriate
investments when they are needed.

In the inner-urban core of Kansas City, the long-term vision involves installing
replacement substation assets in new locations to strategically phase-out
deteriorated underground components, improve reliability, and provide additional
area capacity. Components nearing the end of their useful life can then be
abandoned, removed, or rebuilt, and the company will have an upgraded
distribution system better suited to reliably serve the inner-urban core of Kansas
City well into the future. The Charlotte Substation and associated duct bank
projects have been budgeted in the five-year plan and will continue to have
components critical to the long term strategy over the next twenty years.

On the suburban fringe, Distribution Planning plots out growth patterns to
identify substation sites well ahead of the need. On the Northern edge of the
Metro Area, several substation sites have already been purchased in anticipation
of future load growth. Distribution Planning constantly reviews the build-out of
the distribution system on the suburban fringe as development in Kansas City
continues this march North, South, and East of the current Metro Area.

The rural areas of the service territory are envisioned to one day have entirely
remotely-received load and condition data – a completely automated system.
Today, load information is difficult to obtain, due to inaccurate watt-var charts or
costly field load checks during peak periods. Strategic and timely decisions can
better be made with abundant characteristic data for the components being
studied. Efforts are underway to systematically bring all rural components up to
metro-area data acquisition standards.

As KCP&L builds toward its own future here in Kansas City, it is the goal of
Distribution Planning to assure that every investment optimizes capital spend and
balances risk, meets current and future needs, and is built strategically when and
where they are needed.

Volume 4.5: Transmission and Distribution Analysis                             Page 7
1.1.2   ANNUAL SCOPE OF WORK

Throughout each year, Distribution Planning prepares a number of system
studies to determine weaknesses or risks to reliability and to assess the overall
adequacy of our distribution system. The majority of the work focuses on
increasing reliability and prioritizing work based upon cost, scope, impact, and
effectiveness. This work is centered around four (4) specific areas which include
capacity, contingency, voltage and condition. The table below illustrates the
various deliverables associated with each focus area:

Volume 4.5: Transmission and Distribution Analysis                          Page 8
Table 3: Distribution Planning - Annual Scope of Work
Study Name Deliverable
Category
Capacity Load Preservation Black Start Plan
5 Yr. System Expansion – Budgetary
Load Recommendations
Device Weather Distribution Load Book
Adjustment Forecasted Substation
20 Year Forecast Loads
Circuit Rating Study Circuit Rating utilized for
Operational Guidance
Contingency 5 Yr. System Expansion – Budgetary
contingency Recommendations
N-1 Circuit Contingency
Study Circuit Contingency Plan
N-1 Transformer Transformer Contingency
Contingency Study Plan
Voltage & Losses Phase Balancing Load-Swap
Voltage Drop Studies Recommendations
System Efficiency Studies DVC Operational Guidance
Capacitor Studies System Loss Studies
Voltage Regulation Studies Capacitor Installations
Substation Tap Settings
Condition Worst Performing Circuits Budgetary
Circuit Review Recommendations
Short Circuit Studies Budgetary
Other Reviews Recommendations
Customer-Required
Special Studies
To complete this identified scope of work, KCP&L Planning Engineers utilize a
variety of tools that make use of the device loads and system schematics as
input. There are several tools currently in use at KCP&L to collect and process
this information.
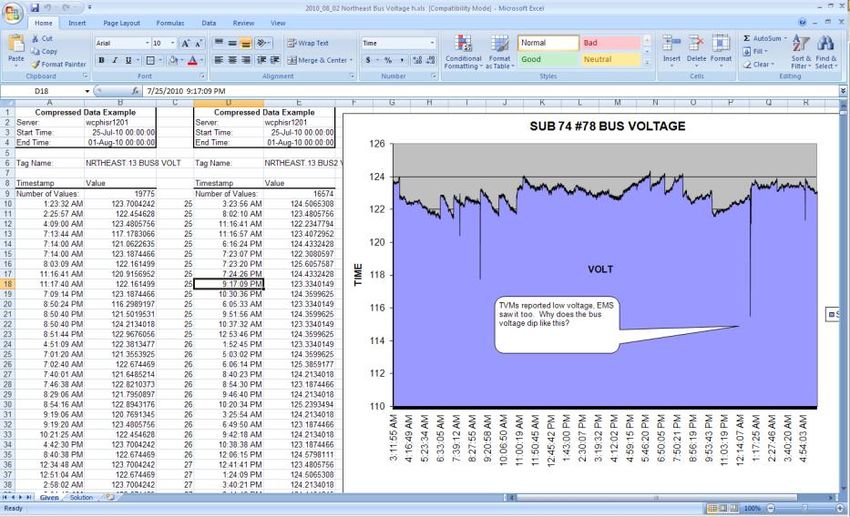
PI/Network Manager
During the summer of 2010, the new Network Manager Energy Management
(SCADA) system was placed in-service. With this ABB product KCP&L also
acquired the PI Historian data archive, which now contains device loads and
other historical system characteristics. Once all system components are merged
into the new system, the PI Historian will be the primary archive for engineers to
Volume 4.5: Transmission and Distribution Analysis Page 9find and extract load and voltage history. The figure below provides a snapshot
of PI Historian.
Figure 1: PI Screenshot
GTechnology
The software mapping tool used by Distribution Planning engineers is called
GTech. The KCP&L distribution system G.I.S. database is viewed and extracted
from GTech, where engineers acquire model data for use in SynerGEE. Device
characteristics and connectivity drive load-flow models in use by Distribution
Planners. The figure below provides a snapshot of G/Tech.
Volume 4.5: Transmission and Distribution Analysis Page 10Figure 2: G/Tech Screenshot Volume 4.5: Transmission and Distribution Analysis Page 11
SynerGEE

A multipurpose tool primarily used by engineers to analyze load flow
characteristics of distribution feeders. Distribution Planning is also responsible
for providing fault current information to customer’s electrical contractors when
performing arc-flash studies, a process which requires the use of SynerGEE.
The figure below provides a snapshot of the SyngerGee software program.

                          Figure 3: SynerGEE Screenshot

Volume 4.5: Transmission and Distribution Analysis                          Page 12
1.1.2.1 Capacity Planning
Device loads, such as substation transformer and distribution circuit loads are
collected annually from a number of remote-sensing sources and are weather-
adjusted to determine the effects of temperature (heating & cooling). This load
data is compared to previous years’ loads and device maximum loading to
determine how the load is changing over time and if any component is
overloaded and in need of an upgrade. These types of problems are given a
higher priority than others to assure continued reliability.
1.1.2.1.1 Device Weather Adjustment
The whole system improvement process begins with Device Weather
Adjustment. There are a number of ways engineering monitors and records the
loads experienced across the distribution system, and however this is done, load
data is gathered and tabulated. The daily peak demand is then compared with
the daily high temperature (for Winter, the daily low temperature), and a
comparison is made using an excel scatter-plot with a linear-regression best-fit
line.
Figure 4: Example of Weather-Adjustment Scatter Plot
Volume 4.5: Transmission and Distribution Analysis Page 13Distribution Planning cleanses the data using filters to assure outlying data points (abnormal behaviors) are omitted from the study. What results is a linear equation, where the variable ‘x’ refers to the temperature. For ‘x’, Distribution Planning inserts 100 degrees Fahrenheit, the chosen planning temperature at KCP&L. This then yields a weather-adjusted peak demand, which is utilized throughout the rest of the planning process. Volume 4.5: Transmission and Distribution Analysis Page 14
Figure 5: Example Scatter Plot after data filtered to show collating loads

     Figure 6: Cumulative Distribution Plot - 95% certainty at 100 degrees F

For load driven higher by increasing temperatures, the chart above shows at
what temperature the Kansas City Area tops out. Temperatures above 105
degrees Fahrenheit are almost nonexistent historically and statistically. For
Kansas City, the 95% mark (5% of the time temperature runs hotter) is 100

Volume 4.5: Transmission and Distribution Analysis                          Page 15
degrees F. For Distribution Planning, taking 5% risk means planning to a
weather-adjusted temperature of 100 degrees F.
One hundred degrees Fahrenheit planning temperature was chosen for several
reasons. First, Corporate Planning uses 100 degrees for their studies, and
Distribution Planning felt it appropriate to match their criteria for distribution
expansion projects. Second, 100 degrees represents a five percent risk,
meaning there is a five percent chance in any given year the temperature will
exceed 100 degrees on at least one day, sending system loads beyond designed
capacity. Third, 100 degrees best-matched the previous design criteria in terms
of system improvement dollars needed in a given year.
1.1.2.1.2 Circuit Rating Study
Armed with weather-adjusted loads, Distribution Planning can produce ratings for
each circuit. Again, this study is done in several different ways depending on the
configuration and style of the distribution components being looked at. The most
complex of these studies deals with underground feeder cables within duct bank,
which de-rate each other by mutual heating. Distribution Planning uses weather-
adjusted loads to determine capacity ‘choke-points’ in order to rate the circuit.
These ratings are provided to operations to set alarms, and become an integral
part of the N-1 Contingency Study. These ratings are also compared with native
device loads to determine where normal-load capacity expansions are needed.
Volume 4.5: Transmission and Distribution Analysis Page 16Figure 7: Screenshot from Cable De-rating Program
1.1.2.1.3 Spatial Electric Load Forecast Study (Electric Vehicle Study)
KCP&L with the help of Integral Analytics, Inc. (IA) conducted a rigorous electric
vehicle impact study and a long-range spatial load forecast study. The study
details long-range substation load growth due to increases in employment,
population, and estimates the future adoption of electric vehicles at different
penetration levels for the entire KCP&L service territory. The study intent was to
help distribution planners identify future capacity constrained areas due to future
electric vehicle load additions and to proactively plan for distribution expansion
work before system loading became an issue.
Electric vehicles present a significantly large end use load to the distribution
system. To study the potential distribution impact of vehicle electrification, one
must understand the customer key drivers of adoption. Therefore, IA designed a
discrete choice survey and recruited 113 KCP&L residential customers randomly
to participate in a discrete choice survey online. The survey results were
processed and unique electric vehicle adoption and charging behavior segments
Volume 4.5: Transmission and Distribution Analysis Page 17were developed. The segmentation was applied to the KCP&L customer base with demographic information pulled from the Experian database. A probability of adoption score was assigned to each KCP&L customer based on the segmentation analysis. The scoring identified the customers most likely to purchase electric vehicles. Finally, the customers were mapped geographically to locate potential electric vehicle customer clusters at different penetration levels in the KCP&L service territory. The worst case scenario of 100 percent of new vehicles sold in the KCP&L service territory are electric vehicles show, on average, the load will increase by 2,500 kilowatts per substation over the next 20 years. Therefore, residential electric vehicle charging at the local or neighborhood levels will resemble normal load growth. KCP&L annually reviews distribution feeder capabilities and implements necessary upgrades to meet the electricity requirements. KCP&L does not anticipate substation loading issues. However, KCP&L does anticipate localized loading issues at the distribution line transformer level providing service to a cluster of customer who all adopt EV. Localized distribution line transformer loading can be easily resolved by upgrading the size of the transformer. The electric vehicle impact study provides distribution planning a 20 year forecast of future loading by substation for different electric vehicle penetration scenarios. The scenario based planning methodology has allowed distribution planning to understand the impact of electric vehicles in the KCP&L service territory at the substation level. The electric vehicle study did highlight a few potential loading issues but overall the impact of electric vehicles on the distribution networks will to be very minimal over the next 20 years. Appendix 4.5.A contains a complete copy of the “Spatial Electric Load Forecast Study”. Volume 4.5: Transmission and Distribution Analysis Page 18
1.1.2.2 Contingency Planning

Contingency Planning is similar to Capacity Planning in its view of loads
compared to device capacity, but deals in an N-1 contingency setting. KCP&L
designs its system to withstand a failure of any one component at a given time. It
is the responsibility of Distribution Planning Engineers to determine system
weaknesses which do not comply with this and to make the necessary changes
to allow emergency switching to restore power without overloading backup
devices. These issues have a secondary priority in the budgetary process.

       1.1.2.2.1 N-1 Contingency

The annual contingency study will provide the earliest indication of system
improvement needs. It is more likely wire upgrades will be needed in the case of
feeder or transformer loss, rather than there being simply too much native load
on a single feeder or substation transformer. For Distribution Planning, the N-1
Contingency Study is a very systematic and complex process due to the
magnitude of the individual distribution system circuit components. SynerGEE is
the primary software tool in use to determine the load flow across a circuit.
Distribution Planners break apart circuits into segments of load, and establish
switching orders for restoration in the case of a feeder or substation transformer
loss. SynerGEE, using G.I.S. models exported from GTech and weather-
adjusted load data, actually determines how that load is spread across the circuit
by taking a third input from the C.I.S. – metered customer load data. The
SynerGEE CMM Module allows Distribution Planning to allocate feeder breaker
weather-adjusted load on a given feeder based upon how it appears by its
metered customer load, which is typically measured in kWh.

Three very complex inputs into one N-1 Contingency Study using a highly-
technical software program yields effective results determining where system
improvement is needed. By using the model to rearrange the configuration of
circuitry using SynerGEE, Distribution Planning can detect where mapping errors
exist, where low voltage can be problematic, and where wire sizes can limit how
the distribution system is operated. Contingency Planning is an intensely

Volume 4.5: Transmission and Distribution Analysis                          Page 19
complex process taking significant engineering time in order to determine system
weaknesses for a given planning year. The study is completed every year for
every distribution feeder and for the loss of every substation transformer.
These weaknesses, once identified, are further analyzed to determine the impact
to system reliability and are ranked against each other correspondingly.
Ultimately, this ranking, energy efficiency impacts, reliability and customer impact
risks, and the project cost determine whether a system improvement is
constructed or not. Distribution Planning therefore must not only identify the
weakness, but provide some budgetary estimation and project description. It
also becomes the responsibility of Distribution Planning to thoroughly
communicate why a project exists throughout the company, until it becomes part
of the approved budget and is handed-off to a design engineer for sponsorship.
1.1.2.3 Distribution Voltage
At the customer-end of any given line, distribution voltage must be maintained
within specific tolerances. It is the responsibility of Distribution Planning to
assure system-level issues do not adversely affect the voltage received by
KCP&L customers. To do this, G.I.S. models are used in a load-flow program
called SynerGEE to simulate voltage levels in the field. In addition to supplying
adequate voltage levels to our customers, we also strive to maintain an efficient
low-loss distribution system. Several examples of this are the annual load
balancing efforts and capacitor studies to optimize voltage levels and reduce
system losses.
1.1.2.3.1 Loss Studies
Another method of analyzing overall system efficiency is through the
performance of system loss studies. These are done periodically and the
information gathered is used by Planning Engineering as well as in rate case
filings. The most recent system loss study was performed by Siemens in
October, 2014. A complete copy of this study, “Kansas City Power and Light
Electric System Loss Analysis”, can be found in Appendix 4.5.B.
Volume 4.5: Transmission and Distribution Analysis Page 201.1.2.3.2 KCP&L Green Circuits Analysis
Another example of KCP&L’s efforts to improve overall circuit efficiency and
reduce system losses was a study commissioned by KCP&L and completed by
EPRI (Electric Power Research Institute). This study analyzed various loss
reduction options such as phase balancing, capacitor controls, re-conductoring,
and/or voltage optimization. The information gathered by this study has been
used by Planning Engineering to optimize their approach to circuit construction,
configuration and operation. A complete copy of this study, “KCP&L Green
Circuits Analysis Study”, can be found in Appendix 4.5.C.
1.1.2.3.3 Transformer Efficiency Analysis
Currently, KCP&L purchases transformers based on the Total Ownership Cost
(TOC), which includes the transformer purchase price as well as the cost of the
no-load and load-losses associated with each transformer, capitalized over a 30
year expected transformer life. As of 2010, all KCP&L transformers were
purchased utilizing the Department of Energy (DOE) transformer efficiency
standards, which has enabled KCP&L to optimize the TOC of all transformers
over a 30 year period.
Volume 4.5: Transmission and Distribution Analysis Page 211.1.2.4 Condition
Another important focus area for Planning Engineering deals with component
conditions and their effect on reliability as it relates to capacity, contingency,
voltage and overall system efficiency. Ongoing strategic planning to maintain
reliability must account for device degradation over time, and planning engineers
look for cost-effective replacement or maintenance opportunities where they
coincide with capacity expansion plans. By working with the Asset Management
group to determine the best course of action, these replacements in some cases
are combined into Distribution Planning’s capacity expansion projects – an
increase in project scope from the normal course of action. System expansion to
replace degraded system components can be a more cost-effective solution than
the “run-to-failure” strategy.
1.1.2.4.1 URD Cable Replacement Programs
Currently, there are two cable replacement programs in existence at KCP&L: 1)
Proactive Cable Replacement, and 2) Reactive Cable Replacement.
The proactive cable replacement program uses a mix of analysis techniques.
One technique does partial discharge testing of entire underground loops and
replaces the cable sections that do not pass this test. Another option is to look at
the number of failures on the loop and calculate the number of segments that
have had failures. If this percentage is greater than 40%, the cable segments on
the entire loop are eligible for replacement. These methods provide targeted
proactive cable replacements based on cable condition or failure history. The
goal is to target high-risk cables, and replace these cable segments before
failure.
The reactive cable replacement program requires replacement of a cable when it
has failed two or more times. The current policy of the reactive URD replacement
program is to replace any direct buried cable after its second failure with cable in
conduit. A section of cable receives a priority which is a function of the number of
customers affected by the cable outage, the duration of the outage, the vintage of
Volume 4.5: Transmission and Distribution Analysis Page 22the cable, the number of failures of cable, the time elapsed from the most recent
failure, and the number of outages that the lateral has experienced in past 12-
months.
1.1.2.4.2 Cable Injection Program
In addition to cable replacement, cable injection proactively addresses high-risk
cables. Cable injection techniques prolong the cable’s life and improve reliability.
Injection can be performed on cables that have faulted, but as with proactive
replacement, the goal is to prevent failures from happening in the first place.
Injection contractors provide a minimum warranty of 20 years, with the option to
upgrade to as much as 40 years with better injection fluids. Cable injection
companies are used by KCP&L to perform these activities.
1.1.2.4.3 Worst Performing Circuit Analysis
The inventory assessment projects have given Kansas City Power and Light an
advantage that we can employ with worst performing circuit analysis. Annually,
we identify worst performing circuits as mandated by the MPSC and develop
reliability plans and make repairs. The performance of circuits varies significantly
and no two of them have identical problems to fix. We use the assessment data
to be included in our analysis of those worst performing circuits. There are
approximately 70 to 80 WPC’s under review each year that covers Missouri and
Kansas’s regulatory rules. Pole Replacement and Reinforcement Program
1.1.2.4.4 Pole Replacement and Reinforcement Program
The Distribution Pole Replacement/Reinforcement Program addresses
reliability issues associated with the condition of distribution poles. Per
MPSC mandate, KCP&L annually conducts a ground-line inspection of the
system to determine if there is a need to replace or reinforce distribution
poles. The evaluation includes an examination for indications of decay
and/or fungi at or below ground level, hollowness and shell rot. When a
pole is identified for replacement or reinforcement, the Company uses an
independent contractor who is an expert in pole evaluation, maintenance,
Volume 4.5: Transmission and Distribution Analysis Page 23and repair, to prioritize and coordinate pole maintenance or replacement.
The work is prioritized based on conditions with the greatest risk to safety
and impact to customer reliability. Annual pole rejection rate is calculated
to be 0.0356% per 1,000 pole inspections.
Volume 4.5: Transmission and Distribution Analysis Page 241.1.2.4.5 Lateral Improvement Program
This program is an organized effort to evaluate the performance of all laterals on
our system. The criteria considered for fuse lateral selection are customer
interrupted and outage frequency. Examples shown in Figure 8 below are all
laterals to consider for analytical reviews to determine critical value. The blue
circle drawn around the areas with the highest critical values is the chosen
laterals. Laterals tagged as critical value represents 0.9% of the total. Figure 8
show customers interrupted ranges starting at 400 customers interrupted (CI)
down to less than 49 CI per event. Frequency rate is identified by using letters
starting with (A), (B), (C), and (D). Each letter category represents 25% of the
total frequency rate equal to 100%. The numbers within the figure are lateral
counts in each category. For instance, IR (1-2) means one or two outage events
occurring on a lateral. The selection scheme has proven to be the best approach.
Figure 8
1.1.2.4.6 Proactive Retirement of 50 MVA Substation Transformers
The Asset Management group has also proactively undertaken a study to asses
KCP&L’s fleet of 50 MVA dual-secondary winding transformers, determine their
risk of failure, and develop a retirement/replacement program. The condition of
each transformer is primarily based upon dissolved gas analysis taken from
annual transformer oil sampling. KCP&L utilizes a transformer analysis package
that categorizes each transformer as a category 1, 2, 3, or 4, with category 4
being the worst condition. This program reduces the overall operational risk
Volume 4.5: Transmission and Distribution Analysis Page 25associated with transformers that are identified as being at a higher risk for
failure.
1.1.2.4.7 Mobile Substations
Asset Management is also looking into the purchase of 2 mobile substation units
to reduce the risk of long-term power outages in the event of a failure of a high-
voltage substation transformer. Presently, there is a need for several units with
various capacities and voltage levels in addition to the mobile units KCP&L and
KCP&L GMO currently have in their fleet. Purchase of these additional units will
provide greater operational flexibility while also minimizing spare transformer
inventory throughout KCP&L’s service areas.
1.2 ASSESMENT OF INTERCONNECTING NEW FACILITIES
(B) Interconnect new generation facilities. The utility shall assess the need
to construct transmission facilities to interconnect any new generation
pursuant to 4 CSR 240-22.040(3) and shall reflect those transmission
facilities in the cost benefit analyses of the resource options;
KCP&L Transmission Planning must plan to meet interconnection needs of
transmission customers for connection to and use of the KCP&L transmission
system. The Interconnection procedures are covered within the Federal Energy
Regulatory Commission (FERC) approved transmission tariff provisions where
customers are provided detailed transmission studies and interconnection
estimates for connecting to and using KCP&L’s transmission system.
An example of such is the 2014 review of potential sites for addition of new
KCP&L generation resources that considered large additions (620 MW combined
cycle units), medium size additions (200 MW simple cycle units), and small
incremental additions (100 MW reciprocating engine units). This process
included review of brown field (existing) and green field (new) sites within or near
the KCP&L and GMO service territories. KCP&L 161 kV transmission lines are
Volume 4.5: Transmission and Distribution Analysis Page 26generally not adequate to provide firm transmission for a 620 MW generation resource unless multiple (2+) transmission lines are available for generation outlet. KCP&L 345 kV transmission lines can generally provide firm transmission for a 620 MW generation resource if there is available transmission capacity. The resource siting study identified potential sites for addition of large, mid, and small generation resources. Transmission Planning provided a range of transmission costs for each site and identified potential transmission limitations. Any KCP&L generation resource addition that would impact transmission level (>60 kV) flows would have to proceed through the SPP Generation Interconnection process before it could be interconnected to the transmission system. The resource addition would also have to be included in the SPP Aggregate Facility Study process to obtain firm transmission service for delivery of generation to load. 1.3 ASSESSMENT OF TRANSMISSION UPGRADES FOR POWER PURCHASES (C) Facilitate power purchases or sales. The utility shall assess the transmission upgrades needed to purchase or sell pursuant to 4 CSR 240- 22.040(3). An estimate of the portion of costs of these upgrades that are allocated to the utility shall be reflected in the analysis of preliminary supply-side candidate resource options; and KCP&L is member of the Southwest Power Pool (SPP) a Regional Transmission Organization (RTO), mandated by the Federal Energy Regulatory Commission to ensure reliable supplies of power, adequate transmission infrastructure, and competitive wholesale prices of electricity. As a North American Electric Reliability Corporation (NERC) Regional Entity, SPP oversees enforcement and development of reliability standards. SPP has members in nine states. As a member of SPP, KCP&L participates in the regional transmission expansion plan processes of the RTO. Two recent expansion plan processes conducted by SPP are the Balanced Portfolio (June 2009) and the Priority Projects (April 2010). Volume 4.5: Transmission and Distribution Analysis Page 27
The Balanced Portfolio is an SPP strategic initiative to develop a grouping of
economic based regional transmission upgrades that benefit the SPP region
while allocating the cost of the upgrades regionally. Projects in the Balanced
Portfolio include transmission upgrades of 345 kV projects that will provide
customers with potential savings that exceed project costs. These economic
upgrades are intended to reduce congestion on the SPP transmission system,
resulting in savings in generation production costs. Economic upgrades may
provide other benefits to the power grid; i.e., increasing reliability and lowering
required reserve margins, deferring reliability upgrades, and providing
environmental benefits due to more efficient operation of assets and greater
utilization of renewable resources. SPP analyzed the benefits and costs of the
Balanced Portfolio and established that these projects provided a region-wide
per-customer average benefit of $1.66/month with a corresponding cost of
$0.88/month. The Balanced Portfolio included a total of seven transmission
projects with an estimated engineering and construction cost of approximately
$700 million (initial estimate). Two of these projects are within the KCP&L
service territory. They are the Iatan – Nashua 345 kV line (~$65 million) and the
Swissvale-Stilwell tap at West Gardner (~$2 million).

In the Priority Projects plan, SPP sought to identify, evaluate, and recommend
transmission projects that would improve regional production costs, reduce grid
congestion, enable large-scale renewable resources (primarily wind), improve the
Generation Interconnection and Aggregate Facility Study processes, and better
integrate SPP’s east and west regions. A total of six transmission projects with
an estimated cost of $1.1 billion were selected for construction in the Priority
Projects process providing a variety of benefits to the region. One of the projects
included is a GMO project as the Nebraska City-Mullin Creek-Sibley 345 kV
transmission line. These Priority Projects achieve the strategic goals of reducing
transmission congestion, improving the Aggregate Facility Study process by
creating additional transfer capability and increasing the ability to transfer power
in an eastward direction for the majority of the transmission paths between SPP’s
western and eastern areas.

Volume 4.5: Transmission and Distribution Analysis                            Page 28
You can also read