National Plug-In Electric Vehicle Infrastructure Analysis - September 2017 - NREL
←
→
Page content transcription
If your browser does not render page correctly, please read the page content below
National Plug-In Electric Vehicle
Infrastructure Analysis

September 2017
(This page intentionally left blank)
NATIONAL PLUG-IN ELECTRIC VEHICLE INFRASTRUCTURE ANALYSIS

Authors
Eric Wood, Clément Rames, Matteo Muratori, Sesha Raghavan, and Marc Melaina
National Renewable Energy Laboratory

Acknowledgments
This study was supported by the U.S. Department of Energy’s Vehicle Technologies Office. The authors
would specifically like to thank Michael Berube, Sarah Olexsak, Jacob Ward, Rachael Nealer, and David
Gohlke for their guidance and support. Additional thanks to Jarett Zuboy for insightful suggestions and
contributions during the internal writing and editing process, to Julia Thomas and Stephanie Price for
providing timely and thorough reviews, and to Ted Kwasnik for support with geographic information systems.

Special thanks to those who contributed reviews during various phases of the work, including:

    •   Nick Nigro (Atlas Public Policy)

    •   Kadir Bedir (California Energy Commission)

    •   Tyler Svitak (City and County of Denver)

    •   Marcus Alexander (Electric Power Research Institute)

    •   Wayne Killen (Electrify America)

    •   Michael Tamor (Ford Motor Company)

    •   Britta Gross (General Motors)

    •   Matthew Goetz (Georgetown Climate Center)

    •   Michael Nicholas (International Council on Clean Transportation)

    •   Kathy Kinsey (Northeast States for Coordinated Air Use Management)

    •   Ralph Troute (Sacramento Municipal Utility District)

    •   Don MacKenzie (University of Washington)

    •   Susan Burke, Meredith Cleveland (U.S. Environmental Protection Agency)

    •   Michael Scarpino, Diane Turchetta, John Davies, Tianjia Tang (U.S. Federal Highway
        Administration)

                                                      iii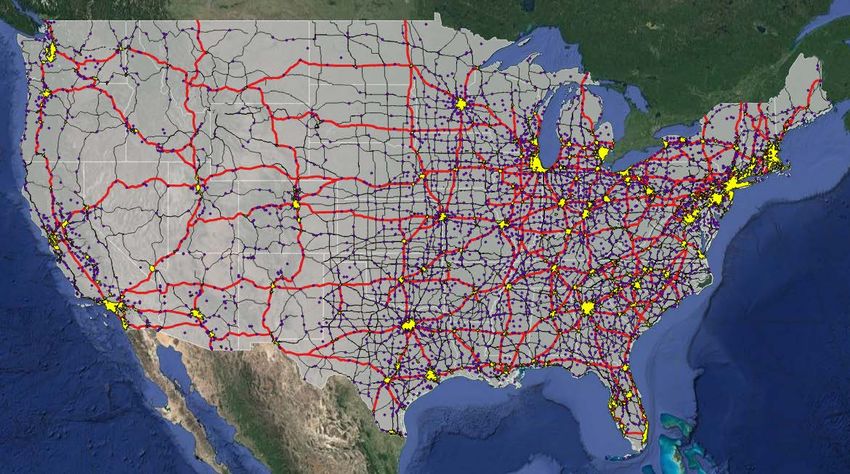
NATIONAL PLUG-IN ELECTRIC VEHICLE INFRASTRUCTURE ANALYSIS

List of Acronyms
BEV            battery electric vehicle

BEVxxx         battery electric vehicle with an electric range of xxx miles

DC             direct current

DCFC           direct current fast charging

DOE            U.S. Department of Energy

DOT            U.S. Department of Transportation

EV             electric vehicle

EVI-Pro        Electric Vehicle Infrastructure Projection Tool

eVMT           electric vehicle miles traveled

EVSE           electric vehicle supply equipment

FHWA           U.S. Federal Highway Administration

HEV            hybrid electric vehicle

HPMS           Highway Performance Monitoring System

INL            Idaho National Laboratory

L2             level 2 (charging station)

LDT            long-distance trip

LDV            light-duty vehicle

MUD            multiple-unit dwelling

NHTS           National Household Travel Survey

NREL           National Renewable Energy Laboratory

PEV            plug-in electric vehicle (BEV or PHEV)

PHEV           plug-in hybrid electric vehicle

PHEVxx         plug-in hybrid electric vehicle with an electric range of xx miles

SHRP2 NDS      Second Strategic Highway Research Program’s Naturalistic Driving Study

SUV            sport utility vehicle

TAF            Traveler Analysis Framework

VMT            vehicle miles traveled

ZEV            zero-emission vehicle

                                                      iv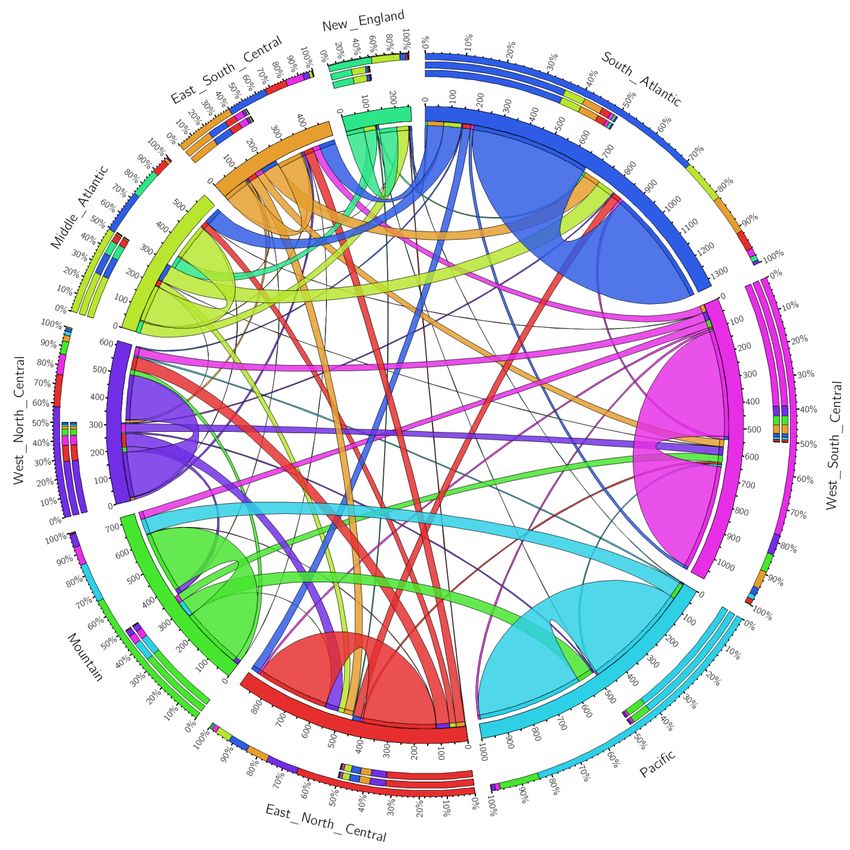
NATIONAL PLUG-IN ELECTRIC VEHICLE INFRASTRUCTURE ANALYSIS
Executive Summary
This report addresses the fundamental question of how much plug-in electric vehicle (PEV) charging
infrastructure—also known as electric vehicle supply equipment (EVSE)—is needed in the United States to
support both plug-in hybrid electric vehicles (PHEVs) and battery electric vehicles (BEVs). It complements
ongoing EVSE initiatives by providing a comprehensive analysis of national PEV charging infrastructure
requirements. The result is a quantitative estimate for a U.S. network of non-residential (public and workplace)
EVSE that would be needed to support broader PEV adoption. The analysis provides guidance to public and
private stakeholders who are seeking to provide nationwide charging coverage, improve the EVSE business
case by maximizing station utilization, and promote effective use of private/public infrastructure investments.
The analysis is organized around the non-residential EVSE network required to meet consumer coverage
expectations and to satisfy consumer demand in high-PEV-adoption scenarios. Coverage and charging demand
estimates needed to serve growing PEV markets are made for the communities where people live and the
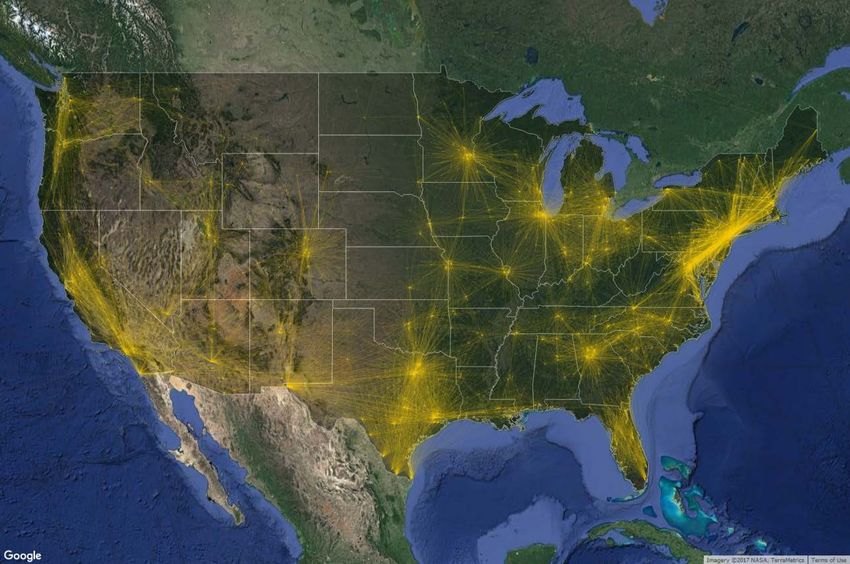
highway corridors on which they travel (Figure ES-1), including four specific geographic areas:
• Cities (486 Census Urban Areas, population greater than 50,000, 71% of U.S. population)
• Towns (3,087 Census Urban Clusters, population 2,500 to 50,000, 10% of U.S. population)
• Rural Areas (regions not covered by Census Urban Areas/Clusters, 19% of U.S. population)
• Interstate Highway System Corridors (28,530 miles of highway).
Figure ES-1. Cities (yellow polygons), towns (purple points), and interstates (thick red lines) considered in this analysis.
(Satellite imagery credit: © 2017 Google, Map Data © 2017 Tele Atlas)
While this work is not intended to forecast future PEV markets, scenarios are developed to exercise the
infrastructure estimation methodology and highlight sensitivities. The analysis assigns no probabilities to any
PEV market or technology scenarios and considers none of the scenarios as most likely. However, a central
scenario is established from which individual elements of the modeling framework are studied using
v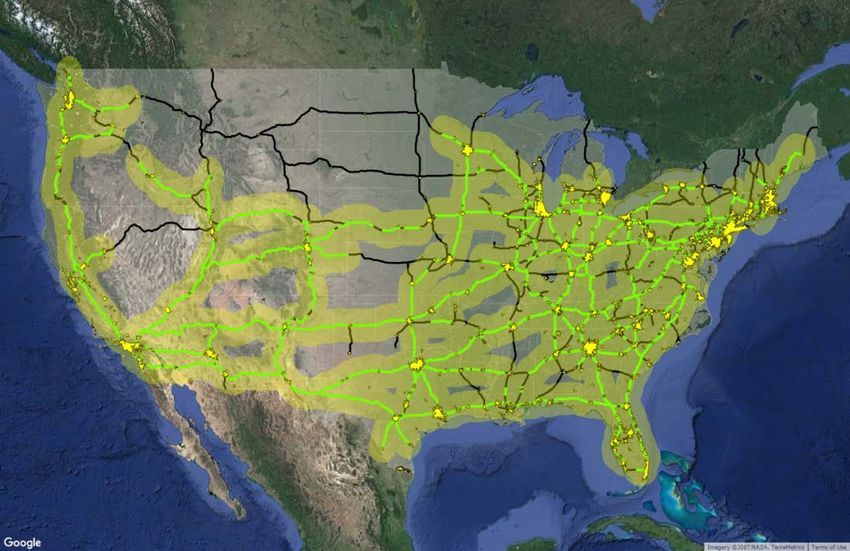
NATIONAL PLUG-IN ELECTRIC VEHICLE INFRASTRUCTURE ANALYSIS

parametric sensitivity analysis as shown in Table ES-1. The central scenario and bounds on the accompanying
sensitivities have been developed using a combination of existing PEV market/technology data and
engineering judgement to represent a set of scenarios that are illustrative of the role that key variables play in
dictating PEV infrastructure requirements. The goal of this scenario development is to estimate the magnitude
of PEV infrastructure requirements (relative to a growing national fleet of PEVs) and to highlight
dependencies with consumer preferences and technology development.

                   Table ES-1. PEV Market Conditions for the Central Scenario and Sensitivities Explored

 Variable                            Central Scenario                      Sensitivity

 PEV Total                           15M (linear growth to 20% of          9M (growth to 10% of 2030 sales)
                                     LDV sales in 2030)                    21M (growth to 30% of 2030 sales)
 PEV Mix                                                Mix                                   Long / Short
 (range preference)                  PHEV20             10%                PHEV20             0% / 40%
                                     PHEV50             35%                PHEV50             50% / 0%
                                     BEV100             15%                BEV100             0% / 50%
                                     BEV250             30%                BEV250             40% / 0%
                                     PHEV20-SUV         5%                 PHEV20-SUV         0% / 10%
                                     BEV250-SUV         5%                 BEV250-SUV         10% / 0%
 Share of PEVs in Cities             83%                                   71% (based on existing LDVs)
 (w/ pop. > 50k)                     (based on existing HEVs)              91% (based on existing PEVs)
 PHEV:BEV Ratio                      1:1                                   4:1 to 1:4
 PHEV Support                        Half of full support                  No PHEV support to full support
                                                                           (maximize PHEV eVMT)
 SUV Share                           10%                                   5% to 50%
 % Home Charging                     88%                                   88%, 85%, and 82%
 Interstate Coverage                 Full Interstate                       Mega-regions, 80% of Long Distance
                                                                           Trips (Traveler Analysis Framework
                                                                           [TAF]), and Full Interstate
 Corridor DCFC Spacing               70 miles                              40 to 100 miles
 DCFC Charge Time                    20 minutes (150 kW)                   10 to 30 minutes
                                                                           (400 to 100 kW)
BEVxxx = battery electric vehicle with a range of xxx miles
DCFC = direct current fast charging
eVMT = electric vehicle miles traveled
kW = kilowatt
LDV = light-duty vehicle
PHEV = plug-in hybrid electric vehicle
PHEVxxx = plug-in hybrid electric vehicle with a range of xxx miles
SUV = sport utility vehicle

The analysis relies on advanced PEV simulations using millions of miles of real-world daily driving schedules
sourced from large public and commercial travel data sets. Technical considerations are made for the spatial

                                                              vi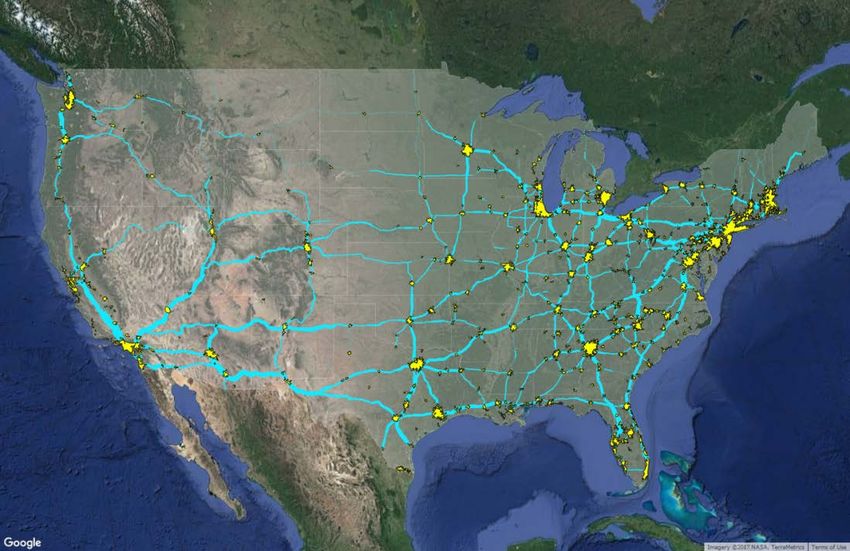
NATIONAL PLUG-IN ELECTRIC VEHICLE INFRASTRUCTURE ANALYSIS

density of PEVs concentrated in cities and towns, ambient temperature effects on electric driving range, and
frequency of long distance driving days requiring non-residential EVSE. Simulations are rooted in a set of
foundational assumptions which are applied across all scenarios. For example, consumers are simulated in all
scenarios as preferring to perform the majority of charging at their home location. This assumption produces
simulation results in the central scenario where 88% of PEV charging takes place at home locations (due to the
large amount of time vehicles are parked at home and relatively short typical daily driving distances),
consistent with early market findings in the EV Project. Charging at non-residential stations is simulated on an
as-necessary basis such that consumers are able to maximize electric vehicle miles traveled (eVMT).

Additionally, it is assumed that future PEVs will be driven in a manner consistent with present day gasoline
vehicles (e.g., 70% of daily driving under 40 miles and 95% under 100 miles). While impacts of transportation
network companies (e.g., Uber, Lyft) and advances in automated driving technology are not considered in this
analysis, interactions between evolving mobility patterns and refueling infrastructure supporting advanced
vehicles are currently being investigated by the consortium of national laboratories participating in the U.S.
Department of Energy’s SMART Mobility Initiative.

Analysis results for the central scenario are summarized in Table ES-2. Results are reported as numbers of
direct current fast charging (DCFC) stations required to provide an acceptable level of coverage and the
number of plugs required to satisfy PEV charging demand. Figure ES-2 and Figure ES-4 highlight the
sensitivities of these values to the many variables explored in the analysis.

          Table ES-2. Summary of Station and Plug Count Estimates for the Central Scenario (15M PEVs in 2030)

                                                            Cities            Towns     Rural    Interstate
                                                                                        Areas    Corridors
 PEVs                                                       12,411,000        1,848,000  642,000          —
 DCFC             Stations (to provide coverage)                     4,900          3,200                —           400
                  Plugs (to meet demand)                           19,000           4,000          2,000           2,500
                  Plugs per station                                    3.9             1.3               —            6.3
                  Plugs per 1,000 PEVs                                 1.5             2.2             3.1              —
 Non-Res L2 Plugs (to meet demand)                                451,000         99,000          51,000                —
                  Plugs per 1,000 PEVs                                  36              54              79              —
Note: Station count estimates for providing a minimum level of coverage have been omitted for community L2 stations
under the assumption that non-residential L2 is primarily used for charging within walking distance of a destination (based
on the low charge power and long charge time of L2 stations) and coverage for every destination was considered unrealistic
for the early PEV market (however, demand estimates for L2 plug counts are included). Similarly, coverage estimates are
omitted for DCFC stations in rural areas as coverage provided by stations in cities/towns and along interstate corridors was
deemed sufficient.

                                                            vii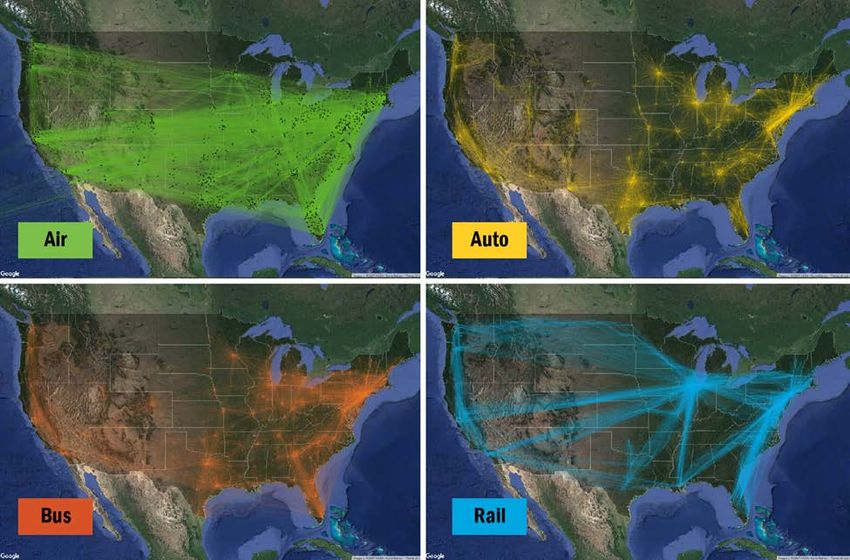
NATIONAL PLUG-IN ELECTRIC VEHICLE INFRASTRUCTURE ANALYSIS

Non-Residential Charging for Communities
The analysis first estimates the minimum DCFC coverage requirements for dispelling range anxiety concerns
by providing a safety net of DCFC stations in cities and towns for emergency situations (such as failing to
overnight charge at home). To ensure that BEV drivers in cities are never more than 3 miles from a DCFC
station, approximately 4,900 DCFC stations are required across the United States. Providing the same level of
coverage for towns would require approximately an additional 3,200 DCFC stations.

The analysis also estimates non-residential charging stations (work and public) required to satisfy
intracommunity charging demands. Figure ES-2 shows the sensitivity of total national plug requirements to
several input variables. In the central scenario, a total of approximately 600,000 non-residential Level 2 (L2)
plugs and 25,000 DCFC plugs are necessary to satisfy consumer charging demand (assuming 15 million PEVs
are on the road in 2030).

          Figure ES-2. Effects of input variables on estimated total national plug requirements in communities.

Perhaps surprisingly, the national PEV total is not the most sensitive input parameter in this analysis; PEV
electric range, commitment to maximizing PHEV eVMT, and percent of charging taking place at home have
the largest effects. For instance, assuming a PEV market composed entirely of PHEV50s (PHEVs with a range
of 50 miles) and BEV250s (BEVs with a range of 250 miles) (the long range preference scenario) drops non-
residential L2 requirements to approximately 338,000 plugs and public DCFC to 8,400 plugs. The sensitivity
on PHEV support reveals that non-residential L2 charging is modeled almost exclusively as supporting
PHEVs, where providing full support (maximizing eVMT for all PHEV owners) results in over 1,100,000
plugs, and providing no PHEV support drops the non-residential L2 plug requirement to under 63,000. Finally,
the sensitivity analysis on home charging demonstrates a strong relationship between home charging
utilization and non-residential infrastructure requirements. Specifically, a decrease in the amount of charging
happening at residential locations from 88% in the central scenario to 82% results in charging requirements
increasing to 1,100,000 non-residential L2 EVSE plugs and over 65,000 public DCFC plugs.

                                                           viii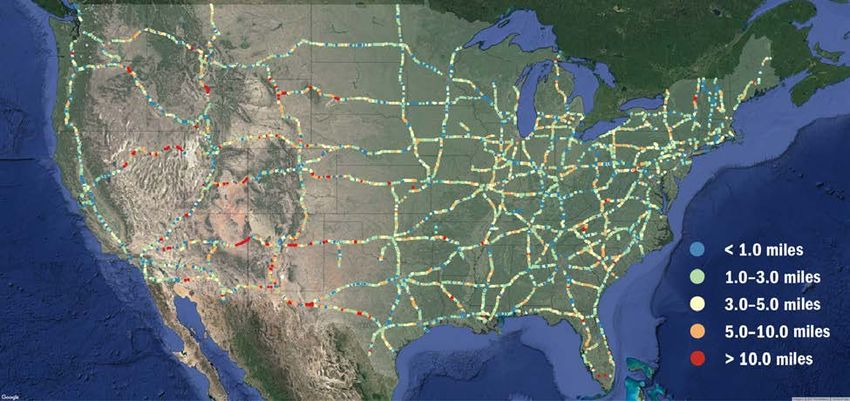
NATIONAL PLUG-IN ELECTRIC VEHICLE INFRASTRUCTURE ANALYSIS
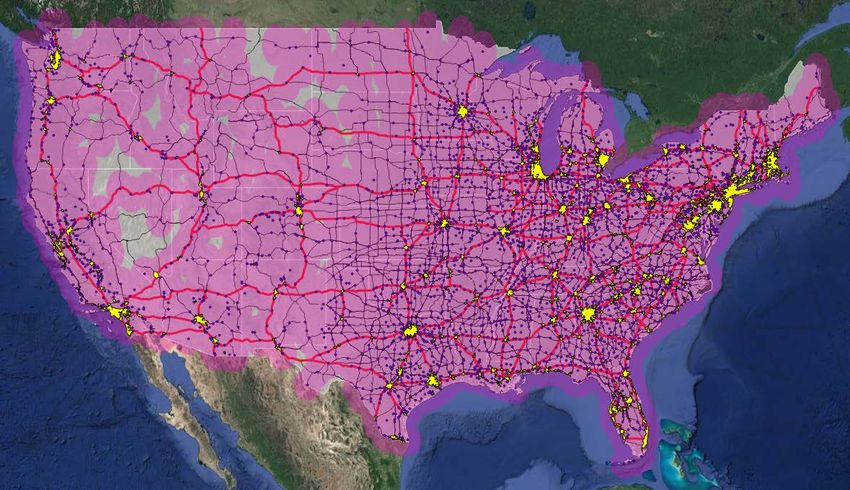
Fast Charging for Long-Distance Travel Corridors
Long-distance travel has been a barrier to BEV adoption due to real vehicle range limitations, which can be
exacerbated by even more restrictive perceived range anxiety. Long-range BEVs have the potential to address
this issue if coupled with an extensive and convenient network of DCFC stations that enable reliable intercity
travel. The analysis finds that approximately 400 corridor DCFC stations (spaced 70 miles apart on average)
are required to provide convenient access to BEV drivers across the U.S. Interstate System. Approximate
coverage enabled by DCFC stations in this scenario is visualized in Figure ES-3 with red buffers placed
around the Interstate network, each with a radius of 70 miles.
Figure ES-3. Approximate BEV driving coverage enabled by providing DCFC stations along the U.S. Interstate System.
(Satellite imagery credit: © 2017 Google, Map Data © 2017 Tele Atlas)
Figure ES-4 shows estimated station and plug counts for corridor fast charging supporting BEV travel along
the U.S. Interstate network. Results are presented using parametric sensitivity analysis highlighting the
influence of four input variables: 1) network coverage, 2) average station spacing, 3) national BEV count, and
4) average DCFC charge time. For example, 408 corridor DCFC stations are necessary in the central scenario,
which assumes full Interstate coverage and 70-mile average station spacing. However, corridor DCFC station
counts range from 137 to 713 depending on network and station spacing. Similarly, corridor DCFC plug
counts are estimated at 2,472 in the central scenario but vary from 824 to 3,709 in the parametric sensitivity
analysis depending on network coverage, size of the BEV fleet, and DCFC charge times.
ix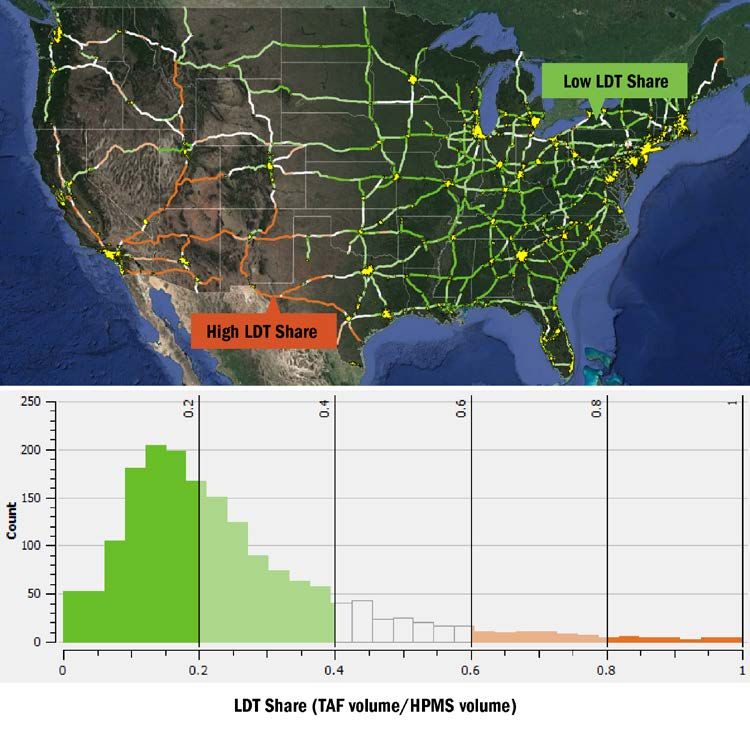
NATIONAL PLUG-IN ELECTRIC VEHICLE INFRASTRUCTURE ANALYSIS
Figure ES-4. Sensitivity of corridor DCFC station (left) and plug (right) counts to selected networks, station spacings, BEV
counts, and DCFC charge times.
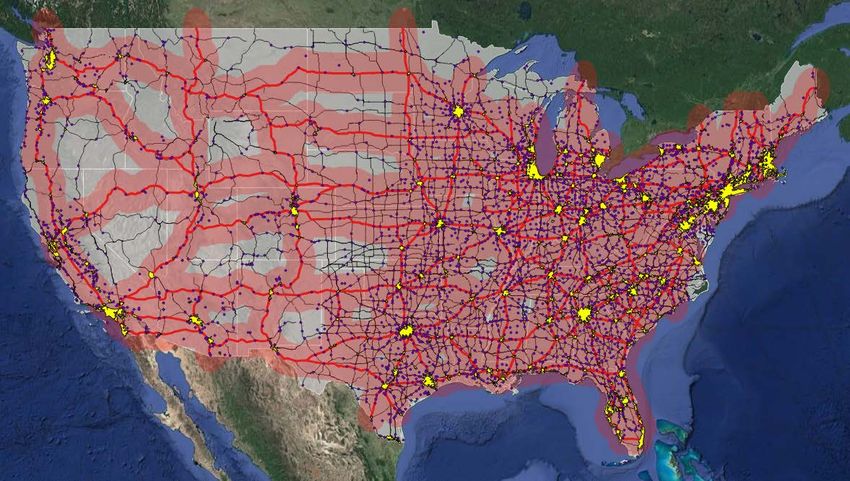
As described above, the U.S. Interstate System provides a basis for DCFC infrastructure that can efficiently
satisfy long-distance driving demands in the near term. The Interstate System is not, however, entirely isolated
from community-based DCFC infrastructure. Although full community-based infrastructure may take longer to
establish, it could provide travel corridors with charging backup options, route flexibility, and additional
coverage along U.S. highways and state routes. Figure ES-5 shows the national DCFC station coverage
enabled by providing the community-based charging station coverage previously discussed. Each covered city
and town has a 70-mile radius buffer around it, approximating station coverage.
Figure ES-5. Approximate BEV driving coverage enabled by providing DCFC stations in all cities and towns in the United
States.
(Satellite imagery credit: © 2017 Google, Map Data © 2017 Tele Atlas)
xNATIONAL PLUG-IN ELECTRIC VEHICLE INFRASTRUCTURE ANALYSIS
Major Conclusions
This report categorizes PEV charging infrastructure requirements by area served (cities, towns, rural areas, and
Interstate corridors) and role during early PEV market growth (providing coverage to early PEVs and
satisfying demand due to increased PEV adoption). The analysis makes no assumptions about the likelihood of
particular PEV market or technology scenarios. Rather, a range of plausible scenarios explores the relationship
between the evolution of the PEV fleet and charging infrastructure.
Communities are expected to have significantly larger charging infrastructure requirements than Interstate
corridors under both the coverage and demand assessments. About 4,900 DCFC stations are required across
cities with an additional 3,200 DCFC stations required in towns to provide a minimum level of nationwide
coverage in the communities where 81% of people live. Such a network would dampen range anxiety concerns
by providing drivers with a safety net for emergency charging situations.
Intracommunity charging demand analysis demonstrates how utilization of the DCFC coverage network would
be expected to grow in increased PEV adoption scenarios based on a home-dominant charging assumption.
Results for a 15-million PEV market estimate a DCFC plug requirement of 25,000 in communities
(approximately 3.1 plugs per average DCFC station and 3.4 plugs required to support 1,000 BEVs). Demand
for non-residential L2 EVSE (including work and public charging) is estimated as 600,000 plugs necessary to
support 15 million PEVs (approximately 40 plugs per 1,000 PEVs).
Sensitivity analysis of the community results for consumer charging demand indicates a strong relationship
between the evolution of the PEV and EVSE markets. As this analysis attempts to arrive at charging
infrastructure solutions that fill the eVMT gaps between consumer travel patterns and PEV electric ranges,
infrastructure requirements are not only proportional to the total number of PEVs in the system, but also
inversely proportional to PEV electric range. Manufacturer and consumer preferences with respect to electric
range, charging power, and utilization of residential EVSE have direct and dramatic consequences on the level
of charging demand calculated in this analysis.
Results suggest that approximately 400 corridor DCFC stations are needed to enable long-distance BEV travel
along Interstate highways between cities (where the majority of BEVs are likely to be concentrated).
Understanding driving patterns, vehicle characteristics, and charging behavior and then prioritizing corridors
and setting station spacing accordingly—as illustrated in the network scenarios—could help optimize the
utility and economics of early-market corridor charging stations.
Regardless of geographic scope, the analysis suggests that organizations planning for charging infrastructure to
support consumer adoption of PEVs need to be aware of the importance of consumer preferences with respect
to electric range and charging behavior. Furthermore, planners should focus on providing consumers with
adequate charging coverage (particularly DCFC supporting adoption of BEVs) while monitoring station
utilization over time and increasing charging capacity (both in terms of rated power and number of plugs) as
the PEV market continues to grow.
xiNATIONAL PLUG-IN ELECTRIC VEHICLE INFRASTRUCTURE ANALYSIS
Table of Contents
List of Acronyms................................................................................................................................................ iv
Executive Summary ........................................................................................................................................... v
List of Figures .................................................................................................................................................. xiv
List of Tables ................................................................................................................................................... xvii
1 Introduction .................................................................................................................................................. 1
1.1 Recent EVSE Initiatives and Analysis Studies ............................................................................... 1
1.2 Analytic Approach.......................................................................................................................... 3
1.2.1 Conceptual Representation of PEV Charging Infrastructure Requirements ........................ 3
1.2.2 Scenario Discussion ............................................................................................................. 4
1.2.3 Report Structure ................................................................................................................... 6
2 Existing Vehicle and Infrastructure Status .............................................................................................. 7
2.1 Plug-in Electric Vehicle Market Analysis ...................................................................................... 7
2.2 Electric Vehicle Supply Equipment Availability.......................................................................... 10
3 Non-Residential L2 and DCFC for Community Charging.................................................................... 11
3.1 DCFC Coverage Estimates ........................................................................................................... 11
3.2 Non-Residential EVSE Community Demand Estimates .............................................................. 11
3.2.1 Electric Vehicle Infrastructure Projection (EVI-Pro) Tool ................................................ 12
3.2.2 Estimating Non-Residential EVSE/PEV Nominal Ratios.................................................. 13
3.2.3 National Results in the Central Scenario............................................................................ 15
3.2.4 Sensitivities of National Results to Various Assumptions ................................................. 16
4 DCFCs for Corridor Charging ................................................................................................................... 18
4.1 DCFC Interstate Corridor Coverage Calculations ........................................................................ 18
4.1.1 Full Interstate Network ...................................................................................................... 20
4.1.2 Corridor Prioritization ........................................................................................................ 21
4.1.3 Station Spacing .................................................................................................................. 31
4.2 DCFC Interstate Corridor Demand Calculations .......................................................................... 33
4.2.1 DCFC Power Level ............................................................................................................ 33
4.2.2 TAF Volumes ..................................................................................................................... 33
4.2.3 Results and Discussion....................................................................................................... 33
4.3 Challenges to Interstate Corridor Charging Infrastructure ........................................................... 36
4.3.1 Retail Land Use Availability .............................................................................................. 36
4.3.2 Existing Electrical Infrastructure: Proximity between Interstate Exits and Electrical
Substations ......................................................................................................................... 37
4.4 Corridor Charging Support from Community-Based DCFC........................................................ 38
5 Conclusions ............................................................................................................................................... 39
5.1 Major Conclusions........................................................................................................................ 39
5.2 Summary of Modeling Limitations .............................................................................................. 40
References ....................................................................................................................................................... 41
xiiNATIONAL PLUG-IN ELECTRIC VEHICLE INFRASTRUCTURE ANALYSIS
Appendix A: Supplementary Statistics on Existing EVSE .......................................................................... 46
Appendix B: EVSE/PEV Adjustment Factors to Account for Local Conditions....................................... 47
Appendix C: Central Scenario PEV/EVSE Estimates by State .................................................................. 51
Appendix D: Long-Distance Travel Frequency from the SHRP2 NDS ..................................................... 53
xiiiNATIONAL PLUG-IN ELECTRIC VEHICLE INFRASTRUCTURE ANALYSIS
List of Figures
Figure ES-1. Cities (yellow polygons), towns (purple points), and interstates (thick red lines)
considered in this analysis......................................................................................................................... v
Figure ES-2. Effects of input variables on estimated total national plug requirements in
communities. ............................................................................................................................................ viii
Figure ES-3. Approximate BEV driving coverage enabled by providing DCFC stations along the U.S.
Interstate System. (Satellite imagery credit: © 2017 Google, Map Data © 2017 Tele Atlas) ...... ix
Figure ES-4. Sensitivity of corridor DCFC station (left) and plug (right) counts to selected networks,
station spacings, BEV counts, and DCFC charge times......................................................................... x
Figure ES-5. Approximate BEV driving coverage enabled by providing DCFC stations in all cities and
towns in the United States. ........................................................................................................................ x
Figure 1. PEV charging requirements evolution as a function of PEV market share. .............................4
Figure 2. Distribution of all 2016 registrations of LDVs, HEVs, and PEVs in the United States by state
ZEV status ..................................................................................................................................................... 7
Figure 3. Composition of 2016 U.S. PEV stock ............................................................................................. 8
Figure 4. Distribution of all 2016 registrations of LDVs, HEVs, and PEVs in the United States by area8
Figure 5. Schematic for estimating community charging requirements. .............................................. 12
Figure 6. Nominal non-residential EVSE/PEV ratios (home dominant charging behavior). ................ 14
Figure 7. Nominal charging load profile from EVI-Pro simulations (home dominant charging
behavior). ................................................................................................................................................... 15
Figure 8. Effects of input variables on estimated total national plug requirements. .......................... 17
Figure 9. Effects of input variables on normalized national plug requirements (EVSE/PEV ratios). . 17
Figure 10. Methodology and sensitivity schematic for corridor DCFC analysis. ................................... 19
Figure 11. Nationwide DCFC station counts to cover corridors as a function of station spacing for
different scenarios. .................................................................................................................................. 20
Figure 12. Interstate corridor network (thick red lines) considered in this analysis (70-mile radius
red buffer approximates areas that would be served by the proposed DCFC network). Included
for reference: yellow polygons represent cities, purple points represent towns, and thin black
lines represent the national highway system. ..................................................................................... 21
Figure 13. DCFC corridors providing coverage to intra-mega-region travel (70-mile radius yellow
buffer approximates areas that would be served by the proposed DCFC network). ..................... 22
Figure 14. PEV Alternative Fuel Corridors as designated by DOT Alternative Fuel Corridor Map ...... 23
Figure 15. DCFC corridors providing coverage as designated by the DOT Alternative Fuel Corridor
Map (DOT 2017a) (70-mile radius yellow buffer approximates areas that would be served by
the proposed DCFC network).................................................................................................................. 23
xivNATIONAL PLUG-IN ELECTRIC VEHICLE INFRASTRUCTURE ANALYSIS
Figure 16. U.S. Interstate Highway corridors. Line thickness is proportional to HPMS average daily
traffic. ......................................................................................................................................................... 24
Figure 17. DCFC corridors providing coverage to the top 80% of HPMS annual average daily traffic
(70-mile radius yellow buffer approximates areas that would be served by the proposed DCFC
network). .................................................................................................................................................... 24
Figure 18. TAF summary statistics............................................................................................................... 25
Figure 19. TAF long-distance travel origin–destination pairs by mode; only top 10% visualized here
for clarity. ................................................................................................................................................... 26
Figure 20. Map of U.S. Census divisions ..................................................................................................... 27
Figure 21. TAF long-distance auto passenger trip origin-destination pairs; only top 10% visualized
here for clarity........................................................................................................................................... 27
Figure 22. Chord diagram generated using TAF long-distance auto passenger travel volume ......... 28
Figure 23. U.S. Interstate Highway corridors. Line thickness proportional to TAF long-distance auto
traffic. ......................................................................................................................................................... 29
Figure 24. DCFC corridors providing coverage to the top 80% of the TAF long-distance auto traffic
(FHWA 2013) (70-mile radius yellow buffer approximates areas that would be served by the
proposed DCFC network). ....................................................................................................................... 29
Figure 25. Comparison of TAF and HPMS volumes (color scale proportional to TAF:HPMS ratio). ... 30
Figure 26. Station spacing methodology proposed in this study. ........................................................... 32
Figure 27. Nationwide corridor DCFC station count versus station spacing, annual average volume.34
Figure 28. Plug requirement variance between stations. ........................................................................ 34
Figure 29. Sensitivity of corridor DCFC station and plug counts to network, station spacing, BEV
count, and charge time. .......................................................................................................................... 35
Figure 30. Distance between consecutive candidate retail sites............................................................ 36
Figure 31. Highway exits color-coded by distance to the nearest electrical substation. ..................... 37
Figure 32. National charging station coverage enabled by providing minimum DCFC station
coverage (70-mile buffers placed around all cities and towns)........................................................ 38
Figure B-1. Daily VMT cumulative distribution functions by population density, from the 2009 NHTS.47
Figure B-2. Mimicking NHTS daily VMT cumulative distribution functions by population density by
resampling INRIX travel data. ................................................................................................................ 48
Figure B-3. Adjustment factor: non-residential EVSE/PEV ratio as a function of population density.48
Figure B-4. Adjustment factor: non-residential EVSE/PEV ratio as a function of PEV concentration.49
Figure B-5. EVI-Pro DCFC effective charge rate model: percentage of EVSE rated power delivered as
a function of charge duration and battery temperature. ................................................................... 50
Figure B-6. Adjustment factor: non-residential EVSE/PEV ratio as a function of ambient
temperature. ............................................................................................................................................. 50
xvNATIONAL PLUG-IN ELECTRIC VEHICLE INFRASTRUCTURE ANALYSIS
Figure D-1. Cumulative distribution of daily VMT in 2009 NHTS and SHRP2 NDS. ............................. 53
Figure D-2. Annual VMT distribution in 2009 NHTS and SHRP2 NDS. ................................................... 54
Figure D-3. Impact of annualized VMT (AVMT) on average long-distance travel frequency from
SHRP2 NDS. .............................................................................................................................................. 54
Figure D-4. Impact of annualized VMT (AVMT) on long-distance travel frequency from SHRP2 NDS
(percentile bins, frequency of 200+ mile days)................................................................................... 55
xviNATIONAL PLUG-IN ELECTRIC VEHICLE INFRASTRUCTURE ANALYSIS
List of Tables
Table ES-1. PEV Market Conditions for the Central Scenario and Sensitivities Explored ...................... vi
Table ES-2. Summary of Station and Plug Count Estimates for the Central Scenario (15M PEVs in
2030) .......................................................................................................................................................... vii
Table 1. PEV Market Conditions for the Central Scenario and Sensitivities Explored ............................5
Table 2. Top 10 U.S. Urban Areas by PEV Stock, 2016 (IHS Markit 2017)...............................................9
Table 3. EVSE Characteristic of the Top 10 U.S. Urban PEV Markets, 2017 (DOE 2017b) ................. 10
Table 4. Modeled Vehicles ............................................................................................................................. 13
Table 5. Modeled Charging Infrastructure .................................................................................................. 13
Table 6. Central Scenario PEV and Non-Residential EVSE Estimates in 2030, Top 10 Urban Areas 16
Table 7. Central Scenario PEV and Non-Residential EVSE Estimates in 2030, by Community Type
(with National Total) ................................................................................................................................ 16
Table 8. National DCFC Coverage Scenarios along U.S. Interstate Corridors ........................................ 18
Table 9. Estimated National DCFC Station Counts to Cover Corridors under Different Scenarios .... 19
Table A-1. Public Charging Plugs by Network (DOE 2017b) .................................................................... 46
Table A-2. Public DCFC Plugs and Stations by Network (DOE 2017b) ................................................... 46
Table B-1. EVI-Pro Driving Discharge Model: Relative Battery Discharge Rates as a Function of
Ambient Temperature and Average Trip Speed .................................................................................. 49
xviiNATIONAL PLUG-IN ELECTRIC VEHICLE INFRASTRUCTURE ANALYSIS
(This page intentionally left blank)NATIONAL PLUG-IN ELECTRIC VEHICLE INFRASTRUCTURE ANALYSIS
1 Introduction
Plug-in hybrid electric vehicles (PHEVs) and battery electric vehicles (BEVs)—collectively known as plug-in
electric vehicles (PEVs)—provide various benefits to the United States. They reduce reliance on petroleum,
which accounts for over 90% of total U.S. transportation energy consumption (U.S. Energy Information
Administration [EIA] 2017) and is characterized by an extremely volatile market. Substituting electricity for
gasoline and diesel could significantly improve U.S. energy security, providing greater fuel diversity in a
market currently dominated by a single energy source. PEVs also produce zero tailpipe emissions and
potentially low or zero greenhouse gas emissions, depending on the electricity generation mix (Orsi et al.
2016).
PEV sales in the United States increased by 40% in 2016, reaching a total stock of over 500,000 vehicles (IHS
Markit 2017). This rapid market growth is the result of significant advances in PEV technologies, most notably
the rapidly falling cost of lithium-ion batteries used in automotive applications (U. S. Department of Energy
[DOE] 2017a, Nykvist and Nilsson 2015), as well as policy support. Policy support includes government
research and development support (which also enabled battery technology advancements); technical and cost
targets, mandates, and regulations (e.g., corporate average fuel economy [CAFE] standards and zero emission
vehicle [ZEV] mandates); financial incentives for PEV purchase and charging station installations; and other
measures increasing the value proposition of alternative fuel vehicles (e.g., preferential parking or access to
high-occupancy vehicle lanes) (International Energy Agency [IEA] 2017). Still, widespread market adoption
of PEVs remains hindered by many factors, including limited availability of models and styles, higher cost
compared with conventional vehicles, and the lack of a convenient and ubiquitous network of charging
stations.
Understanding the barriers to and benefits of deploying a widespread and effective network of PEV charging
stations, also known as electric vehicle supply equipment (EVSE), is particularly important. Such a network
would promote PEV consumer acceptance and market growth, enable long-distance travel for BEVs
(alleviating the range anxiety concerns of many consumers), and potentially increase the share of electric miles
driven by PHEVs. Infrastructure planning must anticipate PEV adoption while remaining cost-effective so low
station utilization does not severely undermine the business case for building and operating stations (Melaina
et al. 2017). Sufficient revenue is required to build and continue operating the EVSE network as the PEV
market grows over time.
This report presents an approach for developing a U.S. network of non-residential EVSE that enables broader
PEV adoption and maximizes PEV use. This analysis can help inform various public and private stakeholders
who are seeking to provide nationwide charging coverage and improve the business case for building stations
by maximizing station utilization.
1.1 Recent EVSE Initiatives and Analysis Studies
Several recent public and private initiatives and pilot projects are promoting EVSE growth across the United
States as a way to increase PEV adoption by enhancing consumer familiarity and acceptance of this technology
as well as providing a more convenient network of charging stations. In particular, direct current fast charging
(DCFC) is receiving significant attention as the fastest PEV charging system currently available. Tesla’s
Supercharger, CHAdeMO, and SAE’s combined charging system (CCS) are the currently available standards
for DCFC. The landscape of DCFC in the United States is expected to change significantly with the
penetration of longer-range BEVs (with over 200 miles of driving range), which likely will rely on DCFC to
make long-distance trips (LDTs). While fast charging currently ranges between 50 and 120 kilowatts (kW),
power levels up to 400 kW are currently being explored to reduce charging time and provide a more
convenient consumer experience.
1NATIONAL PLUG-IN ELECTRIC VEHICLE INFRASTRUCTURE ANALYSIS
Over the past five years, Tesla has established a network of 357 fast-charging stations, supporting 2,478
individual fast chargers rated at up to 120 kW (DOE 2017b). Each supercharger station has between one and
12 120-kW plugs, with an average of seven plugs per station. As the only automaker selling long-range BEVs
in the United States during this period, Tesla started addressing the circular dilemma between alternative fuel
vehicle adoption and refueling infrastructure availability by deploying a national network of proprietary
charging stations to enable long-distance travel for Tesla vehicles. Tesla recently announced the goal of
doubling the number of superchargers both nationally and globally. As of June 2017, the average distance
between Tesla supercharger stations is approximately 67 miles (based on data from DOE [2017b]).
Electrify America—a project funded in December 2016 by Volkswagen Group of America as required by
Appendix C to the 2.0-Liter Partial Consent Decree—has committed to investing $2 billion over the next 10
years in ZEV infrastructure and education programs, including $800 million in California alone (Electrify
America 2017, Green Car Reports 2017). In its first national ZEV investment cycle (30 months, through mid-
2019), Electrify America plans to develop a large network of community-based PEV charging stations as well
as approximately 300 fast-charging stations along high-traffic corridors between metropolitan areas in 39
states. Each corridor DCFC station will include four to ten plugs with an average of five plugs per station.
Individual plugs will be rated at 150 kW with the ability to be upgraded to up to 350 kW for future vehicles
that can accept higher power charging. Corridor DCFC stations will be spaced on average 70 miles apart with a
maximum distance of 120 miles between consecutive stations. The Electrify America network will be non-
proprietary by providing both CHAdeMO and SAE CCS plug types, allowing any BEV to charge.
Nissan and BMW are partnering to double the EVgo network of fast charging stations across the United States.
As of January 2017, an additional 174 EVgo 50-kW fast charging stations across 33 states have been installed,
with an additional 50 stations planned for 2017 (Nissan 2017).
The U.S. Department of Transportation (DOT) recently designated several highways as alternative fuel
corridors (including 48 PEV charging corridors) with the intent of establishing a comprehensive national
network of refueling stations to promote the continued adoption of alternative fuel vehicles (DOT 2017a). This
network will include nationally consistent signage and is intended to encourage multi-state collaborations of
public/private stakeholders.
Launched in 2009, the EV Project partnered with city, regional, and state governments; utilities; and other
organizations in 18 cities to deploy about 14,000 Level 2 PEV chargers and 300 direct current (DC) fast
chargers (DOE 2014). The EV Project was the first large-scale data-collection effort for PEVs and related
infrastructure in the United States (Idaho National Laboratory [INL] 2013).
In parallel to these initiatives, several analytical studies have explored the opportunities and implications
related to EVSE development. In this early market phase for PEV adoption, vehicle configurations, styles, and
all-electric ranges are changing rapidly in response to evolving consumer preferences and technology
improvements (particularly battery cost). Future vehicle attributes and requirements remain uncertain, and the
most effective EVSE strategy to support PEV adoption will depend on how these trends evolve over time.
Still, various stakeholders must anticipate a range of possible future trends to develop cost- and market-
effective EVSE plans. In this context, scenario analysis and market simulation studies can inform different
stakeholders during the EVSE planning process, including federal and local governments, private investors,
vehicle manufacturers, and infrastructure developers.
In the 18th edition of the Automotive Executive Survey, an annual international assessment of the current state
and future prospects of the worldwide automotive industry, KPMG focused on the role of vehicle
electrification and its connection with infrastructure (KPMG 2017). Although 50% of the 953 executives who
participated in the KPMG survey identified BEVs as the industry’s key near-term (2017 to 2025) trend, most
respondents (62% of executives) also absolutely or partly agreed that BEVs “will fail” owing to infrastructure
challenges. This pessimistic long-term view of the industry’s ability to overcome infrastructure challenges was
more pronounced from respondents in Organisation for Economic Co-operation and Development countries,
2NATIONAL PLUG-IN ELECTRIC VEHICLE INFRASTRUCTURE ANALYSIS
whereas respondents in China were more optimistic. KPMG concluded that significant investments in a
ubiquitous and user-friendly PEV charging infrastructure are crucial for supporting long-term PEV adoption
and that overcoming the range anxiety issue for BEV users is critical for the long-term survival of BEVs.
INL recently leveraged information from previous data collection activities to assess criteria for designing and
upgrading DCFC complexes that provide fast-charging opportunities for BEV drivers in urban communities
and on corridors (Francfort et al. 2017). Findings and lessons learned suggest that “DCFCs are most useful
when they are sited within a half-mile of major transportation corridors, where they can support both intra and
inter-urban travel” and that “there is a greater likelihood that a DCFC will be highly utilized if it is located at
or near a workplace where employees are likely to own PEVs” (Francfort et al. 2017).
Navigant Research has published several studies about opportunities for global PEV and related infrastructure
markets. Its DC Charging Map for the United States explores fast-charging opportunities that enable intercity,
interstate, and cross-country travel in response to market trends that are promoting long-range BEV adoption
(such as battery capacities of ~60 kilowatt-hours) (Navigant Research 2016). The report maps the progression
of fast-charging stations needed to meet the demands of light-duty BEVs through a phased rollout, focusing on
the needs of long-range BEVs. The analysis shows that 95 fast charging stations would provide basic long-
distance coverage for BEV travel. It also shows that sufficient coverage for BEVs in the top 100 metropolitan
areas could be achieved with 408 stations.
The California Energy Commission’s Statewide PEV Infrastructure Assessment is an example of scenario
analysis developed at the state level (Melaina and Eichman 2015, Melaina and Helwig 2014). In this study,
PEV sales are estimated based on compliance with the ZEV mandate, and PEV travel simulations are
performed to assess the role of public infrastructure in future PEV market growth, focusing on the degree to
which increased public charging may increase e-miles. Results show that 225 to 775 fast-charging stations will
be required to support 1 million PEVs in California, depending on charging preference. One conclusion of the
report is that insights from analytical studies are required to guide the development of effective near-term fast-
charger installation strategies.
A 2013 National Academy of Sciences report explored alternative scenarios that would radically transform the
U.S. passenger vehicle sector, including enabling technologies and adoption barriers (National Research
Council 2013). The report identifies charging infrastructure availability as a major barrier to consumer
adoption of PEVs.
1.2 Analytic Approach
This PEV charging study complements the existing literature by providing updated and comprehensive
analysis of the national PEV charging infrastructure requirements within cities, towns, and rural areas and
along corridors connecting them. It provides guidance to regional and national stakeholders on non-residential
EVSE strategies and plans, both to reduce range anxiety as a barrier to increased PEV sales and to promote
effective use of private/public infrastructure investments.
1.2.1 Conceptual Representation of PEV Charging Infrastructure Requirements
PEV charging infrastructure requirements—the number of stations and plugs required to provide a convenient
and ubiquitous network of PEV charging opportunities—will evolve as PEV adoption increases. In particular,
two driving forces characterize the charging infrastructure required to support a growing fleet of PEVs:
1. A basic level of geographic coverage is required to guarantee nationwide charging opportunities and
enable long-distance travel for BEVs.
2. Over time, a larger network of stations will be required to satisfy growing charging demand. The
requirement increases non-linearly with PEV market share. At low market shares, the requirement
increases quickly because PEVs are clustered in particular areas and charging is concentrated during
3NATIONAL PLUG-IN ELECTRIC VEHICLE INFRASTRUCTURE ANALYSIS
specific times such as after commuting periods and on weekends (for long-distance travel). As PEV
market share increases, the infrastructure requirements increase less aggressively owing to the natural
stochastic features of driving behavior—not all drivers will require charging in the same location and at
the same time. In a fully developed market, each additional PEV leads to lower incremental requirements
for PEV charging infrastructure.
Figure 1 illustrates coverage (blue line) and demand (black line) infrastructure requirements for different PEV
market shares. The coverage requirement is independent of PEV adoption: even if few PEVs are deployed, a
ubiquitous network of stations is required to enable long-distance travel, prevent range anxiety, and promote
PEV adoption. Therefore, a “utilization gap” exists at low PEV market shares, which is characterized by a
market demand for charging infrastructure that is lower than the required coverage infrastructure; the
infrastructure is underutilized, which negatively impacts station financial performance and makes it difficult to
justify investment in new stations (Melaina et al. 2017). As PEV adoption increases, the demand for charging
infrastructure exceeds the coverage infrastructure, creating “market pull” for the installation of additional
charging stations or the addition of plugs to existing stations.
Figure 1. PEV charging requirements evolution as a function of PEV market share.
This report quantifies non-residential EVSE requirements necessary to meet consumer coverage expectations
independent of PEV adoption level and to meet consumer demand in high PEV adoption scenarios. Coverage
and demand estimates are made for:
• Cities (486 Census Urban Areas, population greater than 50,000, 71% of U.S. population)
• Towns (3,087 Census Urban Clusters, population 2,500 to 50,000, 10% of U.S. population)
• Rural Areas (regions not covered by Census Urban Areas/Clusters, 19% of U.S. population)
• Interstate Highway System Corridors (28,530 miles of highway).
1.2.2 Scenario Discussion
The majority of this report describes an analytic process for estimating PEV non-residential charging
requirements within communities (cities, towns, and rural areas) and along Interstate corridors, assuming home
charging is the dominant behavior. While it is not the intention of this work to forecast the future PEV market,
PEV market scenarios are developed to exercise the infrastructure estimation methodology and highlight
sensitivities. The analysis assigns no probabilities to any PEV market scenarios and considers none of the
scenarios as most likely. However, a central scenario is established from which individual elements of the
modeling framework are studied using parametric sensitivity analysis. PEV market conditions for the central
scenario and sensitivities explored are shown in Table 1.
4NATIONAL PLUG-IN ELECTRIC VEHICLE INFRASTRUCTURE ANALYSIS
Table 1. PEV Market Conditions for the Central Scenario and Sensitivities Explored
Variable Central Scenario Sensitivity
PEV Total 15M (linear growth to 20% of 9M (growth to 10% of 2030 sales)
LDV sales in 2030) 21M (growth to 30% of 2030 sales)
PEV Mix Mix Long / Short
(range preference) PHEV20 10% PHEV20 0% / 40%
PHEV50 35% PHEV50 50% / 0%
BEV100 15% BEV100 0% / 50%
BEV250 30% BEV250 40% / 0%
PHEV20-SUV 5% PHEV20-SUV 0% / 10%
BEV250-SUV 5% BEV250-SUV 10% / 0%
Share of PEVs in Cities 83% 71% (based on existing LDVs)
(w/ pop. > 50k) (based on existing HEVs) 91% (based on existing PEVs)
PHEV:BEV Ratio 1:1 4:1 to 1:4
PHEV Support Half of full support No PHEV support to full support
(maximize PHEV eVMT)
SUV Share 10% 5% to 50%
% Home Charging 88% 88%, 85%, and 82%
Interstate Coverage Full Interstate Mega-regions, 80% of Long Distance
Trips (Traveler Analysis Framework
[TAF]), and Full Interstate
Corridor DCFC Spacing 70 miles 40 to 100 miles
DCFC Charge Time 20 minutes (150 kW) 10 to 30 minutes
(400 to 100 kW)
eVMT = miles achieved on electric power
SUV = sport utility vehicle
The central scenario arbitrarily assumes a linear growth in the sale of new PEVs, climbing to 20% of all light-
duty vehicle (LDV) sales in 2030. This sales rate would result in a total of 15 million PEVs on U.S. roads in
2030 (approximately 5% of the total U.S. LDV stock in 2030). Sensitivities around PEV sales are explored
between 9 and 21 million PEVs (10% to 30% of U.S. LDV sales in 2030).
The range preference variable is meant to reflect relative adoption of the short- and long-range PHEVs and
BEVs. For example, the central scenario features a preference for PHEVs with longer electric driving ranges,
resulting in greater shares for PHEV50s and BEV250s (relative to PHEV20s and BEV100s, respectively).
During the sensitivity analysis, a short-range preference is explored in which PEVs are exclusively comprised
of PHEV20 and BEV100 vehicles (the long-range sensitivity shifts all PEVs to PHEV50 and BEV250
vehicles).
PEVs clustered in cities versus widespread adoption across the United States directly affects the degree to
which infrastructure can be regionally concentrated. Three PEV dispersion scenarios are evaluated, each
5NATIONAL PLUG-IN ELECTRIC VEHICLE INFRASTRUCTURE ANALYSIS
informed by the spatial dispersion of existing LDVs across the United States. The central scenario assumes 15
million PEVs are dispersed among cities, towns, and rural areas proportional to existing registrations of hybrid
electric vehicles (HEVs). HEVs are considered a useful proxy for the spatial dispersion of an evolving PEV
market based on their status as an advanced technology powertrain that predates the introduction of modern
PEVs by approximately a decade. Allocating future PEVs using existing HEV registrations results in 83% of
PEVs being located in cities (population greater than 50,000). Sensitivities on the spatial dispersion of future
PEVs are developed based on the existing dispersion of all LDVs (71% in cities) and existing PEVs (91% in
cities). Registration data used to develop these estimates are discussed in Section 2.1.
The central scenario assumes a 1:1 ratio between future PHEVs and BEVs (similar to existing PEV
registrations, see Section 2.1). Arbitrary sensitivities around this parameter are explored, from 4:1 (80%
PHEV) to 1:4 (80% BEV).
PHEVs feature internal combustion engines for backup power and consequently have no hard requirements for
non-residential charging infrastructure. PHEVs can however utilize work and public Level 2 (L2) EVSE to
improve the percent of miles achieved on electric power (eVMT); however, PHEVs are restricted from using
DCFC in this analysis. Providing full PHEV support in this model implies enough charging plugs to enable
consumers to maximize eVMT (but not necessarily reach 100% eVMT as individual trips may exceed the
PHEV single charge range and L2 EVSE is restricted to destination charging in this project). Conversely,
providing no PHEV support implies that no L2 EVSE is allocated on behalf of PHEVs in the model. Partial
PHEV support is implemented in the central scenario reflecting 50% of full support.
The central scenario arbitrarily assumes a 10% sport utility vehicle (SUV) share within the PEV segment.
While relatively modest given the increasing popularity of SUVs in the context of all LDVs (including
conventional vehicles), existing PEV registrations reflect a mere 5% market share for electric SUVs (see
Section 3.2.2). SUV market shares within the PEV segment are explored between 5% and 50% during
sensitivity analysis.
All scenarios assume the majority of consumers prefer to do most of their charging at their home location. In
the central scenario, 100% of PEVs are simulated as having a home-dominant charging preference (resulting in
88% of charging taking place at home locations). Sensitivity analysis explores scenarios where 90% and 80%
of PEVs are simulated with home-dominant charging behavior, with the remainder having work- and public-
dominant charging behavior. This sensitivity results in PEVs performing 85% and 82% of charging at home
locations.
Central scenario analysis of the interstate corridor network considers full coverage with average DCFC station
spacing of 70 miles and a typical DCFC charge time of 20 minutes. DCFC coverage along the interstate
network, station spacing, and average charge time are explored using the sensitivity analysis shown in Table 1.
1.2.3 Report Structure
The remainder of this report is structured as follows. Section 2 reviews the current status of the PEV market
and EVSE infrastructure. Section 3 presents methods and results for non-residential community charging
requirements, including L2 charging and fast-charging stations. Section 4 presents methods and results for fast-
charging stations along interstate corridors. Finally, Section 5 summarizes the report’s findings and offers
insights to decision makers who are working to deploy an effective charging infrastructure network in the
United States.
6You can also read