Ethnicity and Nationality in the Irish Labour Market - RESEARCH SERIES - Irish Human ...
←
→
Page content transcription
If your browser does not render page correctly, please read the page content below

RESEARCH SERIES

Ethnicity and Nationality
in the Irish Labour Market
Frances McGinnity, Raffaele Grotti,
Sarah Groarke & Sarah Coughlan
RESEARCH SERIES

Ethnicity and Nationality
in the Irish Labour Market
Frances McGinnity, Raffaele Grotti,
Sarah Groarke & Sarah Coughlan
This report was written by Frances McGinnity, Raffaele Grotti, Sarah Groarke and Sarah Coughlan. It was prepared for the Irish Human Rights and Equality Commission by the Economic and Social Research Institute as part of the Research Programme on Human Rights and Equality. The report has been peer-reviewed prior to publication. The views expressed in this report are those of the authors and do not necessarily represent those of the Economic and Social Research Institute or the Irish Human Rights and Equality Commission. The Irish Human Rights and Equality Commission was established under statute on 1 November 2014 to protect and promote human rights and equality in Ireland, to promote a culture of respect for human rights, equality and intercultural understanding, to promote understanding and awareness of the importance of human rights and equality, and to work towards the elimination of human rights abuses and discrimination. The Economic and Social Research Institute (ESRI) is an independent research institute working towards a vision of ‘Informed policy for a better Ireland’. The ESRI seeks to support sustainable economic growth and social progress in Ireland by providing a robust knowledge base capable of providing effective solutions to public policy challenges. Available to download from www.esri.ie and www.ihrec.ie 2018. Copyright is held jointly by the Economic and Social Research Institute and the Irish Human Rights and Equality Commission. Irish Human Rights and Equality Commission, 16–22 Green Street, Dublin 7. The Economic and Social Research Institute, Whitaker Square, Sir John Rogerson’s Quay, Dublin 2 ISBN 978-0-7070-0479-2 DOI https://doi.org/10.26504/bkmnext369 This Open Access work is licensed under a Creative Commons Attribution 4.0 International License (https://creativecommons.org/licenses/by/4.0/), which permits unrestricted use, distribution, and reproduction in any medium, provided the original work is properly credited.
FOREWORD

I am very pleased to introduce this report Ethnicity and Nationality in the Irish Labour
Market. It is the fifth report conducted by the Economic and Social Research Institute as
part of the Commission’s Research Programme on Human Rights and Equality.

The principle of equality is articulated in our most basic law, the Irish Constitution, which
provides in Article 40 that ‘all citizens shall, as human persons, be held equal before the
law.’ The general principle of equality and non-discrimination is a fundamental element of
all core international human rights treaties. Article 1 of the Universal Declaration of Human
Rights states ‘All human beings are born free and equal in dignity and rights’. The right to a
life free from racial discrimination is articulated most comprehensively in the International
Convention on the Elimination of All forms of Racial Discrimination.

The Commission works in a variety of ways to protect and promote human rights and
equality in Ireland, building a culture of respect for human rights, equality and intercultural
understanding. The importance of employment for integration, and for inclusion in the
wider life of the community, cannot be overstated. This has been a key driver of the
Commission’s own work to date, most notably in its contribution as amicus curiae in the
successful appeal to the Supreme Court which found an outright ban on access to
employment for applicants for international protection to be unconstitutional. Quite simply,
in a just society, everyone should have equal access to employment opportunities,
experience equal treatment in the workplace and, enjoy equal labour market outcomes
regardless of their ethnicity.

The first report from this Research Programme Who Experiences Discrimination in Ireland?
Evidence from the QNHS Equality modules (2017) highlighted that some minority ethnic
groups experience high rates of discrimination. This occurred in both accessing employment
and in the workplace.

This report presents a more in-depth analysis of discrimination in the labour market to
ascertain if certain ethnic groups experience higher rates of work related discrimination
than others. Using data from the Equality module of the Quarterly National Household
Survey and the Labour Force Survey, this report examines if labour market outcomes
differed across ethnic groups between 2002 to 2014. It also examines the likelihood of being
employed rather than unemployed for different ethnicities, and the grades of employment
secured.

The picture emerging from the data is a timely reminder that the experience of different
ethnicities in Ireland cannot be reduced to simple generalisations. For example, the
evidence presented here shows that some ethnic groups, such as those who identify as
Asian-Irish or White EU-West, are at an advantage in the Irish labour market, both in terms
of access to employment and progression.

Of those groups who experience higher rates of exclusion from the labour market, and
higher rates of discrimination in work, that experience also varies. Of these, the group which
emerges as being most seriously disadvantaged are people who identify as Black or Black
Irish. While this group represents only a small fraction of the population – 1.4 per cent in
the last census – the lasting consequences of persistent exclusion from the labour market or
discrimination in work are significant enough to warrant close attention from policymakers.

Furthermore, given the importance of ethnicity in access to, and progression in, the labour
market, and the movement between some categories as people acquire Irish citizenship, it
is important that the measurement of this data is adequate to the complexities involved. It
is only by having an accurate picture of how different ethnic minorities fare in the labour
market that we can develop effective policy responses to address disadvantage and
discrimination.

The findings of this report are particularly timely, as Ireland is expected to be examined by
the UN Committee on the Elimination of All Forms of Racial Discrimination in 2019. The
Commission anticipates that the evidence presented in this report will be of assistance to
policymakers in the course of that examination, and potential policy responses in the
context of the State’s own Migrant Integration Strategy.

I would like to convey my thanks to the authors of this report, Professor Frances McGinnity,
Dr Raffaele Grotti, Sarah Groarke and Sarah Coughlan.

Emily Logan
Chief Commissioner,
Irish Human Rights and Equality Commission.
THE AUTHORS
Frances McGinnity is an Associate Research Professor at the ESRI and an Adjunct Professor
of Sociology at TCD. Raffaele Grotti was a Post-doctoral Research Fellow at the ESRI and is
currently a Research Fellow at the European University Institute (Italy). Sarah Groarke is a
Research Assistant at the Irish National Contact Point of the European Migration Network
(EMN), which is based in the ESRI. Sarah Coughlan was on a research internship at the ESRI
at the time of writing.

ACKNOWLEDGEMENTS
We gratefully acknowledge the funding received from the Irish Human Rights and Equality
Commission (IHREC) to support this research programme. We would like to thank Cliona
Doherty (IHREC), Iris Elliott (IHREC) and Gráinne Collins (NDA) for their input and
constructive comments. Other comments from IHREC were also incorporated. The report
also benefited greatly from the comments of two ESRI reviewers, and an external expert
reviewer, as well as Professor Emer Smyth, who acted as editor of the report.
Table of contents | iii

TABLE OF CONTENTS

GLOSSARY           ............................................................................................................................VII

EXECUTIVE SUMMARY .............................................................................................................. IX

CHAPTER 1 INTRODUCTION AND CONTEXT ............................................................................ 1

1.1               Introduction .......................................................................................................... 1
1.2               Migration and labour market context .................................................................. 2
1.3               Relevant legal and policy framework ................................................................. 10

CHAPTER 2 WHY DO LABOUR MARKET OUTCOMES DIFFER ACROSS ETHNIC/NATIONAL
                  GROUPS?............................................................................................................. 15

2.1               Introduction ........................................................................................................ 15
2.2               Country-level policies and legal framework ....................................................... 15
2.3               Personal characteristics of immigrants .............................................................. 17
2.4               Employer/host country behaviour ..................................................................... 18
2.5               Previous findings in Ireland ................................................................................ 19
2.6               Research questions ............................................................................................. 21

CHAPTER 3 MEASURING ETHNIC/NATIONAL GROUPS IN THE EQUALITY MODULES ........... 23

3.1               Evidence base: The QNHS and Equality modules ............................................... 23
3.2               Defining ethnic/national groups in the Equality modules.................................. 25
3.3               The profile of migrants: education, age, sex, length of residence and principal
                  economic status .................................................................................................. 28

CHAPTER 4 LABOUR MARKET INEQUALITIES ACROSS ETHNIC AND NATIONAL GROUPS..... 35

4.1               Introduction ........................................................................................................ 35
4.2               Inequality in access to employment ................................................................... 35
4.3               Inequality in access to top jobs .......................................................................... 45
4.4               Summary and conclusions .................................................................................. 51
iv | Ethnicity and nationality in the Irish labour market
CHAPTER 5 THE EXPERIENCE OF DISCRIMINATION AMONG ETHNIC AND NATIONAL
GROUPS .............................................................................................................. 53
5.1 Introduction ........................................................................................................ 53
5.2 Looking for work ................................................................................................. 54
5.3 Discrimination in the workplace ......................................................................... 60
5.4 Summary and conclusions .................................................................................. 64
CHAPTER 6 CONCLUSION ...................................................................................................... 67
6.1 Summary of findings ........................................................................................... 67
6.2 Policy implications .............................................................................................. 70
REFERENCES ............................................................................................................................ 75List of tables / figures | v
LIST OF TABLES
Table 1.1 Total population by nationality, 2002-2014..................................................... 8
Table 1.2 Population by ethnic or cultural background 2006, 2011 and 2016 ............... 9
Table 3.1 Classification of ethnicity and nationality ...................................................... 27
Table 4.1 Logistic regression for employment versus unemployment (odds ratios) .... 39
Table 4.2 Logistic regression for accessing top jobs (odds ratios)................................. 48
Table 5.1 Logistic regression of discrimination seeking work (odds ratios) .................. 57
Table 5.2 Logistic regression: discrimination in the workplace (odds ratios) ............... 62
Table 6.1 Summary of model findings on labour market outcomes and the
experience of discrimination for each ethnic/national group ....................... 68
LIST OF BOXES
Box 3.1 Definition of discrimination provided for Equality module (prompt card).... 25vi | Ethnicity and nationality in the Irish labour market
LIST OF FIGURES
Figure 1.1 Immigration, emigration and net migration, 1987-2017 ................................. 3
Figure 1.2 Nationality of immigration flows, 2004-2014 .................................................. 4
Figure 1.3 Unemployment rates (ILO), Ireland, 2002-2016 ............................................ 10
Figure 3.1 Highest educational attainment by ethnic/national group ........................... 29
Figure 3.2 Age profile of ethnic/national groups ............................................................ 30
Figure 3.3 Gender profile of ethnic/national groups ...................................................... 31
Figure 3.4 Length of residence in Ireland by ethnic/national group .............................. 32
Figure 3.5 Principal economic status by ethnic/national group ..................................... 33
Figure 4.1 Employment rate by ethnicity and nationality .............................................. 37
Figure 4.2 Differences in the predicted probabilities of being employed for
ethnic/national groups compared with White Irish over time ...................... 44
Figure 4.3 Share of top jobs among employed people by ethnicity and nationality ...... 46
Figure 4.4 Differences in the predicted probabilities of being in a top job position
for ethnic/national groups compared with White Irish over time ................ 50
Figure 5.1 Experience of discrimination seeking work by ethnic/national group .......... 55
Figure 5.2 Differences in the predicted probabilities of experiencing recruitment
discrimination for ethnic/national groups compared to White Irish over
time ................................................................................................................ 59
Figure 5.3 Experience of workplace discrimination by ethnic/national group ............... 61
Figure 5.4 Differences in the predicted probabilities of experiencing workplace
discrimination for ethnic/national groups compared to White Irish over
time ................................................................................................................ 64Glossary | vii
GLOSSARY
CSO Central Statistics Office
EEA European Economic Area, which comprises the EU Member States
plus Iceland, Liechtenstein and Norway
Ethnicity Self-defined ethnic group based on Irish Census classification of
ethnicity
Ethnic/national group Unique classification into up to ten groups based on a combination
of self-defined ethnicity and whether respondents are Irish citizens
or not.
EU-East EU Member States that joined the EU in 2004 (Cyprus, Czech
Republic, Estonia, Hungary, Latvia, Lithuania, Malta, Poland,
Slovakia and Slovenia), 2007 (Bulgaria and Romania) and 2013
(Croatia).
EU-West ‘Old’ EU Member States, excluding Ireland and the UK: Austria,
Belgium, Denmark, Finland, France, Germany, Greece, Italy,
Luxembourg, Netherlands, Portugal, Spain and Sweden.
FRA Fundamental Rights Agency
GDP Gross Domestic Product
ILO International Labour Organization
Labour market active Active in the labour market, includes employed and unemployed
Nationality Respondents are asked if they are an Irish citizen. If they are not
Irish citizens, they are asked for their nationality
OECD Organisation for Economic Co-operation and Development
OPMI Office for the Promotion of Migrant Integration
PES Principal Economic Status (as defined by the respondent)
QNHS Quarterly National Household Survey
QQI Quality and Qualifications IrelandExecutive Summary | ix
EXECUTIVE SUMMARY
The marked increase in immigration that accompanied the economic boom of the late
1990s and early 2000s has brought considerable ethnic and national diversity to Ireland. 1
This report investigates how different ethnic and national groups have fared in the Irish
labour market. Employment leads to financial independence and reduces the risk of poverty
and social exclusion: it also facilitates immigrants’ integration into society as a whole (OECD,
2015).
The report uses three large, identical, nationally representative surveys of the population to
examine outcomes in 2004, 2010 and 2014; three very different labour market contexts in
Ireland (boom, recession and early recovery). The data used measured both an individual’s
employment status and the kind of jobs they held (specifically whether they were working in
a professional/managerial job), as well as their experience of discrimination in looking for
work and in the workplace. Discrimination is understood here as a situation in which
individuals are treated less favourably due to their membership of a specific group.
Respondents were asked whether they believed they had experienced discrimination
according to a definition that reflects Irish law. 2
Is there evidence of disadvantage for ethnic minorities and does nationality play any role in
labour market inequality and the experience of discrimination? The role of ethnicity and
nationality is explored by creating ten ethnic/national groups based on respondents’
reported ethnicity and whether or not they are Irish citizens – White Irish, Black Irish, Asian
Irish, Other ethnicity Irish, White UK, White EU-West, White EU-East, Black non-Irish, Asian
non-Irish and Other ethnicity non-Irish (see Glossary). Ethnic minority Irish nationals can
include foreign-born immigrants who acquired Irish citizenship through naturalisation
(either by residing in Ireland for at least five years or through marriage) and individuals who
were born in Ireland.
1
Irish Travellers are a small Irish ethnic minority group who are extremely disadvantaged in the Irish labour
market (Watson et al., 2017). They are separately identified in the Equality surveys only in 2014, so it was
not possible to include them in this study, but reference is made to earlier work on their experience of
labour market discrimination where relevant (McGinnity et al., 2017).
2
See Chapter 3 for how exactly discrimination is defined for survey respondents.x | Ethnicity and nationality in the Irish labour market
HEADLINE FINDINGS
When we account for differences between groups that we expect to influence labour
market outcomes - educational qualifications, age, gender, family type, broad region and
length of time living in Ireland - we find for all three years combined:
• Differences between White UK nationals and the White Irish group are minimal for
all outcomes - employment rates, occupational position, and the experience of
discrimination seeking work and in the workplace;
• White EU-West nationals are actually more likely to be employed than White Irish,
while there is no difference in terms of occupational position, in discrimination
seeking work and in the workplace;
• For White EU-East nationals, we find no difference in employment rates or
reported discrimination seeking work, but this group are more likely to experience
discrimination in the workplace (1.5 times as likely). Members of this group are also
considerably less likely to occupy managerial/professional jobs (0.2 times as likely);
• The White non-EU group shows no difference in employment rates or occupational
position compared to White Irish, but their experience of discrimination in the Irish
labour market differs from their Irish counterparts. They are more likely to report
discrimination seeking work, possibly due to the fact that most of them need an
employment permit to work in Ireland. They are also more likely to experience
discrimination in the workplace than White Irish (1.6 times as likely);
• The Black non-Irish group is much less likely to be employed (0.4 times as likely)
and when individuals from this group do have a job, they are also much less likely
(0.3 times as likely) to hold a managerial/professional job than White Irish. The
Black non-Irish group are five times as likely as White Irish to experience
discrimination seeking work and 2.7 times as likely to experience discrimination in
the workplace;
• The Black Irish group shows little difference to the majority White Irish population
in terms of overall employment. Yet for occupational position, the group shows
considerable disadvantage, being much less likely (0.3 times as likely) to hold a
managerial/professional job than White Irish. Black Irish are twice as likely toExecutive Summary | xi
experience discrimination seeking work and 3.4 times as likely to experience
discrimination in the workplace as White Irish. In overall employment rates and in
seeking work there seems to be an advantage to being Irish for those of Black
ethnicity, but not in the workplace or occupational position of the job;
• The Asian non-Irish group does not differ from White Irish in terms of their overall
employment rates but they are less likely to be in the top jobs (0.5 times as likely).
Asian non-Irish do not differ significantly from White Irish in discrimination seeking
work;
• The Asian Irish group does not differ from White Irish in terms of employment rates
and Asian Irish are actually advantaged in occupational position that is more likely
to be working in professional/managerial occupations than White Irish (1.9 times as
likely). This may be related to immigration policy, which restricts employment
permits for non-EU nationals to high-skilled jobs;
• Asian Irish do not differ from White Irish in their experience of discrimination
seeking work but are 1.9 times as likely to experience discrimination in the
workplace than White Irish. Workplace discrimination can include bullying or
harassment, unfair treatment in terms of working conditions, promotion, pay and
other forms of discrimination.
• No clear trends emerge when we look at changes over the period 2004-2014, but
we observe some interesting patterns for individual groups. For example the gap in
employment rates between White Irish and Black non-Irish is much smaller in 2014
than in earlier years. For most ethnic/national groups the gap between them and
White Irish in terms of occupational position is smaller in 2014 too; the exception
here is the White Non-EU group.
• Looking at change over time in the experience of discrimination seeking work, we
find gaps between White Irish and most groups narrowing somewhat in the period
2004-2014. In terms of the experience of discrimination in the workplace, by
contrast, the gap between White Irish and Minorities Irish was larger in 2014
compared to earlier years. Note some of these changes over time may be due to
changes in the composition of the groups over time.xii | Ethnicity and nationality in the Irish labour market IMPLICATIONS FOR POLICY AND DATA COLLECTION This report documents considerable variation in the outcomes of ethnic/national groups in the Irish labour market in this period and reflects on the policy implications of these differences. One implication of the findings is the importance of recognising qualifications acquired abroad. While Quality and Qualification Ireland (QQI) provides assistance to non- Irish nationals in having qualifications recognised, it is crucial that awareness of this system is promoted among both immigrants and employers to prevent skills being underutilised and facilitate occupational mobility. Programmes that allow migrants to acquire and develop skills relevant to the Irish labour market, including English language programmes, should complement efforts to ensure recognition of qualifications, in order to address the disadvantage migrants may experience and ensure occupational progression. The much higher rates of labour market discrimination experienced by some ethnic/national groups highlights the need for both government and employer-led policies to monitor, prevent and respond to incidences of discrimination in recruitment and in the workplace. While legislative measures to respond to employment discrimination have been in place in Ireland for some time, other measures to prevent discrimination are also necessary to promote equality of opportunity. Given low knowledge of rights among some minority, ethnic and immigrant groups, awareness-raising efforts should be coupled with provision of information to immigrant communities about equality legislation and the supports available to them. Ethnicity is a key locus of disadvantage in this report. However it is rarely measured in repeated survey data in Ireland. The regular collection of ethnicity in labour market surveys is a key priority at this time. Furthermore, the acquisition of Irish citizenship among non-EU nationals and also the growing second generation brings new challenges to measure and monitor the experience of immigrants in Ireland and these challenges also have to be addressed if adequate policy responses to disadvantage are to be developed.
Introduction and context | 1

CHAPTER 1

Introduction and context

1.1    INTRODUCTION

The inward migration that accompanied the economic boom of the late 1990s and early
2000s has brought increased ethnic and national diversity to Ireland. There has always been
some ethnic and national diversity in Ireland – in particular an Irish-born ethnic-minority
group, Irish Travellers (Watson et al., 2017), and a significant minority of UK nationals
(O’Connell and McGinnity, 2008) – but ethnic and national diversity increased considerably
as a result of rapid immigration. This report investigates how these different ethnic and
national groups have fared in the Irish labour market using large representative datasets
from 2004, 2010 and 2014.

While some research has focused on the difficulties immigrants face in labour market
integration, other work has highlighted the role of ethnicity, arguing that ethnic minorities
face disadvantage regardless of whether they were born in the country due, among other
factors, to ethnic/racial discrimination. This report combines a focus on country of origin,
nationality and ethnicity to explore both labour market outcomes and the experience of
labour market discrimination. As a sizeable proportion of those from an ethnic minority
background are now Irish citizens, the report also explores if having Irish citizenship is
associated with less disadvantage and discrimination.

Chapter 1 sets the context by describing the changing pattern of immigration and key
features of Irish migration policy - the employment permit system and the international
protection system. It documents the increased national and ethnic diversity in Ireland, as
well as dramatic change in the Irish labour market during the period (2004-2014). It also
discusses the equality and non-discrimination framework and the recent Migrant
Integration Strategy. Chapter 2 discusses country-level policies and the legal framework
which determines the conditions under which migrants can work in Ireland, as well as the
role of factors such as education, duration of residence and discrimination in understanding
migrants’ labour market outcomes. Chapter 3 presents the evidence base, the Equality
2 | Ethnicity and nationality in the Irish labour market

modules combined with the Labour Force Survey (QNHS), and in particular how we create
the ethnic/national groups to investigate key research questions. A profile of
ethnic/national groups is also presented. Chapter 4 looks at labour market inequalities
across ethnic and national groups, and whether they have changed over time. Specifically it
considers employment rates and the likelihood of having a professional/managerial job,
while controlling for other characteristics related to occupational position, such as
education, age and length of residence in Ireland. Chapter 5 focuses on ethnic/national
variation in the experience of discrimination both in seeking a job and in the workplace.
Chapter 6 presents a summary and a reflection of some policy implications.

1.2     MIGRATION AND LABOUR MARKET CONTEXT

1.2.1 Immigration flows

A country where more people left than arrived prior to the 1990s, Ireland has experienced
considerable changes in migration flows in the past two decades, due to the expansion of
the European Union in 2004 and the economic boom from the mid-1990s up to 2007 known
as the ‘Celtic Tiger’. Figure 1.1 shows that the inflow of migrants almost tripled from around
58,500 in 2004 to a peak of around 151,100 in 2007. Ireland’s entry into recession in 2008
led to a rapid decrease in immigration, with rising emigration of both Irish and non-Irish
nationals resulting in net emigration from 2009. However, with economic recovery and the
renewed demand in the labour market that followed, immigration flows have risen steadily
since 2010, increasing by almost 60 per cent from 41,800 in 2010 to 66,500 in 2014 and by a
further 27 per cent to 84,600 in 2017.
Introduction and context | 3
FIGURE 1.1 IMMIGRATION, EMIGRATION AND NET MIGRATION, 1987-2017
200,000
150,000
100,000
50,000
0
-50,000
1987
1988
1989
1990
1991
1992
1993
1994
1995
1996
1997
1998
1999
2000
2001
2002
2003
2004
2005
2006
2007
2008
2009
2010
2011
2012
2013
2014
2015
2016
2017
Immigrants Emigrants Net Migration
Source: CSO, Population and Migration Estimates.
Note: Year to April of reference year.
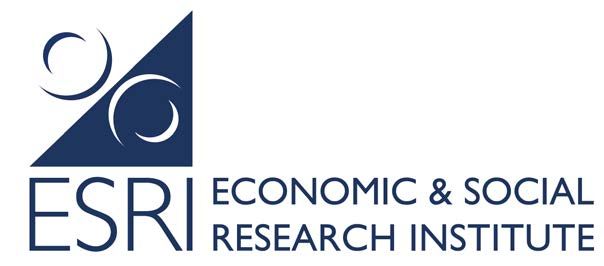
Figure 1.2 presents the composition of immigration flows according to nationality and
shows how the expansion of the EU had a considerable impact on immigration flows. When
ten countries joined the EU in 2004, Ireland was one of only three EU Member States to
grant nationals of those countries immediate and full access to the labour market. By 2007,
nationals of EU-East accounted for 56 per cent of immigration flows to Ireland. In contrast,
when Bulgaria and Romania joined the EU in 2007, nationals of both Member States were
not automatically granted full access to the labour market. It was only in 2012 that Bulgarian
and Romanian nationals were granted full access to the labour market and accordingly
afforded employment rights equivalent to those enjoyed by other EU nationals.
Immigration of both EU-East and non-EU nationals subsequently declined between 2007
and 2010, when inflows of EU-East in particular sharply decreased by 89 per cent during the
recession. Figure 1.2 shows that overall immigration increased for all national groups
between 2010 and 2014, particularly among non-EU nationals, with non-EU arrivals
increasing from 6,000 to 19,000.4 | Ethnicity and nationality in the Irish labour market
FIGURE 1.2 NATIONALITY OF IMMIGRATION FLOWS, 2004-2014
160,000
140,000 Non-EU
120,000
EU-West
100,000
80,000 EU-East
60,000
UK
40,000
20,000
Irish
0
2004 2005 2006 2007 2008 2009 2010 2011 2012 2013 2014
Source: CSO ‘Population and Migration Estimates’, various releases.
Notes: Year to April of reference year. For definitions of EU-East and EU-West see Glossary.
1.2.2 Access to employment for non-EU nationals
The low proportion of non-EU nationals in immigration flows to Ireland is reflective of
Ireland’s labour migration policy. Nationals of the European Economic Area (EEA) are
entitled to reside and work in Ireland without restriction. The EEA includes citizens of the EU
in addition to Iceland, Liechtenstein and Norway. For the purposes of this study, non-EU
nationals refer to nationals of countries outside of the EEA. Unlike EU nationals who have
the right to reside and work in Ireland, access to the labour market for non-EU nationals is
regulated by labour migration policy. Most newly arrived non-EU nationals are not entitled
to automatic access to the Irish labour market and must hold an employment permit in
order to take up employment. The employer permit system is employer-based, meaning
permit holders can only work for the employer and in the occupation stated on the permit.
In 2003, over 47,500 employment permits were issued to non-EU nationals for occupations
across skill levels (Ruhs, 2005). However, to coincide with EU enlargement in 2004, the
government adopted the Employment Permits Act 2003, which introduced a number of
regulations limiting non-EU migration to the most highly-skilled occupations, on the basis of
a policy oriented towards meeting labour market needs from within the EU.Introduction and context | 5 The move to a more restrictive, skills-based permit system, and implementation of policies requiring employers to give preference to EU nationals in recruitment, played an important part in the shifting nature of immigration flows to Ireland (Ruhs, 2005). By 2007, the number of employment permits issued to non-EU nationals decreased by over 50 per cent to 23,604 and continued to decrease until 2013, when only 3,863 permits were issued. In 2014, the Employment Permits (Amendment) Act 2014 introduced a number of reforms to the permit system, including providing for flexibility to respond to labour market needs. In light of economic recovery at the time and growing shortages in certain sectors of the labour market, the issuing of employment permits began to increase again in 2014, when 5,495 permits were granted to non-EU nationals (Gusciute et al., 2015). Some non-EU nationals may also access employment without the need for an employment permit in certain circumstances. Non-EU nationals who hold a Stamp 4 residence permission, such as beneficiaries of international protection, and other resident non-EU nationals, such as those who may have permission to remain as a spouse, civil partner or dependant of an Irish/EU citizen, enjoy rights equivalent to those enjoyed by Irish and EU nationals in seeking employment. Non-EU students who hold a Stamp 2 residence permission may also access the labour market for up to 20 hours during term-time and on a full-time basis during holiday periods, while certain non-EU graduates may access employment on a Stamp 1G permission for periods of up to two years following graduation. Migrants working in Ireland who entered Ireland legally may also become undocumented through exploitation or administrative delay and may be in situations of precarious employment (Arnold et al., 2017). 1.2.3 The international protection system Non-EU nationals fleeing persecution or serious harm in their country of origin may be granted international protection in Ireland, in line with Ireland’s obligations to provide protection to refugees under the 1951 Convention on the Status of Refugees. In line with overall immigration flows in Ireland, the number of persons seeking international protection in Ireland grew in the late 1990s, with applications significantly increasing from 39 in 1992 to 11,634 in 2002. From 2002, applications decreased year-on-year to 946 in 2013. In 2014, applications for international protection rose sharply by 53 per cent to 1,448 (Office of the Refugee Applications Commissioner, 2014). From 2001 to 2013, Nigeria was recorded as the
6 | Ethnicity and nationality in the Irish labour market

top country of origin of persons seeking international protection, while nationals of
Pakistan, Democratic Republic of the Congo, Zimbabwe and China have also regularly
featured in the top five countries of origin over this period.

Persons awaiting a decision on an application for international protection are
accommodated in direct provision.3 While it was initially intended that international
protection applicants would spend only short periods in the international protection system,
in practice many have spent several years awaiting a decision on their application. At the
end of 2014, 4,364 international protection applicants were residing in direct provision
accommodation centres in Ireland, 2,722 (63 per cent) of whom had been in the
international protection system for more than three years. In the same year, 894
international protection applicants (20 per cent) were awaiting a final decision for seven
years or more (Reception and Integration Agency, 2015). In 2015 the government
introduced the International Protection Act 2015, which includes a number of measures to
improve the efficiency of the international protection process and to reduce the time
international protection applicants spend awaiting a decision in the direct provision system.

Until recently international protection applicants were prohibited from seeking employment
in Ireland. In May 2017, the Supreme Court in NHV v. Minister for Justice and Equality and
ors 4 held that, in circumstances where there is no time limit on the international protection
process, the absolute prohibition on seeking employment is contrary to the constitutional
right to seek employment. Following the judgment, the Government announced in June
2018 that international protection applicants who had not received a first instance decision
on their application for international protection within nine months would be permitted to
seek employment, subject to conditions, in line with the EU (recast) Reception Conditions
Directive (2013/33/EU). As of October 2018, 2,150 international protection applicants had
applied to the Minister for Justice and Equality for labour market access permission, 1,521

3
    Direct provision is the system in which international protection applicants are given full board in
    accommodation centres operated by the Reception and Integration Agency, while waiting for a decision
    on their application for international protection. Each international protection applicant currently
    receives a personal allowance of €21.60 per week.
4
    [2017] IESC 35.
Introduction and context | 7
of whom were granted permission. Of the 1,521 applicants granted permission, 330
applicants had secured employment. 5
As highlighted by the Irish Human Rights and Equality Commission in its submissions as
amicus curiae to the Supreme Court in the NHV case, the denial of the right to work to
international protection applicants over a period of many years may have had a severe
impact on their ability to access employment once they are entitled to do so (see also Ní
Raghallaigh et al., 2016). 6
1.2.4 Immigration stock: nationality and ethnicity
Ireland’s relatively recent history of large-scale immigration is reflected in the high
proportion of foreign-born persons in the Irish population. Table 1.1 shows that the
proportion of non-Irish persons in 2002 almost doubled from 5.8 per cent to reach 10.2 per
cent in 2006.
The proportion of non-Irish nationals resident in Ireland further increased to 12.7 per cent in
2009. Table 1.1 shows that this proportion gradually decreased to 12.3 per cent in 2010 and
continued to fall to 11.4 per cent in 2014. The decrease in the years leading up to 2014 is
partly attributed to the increase of non-Irish nationals acquiring Irish citizenship particularly
from 2011, both due to an increase in eligible migrants applying for naturalisation and the
introduction of reforms to reduce a backlog of applications at the time (Barrett et al., 2017).
The number of new Irish citizens increased from 6,300 in 2010 to over 25,000 in 2012 and
decreased to 21,104 in 2014 (Eurostat, 2018).
5
www.rte.ie/news/2018/1022/1005825-asylum-seekers.
6
Section 10(2)(e) of the Irish Human Rights and Equality Commission Act 2014 provides that the Irish
Human Rights and Equality Commission may apply to the High Court or Supreme Court as amicus curiae
(friend of the court) in proceedings that concern human rights or equality of any person.8 | Ethnicity and nationality in the Irish labour market
TABLE 1.1 TOTAL POPULATION BY NATIONALITY, 2002-2014
% Change
Nationality 2002 2006 2010 2014
2002 - 2014
Irish 3,584,975 3,802,400 3,994,700 4,117,600 14.9
UK 103,476 115,500 115,900 107,100 3.5
EU-West 29,960 43,800 52,400 56,900 89.9
EU-East N/A 132,500 233,000 242,800 83.2*
Non-EU 90,825 138,800 158,700 121,000 33.2
Total Population 3,917,200 4,232,900 4,554,800 4,645,400 18.6
Total non-Irish 224,261 430,600 560,000 527,800 135.4
% non-Irish 5.8 10.2 12.3 11.4
Source: CSO, Census 2002; CSO, ‘Population and Migration Estimates’, various releases.
Notes: Population by nationality was not available for 2004.
EU-East 2006 data represent the ten EU Member States that joined the EU in 2004: Cyprus, Czech Republic, Estonia, Hungary,
Latvia, Lithuania, Malta, Poland, Slovakia, Slovenia; EU-East 2010 data also include Bulgaria and Romania, which joined the EU
in 2007; EU-East 2014 data include Croatia, which joined the EU in 2013.
* Percentage change for EU-East represents change between 2006 and 2014. As the countries in the EU-East category would
have been included in the 2002 non-EU figure, the percentage change for EU-East between 2002 and 2014 is likely to be much
greater.
Information on ethnicity and cultural background was collected for the first time in Census
2006, and was subsequently collected in 2011 and 2016.7 Table 1.2 shows that the
population is of a predominantly White ethnic or cultural background, at 92.4 per cent of
the population in 2016. The number and proportion of people who indicated an ethnicity or
cultural background other than ‘White Irish’ increased significantly between 2006 and 2016.
Of the population who indicated an ethnic or cultural background other than ‘White Irish’,
‘Other White’ remains the largest group, at 9.5 per cent (446,727) of the population in 2016,
increasing by more than 54.6 per cent since 2006. While persons reporting an Asian or Asian
Irish ethnic or cultural background increased between 2006 and 2016, persons of Asian
ethnic or cultural background account for a much smaller proportion of the population, at
2.1 per cent (98,720) in 2016. The number of persons reporting a ‘Black or Black Irish’ ethnic
or cultural background also increased between 2006 and 2016, however they have
remained at a consistently low proportion of the population, amounting to 1.4 per cent
(64,639) in 2016. A large number of people did not disclose their ethnic or cultural
background in the 2016 Census.
7
The question wording has not changed since it was first fielded in 2006, though may be slightly modified
in the 2021 Census following consultation.Introduction and context | 9
TABLE 1.2 POPULATION BY ETHNIC OR CULTURAL BACKGROUND 2006, 2011 AND 2016
Reported ethnic or
2006 2011 2016
cultural background
Persons % Persons % Persons %
White 3,956,609 94.8 4,264,465 94.2 4,331,940 92.4
Irish 3,645,199 87.4 3,821,995 84.5 3,854,226 82.2
Irish Traveller 22,369 0.5 29,495 0.7 30,987 0.7
Other White 289,041 6.9 412,975 9.1 446,727 9.5
Black or Black Irish 44,318 1.1 65,078 1.4 64,639 1.4
Asian or Asian Irish 52,345 1.3 84,690 1.9 98,720 2.1
Other, including Mixed 46,438 1.1 40,724 0.9 70,603 1.5
Not Stated 72,303 1.7 70,324 1.6 124,019 2.6
Total 4,172,013 100.0 4,525,281 100.0 4,689,921 100.0
Source: CSO, Census 2006; Census 2011; Census 2016.
1.2.5 The Irish labour market
The period of 2004 to 2014, which the data analysis in later chapters covers, was also one of
dramatic change for the Irish labour market. Between 2000 and 2007, Ireland experienced
extremely strong economic growth: construction boomed, standards of living were at an all-
time high and the unemployment rate averaged 4.5 per cent per annum. However, the
collapse of the construction and banking sectors precipitated by the global financial crisis
meant that the Irish economy entered a deep recession in 2008, with severe labour market
consequences. Figure 1.3 shows that by the fourth quarter of 2010, 14 per cent of the
labour force in Ireland were unemployed (CSO, 2012). Job losses were particularly dramatic
in the construction sector, but also administrative and support services, industry, wholesale
and retail sectors (Russell et al., 2014).10 | Ethnicity and nationality in the Irish labour market
FIGURE 1.3 UNEMPLOYMENT RATES (ILO), IRELAND, 2002-2016
16%
14%
12%
10%
8%
6%
4%
2%
0%
2002 2004 2006 2008 2010 2012 2014 2016
Source: CSO QNHS Q4 2002-2016.
Note: Unemployment rate for the labour market active population in Ireland.
Job losses were combined with dramatic cuts in public expenditure and public sector wages,
a recruitment freeze in the public sector, and large tax increases (O’Connell, 2013). The Irish
economy began to recover in 2011. After three successive years of falling GDP, Ireland
recorded a positive GDP growth rate in 2011 of 1.4 per cent, and unemployment rates
began to decrease after 2010 as the economy showed signs of recovery. Figure 1.3 shows
that unemployment continued to fall, reaching around 10 per cent by 2014 – the final time
point in the data used for this study. 8 Unemployment would continue to decrease in the
years following 2014, which reflects the sustained improvements in the labour market since
the recession.
1.3 RELEVANT LEGAL AND POLICY FRAMEWORK
1.3.1 Equality and non-discrimination in Irish law
The Employment Equality Acts 1998-2015 and Equal Status Acts 2000-2015
In Ireland, protection against discrimination is provided for by the Employment Equality Acts
1998-2015, which prohibit discrimination in employment-related areas and by the Equal
Status Acts 2000-2015, which prohibit discrimination in the provision of goods and services,
8
Source: CSO Statbank, Quarterly National Household Surveys.Introduction and context | 11
accommodation and access to education. Under the Acts, discrimination is deemed to occur
when a person is treated less favourably than another person is, has been or would be
treated in a comparable situation on the grounds of gender, civil status, family status, age,
disability, race, sexual orientation, religious belief, membership of the Traveller Community
and/or (in the case of the Equal Status Acts 2000-2015) receipt of housing assistance.9
Discrimination on the ground of race is described as discrimination on the basis of being of
different race, colour, nationality or ethnic or national origins.10 The Acts address both
direct and indirect discrimination: direct discrimination occurs when a person is treated less
well than another person in the same situation or circumstances under any of the ten
grounds covered in the Acts; indirect discrimination refers to practices or policies that do
not appear on the face of it to be discriminatory but have a discriminatory impact.
The Employment Equality Acts 1998-2015 aim to ensure equality of opportunity in relation
to employment for both Irish and non-Irish nationals. The Acts prohibit discrimination in
relation to accessing employment, working conditions, training in the workplace,
harassment, as well as other employment-related areas. A person who believes they have
been discriminated against on the grounds of race may seek redress via the Workplace
Relations Commission 11 and on appeal to the Labour Court. 12 In 2017, 189 of 1,113
complaints referred to the Workplace Relations Commission under the Employment
Equality Acts were based on the race ground, comprising 17 per cent of all complaints made
(WRC, 2018). The race ground was the highest and second highest ground cited in appeals
to the Labour Court in 2014 and 2015 respectively (Labour Court, 2015; 2016).
Informal means of reporting discrimination and racism in the workplace are also provided
through NGOs such as the European Network Against Racism Ireland, which established the
online iReport Racist Incident Reporting System in 2013.13 This discussion focuses on current
9
Employment Equality Act 1998, as amended, s 6(1); Equal Status Act 2000, as amended, s 3(1).
10
Employment Equality Act 1998, as amended, s 6(2)(h).
11
Employment Equality Act 1998, as amended, s 77. Decisions are published at
www.workplacerelations.ie/en/cases. Note that the Workplace Relations Commission also handles claims
regarding service-related discrimination under the Equal Status Acts 2000-2015, though the majority of
cases are employment-related cases.
12
Employment Equality Act 1998, as amended, s 83. Prior to 2015, employment-related discrimination
claims were made to the Equality Tribunal.
13
www.ireport.ie.12 | Ethnicity and nationality in the Irish labour market
provision, though note the period covered by the data in this report, 2004-2014, was a
period of considerable change in institutions concerned with discrimination in Ireland.
Fanning and Michael (2017) argue that much of the institutional infrastructure for
monitoring, reporting and responding to racism and discrimination in Ireland, such as the
National Consultative Committee on Racism and Interculturalism, was dismantled during the
recession and has not been replaced.
The Irish Human Rights and Equality Commission Act 2014
The Irish Human Rights and Equality Commission (IHREC) was established in 2014 as the
national human rights institution and national equality body for Ireland, merging two
organisations, the Equality Authority and the Irish Human Rights Commission. In line with
the Irish Human Rights and Equality Commission Act 2014 (the 2014 Act), IHREC has a
specific role in promoting human rights and equality and working toward the elimination of
discrimination, including in the areas covered by the Employment Equality Acts. 14 IHREC is
responsible for providing information to the public on the Acts, reviewing the effectiveness
of the Acts and, where it deems necessary, making proposals to the Minister to amend the
Acts. 15 IHREC may in some circumstances provide legal assistance to persons who wish to
bring a claim relating to discrimination under the Acts to the Workplace Relations
Commission. 16 IHREC can also prepare codes of practice relating to the elimination of
discrimination,17 and can invite particular organisations to carry out an equality review, or
can itself carry out reviews of organisations with more than 50 employees, to determine
whether the policies and practices are conducive to the promotion of equality of
opportunity. 18
The 2014 Act also established the Public Sector Equality and Human Rights Duty, which is a
statutory obligation that requires public bodies to have regard to the need to promote
equality, prevent discrimination and protect the human rights of employees, customers and
14
Irish Human Rights and Equality Commission Act 2014, s 10.
15
Irish Human Rights and Equality Commission Act 2014, s 30(1).
16
Irish Human Rights and Equality Commission Act 2014, s 40.
17
Irish Human Rights and Equality Commission Act 2014, s 31.
18
Irish Human Rights and Equality Commission Act 2014, s 32.Introduction and context | 13
service users.19 The Act sets out three steps that must be taken by public bodies to
implement the duty, which include setting out in their strategic plan an assessment of
human rights and equality issues relevant to their functions, setting out the policies and
practices in place or proposed to be put in place to address these issues, and reporting on
developments and achievements in this regard. Public sector duties in other jurisdictions
have been shown to enhance the provision of public services to reduce inequalities and
drive cultural change within the public sector (Equality and Rights Alliance, 2015). In carrying
out assessments, public bodies have identified issues such as the need to promote and raise
awareness of cultural diversity to inform employment practices, support staff from diverse
backgrounds and inform service delivery to diverse communities. IHREC promotes the
implementation of the duty by public bodies and may invite public bodies to review their
implementation of the duty if there is evidence of failure by a public body to perform its
functions in line with the duty. The duty encourages a more proactive approach by public
bodies to equality for groups protected under equality legislation, by seeking to prevent
unfair treatment occurring in the first instance.
1.3.2 Migrant Integration Strategy
In the context of a continued rise in immigration and acquisition of Irish citizenship by
naturalisation, policy developments have begun to focus on the integration of migrants and
persons with a migrant background in Ireland. The Office for the Promotion of Migrant
Integration within the Department of Justice and Equality is responsible for developing,
leading and coordinating migrant integration policy across government departments,
agencies and services. In 2014, the Government set about reviewing Ireland’s approach to
the integration of migrants, culminating in the publication of the Migrant Integration
Strategy 2017-2020 (Department of Justice and Equality, 2017). The Strategy seeks to
identify and address barriers to integration in order to enable migrants or persons of
migrant origin to participate on an equal basis with those of Irish heritage in Irish society. It
applies to EU nationals, non-EU nationals and persons with a migrant background, however
international protection applicants are excluded from its remit. Acknowledging that
unemployment rates are considerably higher for specific migrant groups, particularly
19
Irish Human Rights and Equality Commission Act 2014, s 42.14 | Ethnicity and nationality in the Irish labour market migrants of African origin, the Strategy includes several actions specific to labour market integration. The Strategy also recognises racism and discrimination as barriers to integration and includes commitments to combat racism and xenophobia, through strengthening hate crime legislation, intercultural awareness and training and working with communities affected by stigmatisation and developing appropriate relationships with minority communities.
Why do labour market outcomes differ across ethnic/national groups? | 15

CHAPTER 2

Why do labour market outcomes differ across ethnic/national
groups?

2.1    INTRODUCTION

The difference in labour market outcomes between immigrants and those born in the host
country has been a persistent concern in Western societies: immigrants typically have lower
employment rates, higher unemployment and lower job quality, though there is
considerable variation between groups, depending on host country context and country of
origin (Heath and Cheung, 2007). This chapter reviews some previous evidence on labour
market outcomes across immigrant and ethnic minorities in Ireland and internationally, and
some proposed explanations. Research in the area differs according to the groups defined:
some studies consider immigrants or those who are not citizens of the host country: others
focus primarily on different ethnic groups, regardless of whether groups are from an
immigrant background. Some authors propose that differences between groups are because
of personal characteristics such as educational qualifications, work experience, language
and other job-related skills and resources. Other authors stress employer behaviour, in
particular unequal treatment in the form of discrimination, as underlying group differences.
The legal framework in terms of who is allowed to come to Ireland and who is allowed to
work is also salient for understanding outcomes. These differing perspectives form the
structure of the chapter and allow us to formulate key research questions.

2.2    COUNTRY-LEVEL POLICIES AND LEGAL FRAMEWORK

One set of factors that influence immigrants’ and ethnic minorities’ labour market outcomes
are state policies and laws that govern who can come to a country, whether and under what
conditions they can work, and if and when they can acquire citizenship of that country.

One example of such regulations is that all EU nationals may move to Ireland and take up
employment without restriction. Non-EU nationals are subject to managed migration policy
that, since 2004, is designed to meet most labour market needs from within the EU and
16 | Ethnicity and nationality in the Irish labour market

relies on the employment permit system to meet skill shortages, mostly in highly-skilled
occupations (see Chapter 1). The employment permit system has been revised a number of
times, but does require non-EU nationals to have an employment permit for a specific job to
work in Ireland, restricts mobility between employers, and many permits restrict family
reunification.

Another way state regulations can affect labour market outcomes relates to those seeking
international protection. Until very recently, international protection applicants awaiting
decisions on their applications were not allowed to work in Ireland (see Chapter 1). The
direct provision system of accommodation was designed as a short-term transition system;
in practice some applicants seeking international protection status wait years to receive a
decision and, until 2018, were unable to enter the labour market (Gusciute et al., 2016).
Kingston et al. (2013) suggest that this extended period out of the labour market has led to
a negative effect on future employment prospects of those granted international
protection, particularly for the African group in Ireland (see also O’Connell, 2018).

A final state policy in the area concerns naturalisation. Adult non-Irish nationals can apply
for Irish citizenship if they are of ‘good character’ and have lived in Ireland for five of the
previous eight years.20 As noted in Chapter 1, there was a rapid increase in naturalisation
rates in the years immediately preceding 2014, both due to an increase in eligible applicants
and the introduction of reforms to reduce a backlog of applications at the time (Barrett et
al., 2017). By the end of 2015, Barrett et al. (2017) estimate that a sizeable minority (up to
45 per cent) of adult non-EU immigrants had acquired Irish citizenship. This is an upper
bound estimate, as it doesn’t account for the fact that some who have naturalised might
have left Ireland, but it does imply that many immigrants and ethnic minorities of non-EU
origin may be Irish citizens in 2014. As Irish citizens, this group are free to live and work in
Ireland without restrictions.

20
     See Barrett et al., 2017, Box 5.1 for detailed regulations.
You can also read