THE STATE OF THE COOK ISLANDS BIODIVERSITY FOR FOOD AND AGRICULTURE - COUNTRY REPORTS - Food and Agriculture Organization of the ...
←
→
Page content transcription
If your browser does not render page correctly, please read the page content below
COUNTRY REPORTS

THE STATE OF THE COOK
ISLANDS BIODIVERSITY FOR FOOD
AND AGRICULTURE
This country report has been prepared by the national authorities as a contribution to the FAO publication, The
State of the World’s Biodiversity for Food and Agriculture. The report is being made available by the Food and
Agriculture Organization of the United Nations (FAO) as requested by the Commission on Genetic Resources for Food
and Agriculture. The information in this report has not been verified by FAO, and the content of this document is
entirely the responsibility of the authors, and does not necessarily represent the views of FAO, or its Members. The
designations employed and the presentation of material do not imply the expression of any opinion whatsoever on
the part of FAO concerning legal or development status of any country, territory, city or area or of its authorities
or concerning the delimitation of its frontiers or boundaries. The mention of specific companies or products of
manufacturers, whether or not these have been patented, does not imply that these have been endorsed by FAO in
preference to others of a similar nature that are not mentioned.
State of Biodiversity for Food and Agriculture in Cook Islands

                              July 2016

                    Government of the Cook Islands

1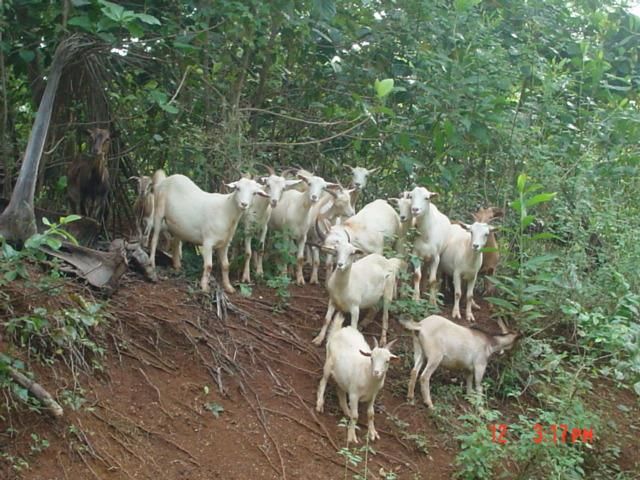
EXECUTIVE SUMMARY

The report on the state of biodiversity for food and agriculture in Cook Islands covers the
different food production systems in the country for the various sectors; forestry, animal,
aquatic, and plants. It provides a brief introduction of the country and discusses the effect
of drivers of change on various components including associated biodiversity, ecosystem
services, wild foods, and traditional knowledge; states and trends of biodiversity for food
and agriculture; the state of use; conservation and use; and, future plans for the
conservation and use of biodiversity for food and agriculture.

Some of the major drivers of change identified as affecting biodiversity for food and
agriculture include changes in land and water use and management; climate change and
natural disasters; markets trade and the private sector; and the changing economic socio-
political and cultural factors. The changing economic situation in the country shows a
worrying trend for the country especially as it affects food production and consumption
such that many people depend on processed foods for their food security and nutrition
requirements. This is also impacting food production in the country leading to continual
increased exports.

Changing climatic conditions and increased severity of natural disasters is expected to
have severe impacts on food production and biodiversity for food and agriculture in the
country. There is a lack of understanding of certain areas of associated biodiversity in the
country especially in relation to soil micro-biology. Many farmers believe that certain
current farming practices are having negative impacts on soil organisms and that its
affecting crop productivity and yields. The threat of invasive alien species will continue to
increase due to regular movement of people and cargo across borders. In the last 30-
years, more than 10 invasive species have entered our country, some very serious.
Fortunately, some of these were eradicates such as the Oriental fruit fly Bactrocera
dorsalis. We need to better prepare ourselves in dealing with invasive species and
improve monitoring and response systems.

2
We are in an unfortunate situation in that the changing diets from a more traditional to
basically of processed foods is having an impact on the state of use and conservation of
biodiversity for food and agriculture. Changing diets in the country has caused major
health problems for more than 60% of the population with rapid increases in non-
communicable diseases such as obesity, diabetes, cancer, and hypertension.

To better address the issues negatively impacting conservation and use of biodiversity for
food and agriculture, including associated components, the country needs to enhance its
collaboration with all stakeholders at national, regional, and international levels.
Government needs to involve both public and private sector players, and especially, the
school students starting at the primary level in order to successfully address the rising
changing diet issue and health epidemic.

The report was prepared with inputs from the various sectors of animal, forestry, plants,
fisheries and environment services.

3
TABLE OF CONTENTS
    1. INTRODUCTION                                                                                   6

       1.1 General Overview of the Country………………………………………………………………..........6
       1.2 Role of Biodiversity for Food and Agriculture………………………………………………………...8
       1.3 Production Systems Present in the Country………………………………………………………….9

    2. DRIVERS OF CHANGE                                                                             12

       2.1   Effects of Drivers of Change on Associated Biodiversity………………………………………….12
       2.2   Effects of Drivers of Change on Biodiversity for Food and Agriculture..…………………………17
       2.3   Effects of Drivers of Change on Associated Biodiversity………………………………………….19
       2.4   Effects of Drivers of Change on Wild Foods………………………………………………………..19
       2.5   Effects of Drivers of Change on Traditional Knowledge, Gender and Rural Livelihoods………20
       2.6   Countermeasures Addressing Current and Emerging Drivers of Change, Best Practices and
             Lessons Learned……………………………………………………………………………………….22

    3. THE STATE AND TRENDS OF BIODIVERSITY FOR FOOD AND AGRICULTURE                                 23

       3.1 Overall Synthesized Assessment of Forest, Aquatic, Animal, or Plant Genetic Resources… 23
       3.2 State and Trends of Associated Biodiversity and Ecosystem Services………………………….27
       3.3 Species of Associated Biodiversity at Risk or Loss………………………………………………...32
       3.4 Conservation of Associated Biodiversity…………………………………………………………….32
       3.5 State and Trends of Wild Resources Used for Food……………………………………………….34
       3.6 Wild Food Resources at Risk…………………………………………………………………………35
       3.7 Conservation of Wild Resources Used for Food……………………………………………………36
       3.8 Natural or Human-Made Disasters and Biodiversity for Food and Agriculture………………….38
       3.9 Invasive Alien Species and Biodiversity for Food and Agriculture………………………………..39
       3.10 Similarities, Differences, and Interactions………………………………………………………42
       3.11 Gaps and Priorities……………………………………………………………………………… 42

    4. THE STATE OF USE OF BIODIVERSITY FOR FOOD AND AGRICULTURE                                    45

       4.1 The Use of Management Practices or Actions that Favour or Involve the Use of Biodiversity for
           Food and Agriculture…………………………………………………………………………………..45
       4.2 Sustainable Use of Biodiversity for Food and Agriculture…………………………………………48
       4.3 The Contribution of Biodiversity for Food and Agriculture in Improving Productivity, Food
           Security and Nutrition, Livelihoods, Ecosystem Services, Sustainability, Resilience and
           Sustainable Intensification…………………………………………………………………………….51

4
4.4 The Adoption of Ecosystem Approaches……………………………………………………………52
4.5 Gaps and Priorities…………………………………………………………………………………….54
5. THE STATE OF INTERVENTIONS ON CONSERVATION AND USE OF BIODIVERSITY FOR
FOOD AND AGRICULTURE 56
5.1 National Policies, Programmes and Enabling Frameworks that Support or Influence
Conservation and Sustainable Use of Biodiversity for Food and Agriculture and the Provision of
Ecosystem Services…………………………………………………………………………………...56
5.2 Policies, Programmes and Enabling Frameworks Governing Exchange, Access and Benefits58
5.3 Information Management……………………………………………………………………………...59
5.4 Stakeholder Participation and Ongoing Activities that Support Maintenance of Biodiversity for
Food and Agriculture…………………………………………………………………………………..62
5.5 Collaboration Between Institutions and Organizations…………………………………………….63
5.6 Capacity Development………………………………………………………………………………
5.7 Knowledge Generation and Science for the Management and Sustainable Use of Biodiversity
for Food and Agriculture………………………………………………………………………………64
6. FUTURE AGENDAS FOR CONSERVATION AND SUSTAINABLE USE OF BIODIVERSITY FOR
FOOD AND AGRICULTURE 65
6.1 Enhancing the Contribution of Biodiversity for Food and Agriculture……………………………65
6.2 Strengthening the Conservation and Management of Associated Biodiversity and Wild
Foods……………………………………………………………………………………………….66
6.3 Improving Stakeholder Involvement and Awareness…………………………………………66
REFERENCES 67
5LIST OF ABBREVIATIONS
ABS-IT Access and Benefit Sharing Fund of the International Treaty
CCP-OPM Climate Change Office – Office of the Prime Minister
CePaCT Centre for Pacific Crops and Trees
CIBD Cook Islands Biodiversity Database
CIOA Cook Islands Organics Association
DoI-OPM Division for Outer Islands – Office of the Prime Minister
IAS Invasive Alien Species
ICI Infrastructure Cook Islands (formerly known as MoIP)
ITPGRFA International Treaty on Plant Genetic Resources for Food and Agriculture
IUCN International Union for Conservation of Nature
LRD Land Resources Division
MoA Ministry of Agriculture
MoH Ministry of Health
MoIP Ministry of Infrastructure and Planning
NES National Environment Services
NKI Natura Kuki Airani (Nature Cook Islands)
NRC National Research Committee
OPM Office of the Prime Minister
PGR Plant Genetic Resources
SPC Secretariat of the Pacific Community
TIS Taporoporo’anga Ipukarea Society
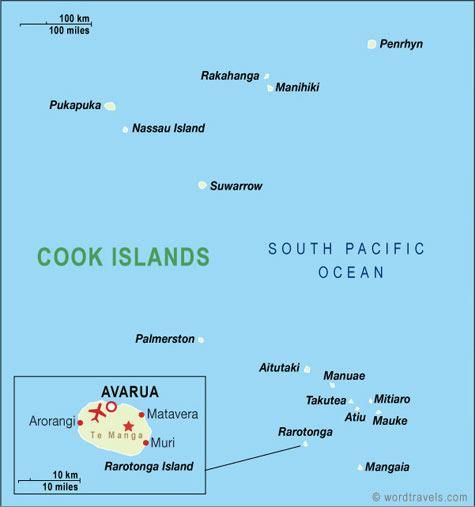
61: INTRODUCTION 1.1 General Overview of the Country The Cook Islands is a group of 15 small islands with a total landmass of 240 km2, located in the South Pacific Ocean. They are spread over an ocean area of 2 millionkm2 between 9° and 23°S latitude and 156° and 167°W longitude. The country’s islands are divided into two regions, commonly referred to as the southern and northern group islands. The southern group islands which have more fertile soils and where most agriculture is concentrated consist of four makatea (raised fossilized coral) islands (Atiu, Mangaia, Mauke and Mitiaro), two atolls (Palmerston and Manuae), one-almost atoll (Aitutaki), one sand-cay (Takutea), and one high island, Rarotonga which is also the capital island. The northern group islands consists of five atolls (Pukapuka, Rakahanga, Manihiki,Suwarrow and Penrhyn), and a sand cay (Nassau). Twelve of the islands are permanently settled, while the other three islands are wildlife reserves (Suwarrow, Takutea, and Manuae). 7
The tourism industry is the most important single economic sector especially on the two main islands of
Rarotonga and Aitutaki with a contribution of more than 55%to GDP followed by marine resource activities
at 16% through licensed foreign fishing boats and black pearl farming in some of the atolls of the northern
Cooks particularly, the island of Manihiki. Agriculture, though small in terms of its contribution to GDP at
between 3 and 6% remains an important sector in terms of food and food and nutrition security. It is also
important in terms of employment as a means of livelihood, especially on the outer islands.

A significant feature of the Cook Islands is the migratory movement of the population. Cook Islanders are
all New Zealand citizens and can move freely between the two countries. It is estimated that some 60,000
persons of ethnic Cook Islands Maori descent currently live in New Zealand, about four times as many as
are currently living in the Cook Islands. These family ties facilitate the migration of Cook Islanders to New
Zealand and many young persons are drawn there for education and employment opportunities. This has
resulted in a sharp decline in the population of the more remote islands, particularly in the Northern Group
but also Mangaia, Atiu, and Mauke in the Southern Group, where the population has roughly halved over
the last 25 years (1986-2011). Even on Aitutaki the resident population has declined over this period and it
is only Rarotonga that has had a relatively stable resident population at around 10,000(Table 1).

Comparisons between the three censuses show a steady decline in commercial and subsistence
agricultural activity and a rise in households reporting non-agricultural activity (Table 2). This is influenced
by the shift of the working population to the tourism industry and the changes in the land tenure such that
less land were being made available for agricultural activities. Farmers and workers on the land were
predominantly male (93%) and the greatest concentration were found in the 40-49 age-group (53%) and
the 60 and over age-group (34%). Only 13 percent of farmers were found to be under 40 years of
age(Table 3).During the same period, as a result of changes in the socio-economic structure of the country
coupled by a rapid change also in the diet, saw an increase in importation of both fresh and processed
foods.

Resident Population by Island 1986, 1991, 2001 and 2011
           Island             1986                1991          2001            2011
  Rarotonga                        8,972               9,967        9,424          10,572
  Aitutaki                         2,281               2,252        1,743            1,771
  Mangaia                          1,224               1,176          739              562
  Atiu                               954               1,000          600              468
  Mauke                              685                  622         469              300
  Mitiaro                            273                  244         226              189
  Palmerston                          66                   49          48               60
  Pukapuka                           761                  670         662              451
  Nassau                             119                  102          72               73
  Manihiki                           466                  655         497              238
  Rakahanga                          281                  261         158               77
  Penrhyn                            497                  501         351              213
  Suwarrow                             6                   10           1                0
  COOK ISLANDS                   16,593               17,518       14,990          14,974
Source: Cook Islands 2011 Census of Agriculture & Fisheries

8
Number and Percentage of households by level of agricultural – Census of Agriculture 2011, 2000, and 1988
Census Total Number Level of agricultural activity (%)
of Households Non Minor agricultural Subsistence only Commercial
agricultural
2011 4,372 50 21 20 9
2000 3,646 24 29 35 11
1988 3,170 15 18 49 18
Source: Cook Islands 2011 Census of Agriculture & Fisheries
Holding operators by Age-Group and Sex
15-19 20-39 40-59 60 and over
Total 8 127 530 335
Male 8 122 495 304
Female 0 5 35 31
Source: Cook Islands 2011 Census of Agriculture & Fisheries
1.2 The role of biodiversity for food and agriculture in Cook Islands
Agriculture and traditional farming systems in the Cook Islands have been closely linked to biodiversity
where farmers and families depended on many plant, livestock, forest, and marine species and varieties for
sustenance. A mixed or agroforestry type system with a combination of livestock mainly pigs, chicken,
goats; root crops including yams, sweet potatoes, cassava, xanthosoma; fruit, medicinal, timber, and
ornamental/flowering plants and crops of mainly coconut, breadfruit, banana & plantain, Cordia subcordata,
Thespesia populnea, Cananga odorata, Citrus spp.; and leafy vegetables provided for the daily food and
nutritional requirements for the population.
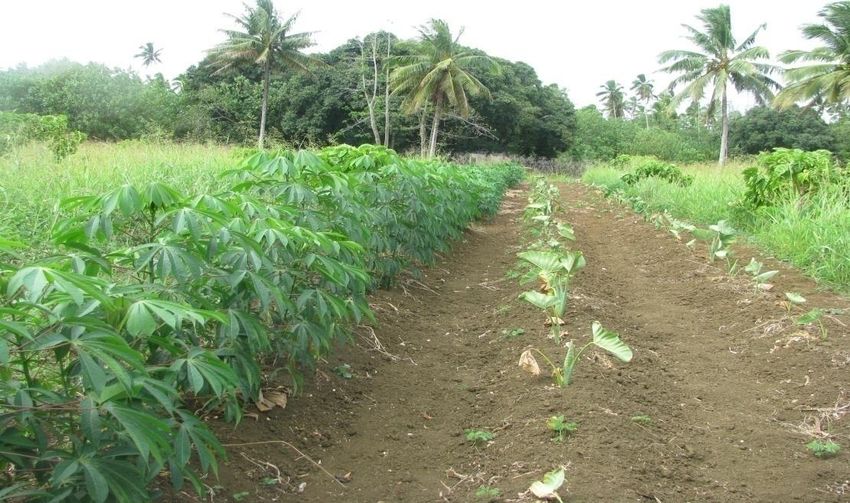
Taro, the most important root-crop, was cultivated separate from other crops in naturally occurring
swamplands that remain wet throughout the year. On the northern atoll islands of Pukapuka and Nassau,
Taro cultivation including harvesting is done by the women while the men engage in mainly fishing.
Forest foods and products for cultural and medicinal needs, depending on the island and requirement, may
be harvested from a littoral, makatea, or naturally occurring forests. Such foods and products include
Coconut Cocos nucifera, Polynesian chestnut Inocarpus fagiferus, Maire Alyxia elliptica, Breadfruit
Artocarpus altilis, Guava Psidium guajava, Surinam cherry Eugenia uniflora, Governors plum Flacourtia
jangomas, Red-Strawberry guava Psidium cattleianum, and Java plum Syzygium cumini. Other foods
harvested from forest environments include Fruit bat Pteropus tonganus, Coconut crab Birgus latro, Mud
flat crab Cardisoma carniflex, Freshwater eel Anguilla spp., Freshwater prawn Macrobrachium lar, Tilapia
Oreochromis mossambicus, and honey.
Marine food was harvested or gathered from within the lagoon and on the fringing reefs that surrounded all
islands, or beyond in ocean deep waters. Many homes harvest or gather marine food including many fish
species, clams, sea urchins, sea shells from within the fringing reef with fewer homes involved in deep-sea
fishing and ocean type fishing.
9Traditional farming practices involved very limited use of inputs such as fertilizers and chemicals and
farmers and home-owners depended heavily on the use of organic matter to improve the soil. Liming was
also practiced by traditional farmers using burnt coral from the sea to lime the soil. Depending on the nature
of the island, the food garden may be situated in close proximity to the home or may be some distance
away.
During the past 50-60 years the country has seen some major changes in its farming systems and
biodiversity. Agriculture was the mainstay of the Cook Islands economy since the 1940’s with major exports
of Citrus, Pineapple, Tomato, and to a lesser extend selected vegetables – Capsicum, Courgettes, Beans,
Chillies, and Cherry tomatoes to the New Zealand markets. With the construction of the international airport
in 1974 and changes in the marketing policies of NZ saw the country lose much of its market share in NZ.
Our exports became un-competitive against other exporters especially from Asia and Latin America.
In the 1980’s, the fishing industry and marine resources became more important as a strong economic
sector through the licensing of fishing boats and the pearl industry on the island of Manihiki. At the same
time, tourism was fast developing with the construction of the Rarotongan Hotel and other smaller
accommodations on the main island of Rarotonga.
Increasing visitor number saw also increasing opportunities for agriculture and farming activities for
selected typesand varieties of root, fruit, and leafy crops. At the same time, a high proportion of the active
workforce had shifted to the tourism and hospitality industry which led to some major changes in
agriculture. Today, most farmers on many of the southern islands operate produce commercially on a part-
time basis. Many farmers on the main island operate on borrowed land secured from relatives or absentee
landowners.
1.3 Production Systems Present in the Country
Table 1 briefly describes the production systems found in the Cook Islands. All islands experience tropical
climatic conditions except for the two most southern most islands of Rarotonga and Mangaia where cool
night temperatures >18 C are realized for a few months of the year.
Table 1. Production systems in Cook Islands
Sector Production Description Climatic zones
system Tropics Subtropics
Livestock Grassland—based Livestock including goats, horse, and cattle are raised on grassland. On the X X
makatea islands many goats are raised on the coastal margins of the makatea
forest and wetland areas
Forests Naturally regenerated Includes littoral (coastal), makatea, and forest at higher elevation (hills, valleys, X X
forests along streams)
Planted forests Pine Pinus caribaea forests on staghorn fern-lands for erosion control. Many such X X
areas on the islands of Mangaia and Atiu were for more that 30-years utilized for
extensive pineapple cultivation where serious soil erosion problems occurred during
later years.
10Planted forests of sandalwood with makatea forests on some islands. Two main
species include Santalum newcaledonicum and S. mitiaroensis. The latter specie
being native to the island of Mitiaro.
Fisheries Self-recruiting capture Subsistence and semi-subsistence fishing for home use with surplus sold for cash X X
fisheries income generation. Includes gleaning sea products on fringing reefs, net fishing,
vertical long lining, drop lining, hook and line fishing, trolling, deep bottom fishing,
spear fishing, flying fishing.
Culture based Black lipped oyster pearl farming. The meat is consumed following removal of the X
fisheries pearl from the oyster.
Non-fed aquaculture Milkfish on the northern atoll islands of Manihiki, Penrhyn, and Rakahanga. This X X
specie thrives in pools of brackish water and mainly consumed during periods of
rough seas when difficult to fish beyond the reef.
Freshwater eels and tilapia in the brackish water lakes of Mangaia and Mitiaro.
Crops Irrigated crops (other) Fruit and leafy vegetable production and dryland Taro cultivation. Limited fruit tree X X
farming is irrigated.
Rainfed crops Wetland Taro cultivation including all other rootcrops; Cassava, Sweet potatoes, X X
Xanthosoma, Yams, and all other fruit trees.
Mixed Mixed systems Combination of different crops and livestock mainly pigs, chickens, ducks, and X X
goats within the same area. Coconuts, leafy and root crops also utilized as feedstuff
for livestock.
Table 2. Description or characterization of production systems within the country.
Production system Description
Grassland—based Livestock including goats, horse, and cattle are raised on grassland. On the makatea islands many goats are
raised on the coastal margins of the makatea forest and wetland areas. Chickens are raised in proximity to the
homes as free ranging.
Naturally regenerated forests Includes littoral (coastal), makatea, and forest at higher elevation (hills, valleys, along streams)
Planted forests Pine Pinus caribaea forests on staghorn fern-lands for erosion control. Many such areas on the islands of
Mangaia and Atiu were for more that 30-years utilized for extensive pineapple cultivation where serious soil
erosion problems occurred during later years.
Planted forests of sandalwood with makatea forests on some islands. Two main species include Santalum
newcaledonicum and S. mitiaroensis. The latter specie being native to the island of Mitiaro.
Self-recruiting capture fisheries Subsistence and semi-subsistence fishing for home use with surplus sold for cash income generation. Includes
gleaning sea products on fringing reefs, net fishing, vertical long lining, drop lining, hook and line fishing, trolling,
deep bottom fishing, spear fishing, flying fishing.
Culture based fisheries Black lipped oyster pearl farming is done on the atoll island of Manihiki island. The meat is consumed following
removal of the pearl from the oyster.
Non-fed aquaculture Milkfish on the northern atoll islands of Manihiki, Penrhyn, and Rakahanga. This specie thrives in pools of
brackish water and mainly consumed during periods of rough seas when difficult to fish beyond the reef.
Freshwater eels and tilapia in the brackish water lakes of Mangaia and Mitiaro.
Irrigated crops (other) Fruit and leafy vegetable production and dryland Taro cultivation. Limited fruit tree farming is irrigated.
Rainfed crops Wetland Taro cultivation including all other rootcrops; Cassava, Sweet potatoes, Xanthosoma, Yams, and all
other fruit trees.
Mixed systems Combination of different crops and livestock mainly pigs, chickens, ducks, and goats within the same area.
Coconuts, leafy and root crops also utilized as feedstuff for livestock.
11Question 7. For each production production system found in your country (refer to in Table 1),
indicate in Table 3 the area under production (hectares). If not applicable, indicate the estimated
production quantity.
Table 3. Area under production, production quantity and contribution to the agricultural sector
economy for production systems in the country
Name of the production system Area (Ha) Estimated Contribution to the Reference year
production agricultural sector
quantity economy (%)
(indicate unit)
Grassland—based NA NA NA NA
Naturally regenerated forests c. 15,800 NA NA NA
Planted forests c. 1,100 NA NA NA
Self-recruiting capture fisheries NA NA NA NA
Culture based fisheries NA NA NA NA
Non-fed aquaculture NA NA NA NA
Irrigated crops (other) Bean = 0.6 NA NA NA
Cabbage = 0.8
Capsicum = 13.0
Lettuce = 0.8
Melon = 12.9
Tomato = 4.1
Other = 13.8
Rainfed crops Nono = 23.8 NA NA NA
Orange = 19.7
Papaya = 18.4
Cassava = 26.8
Kumara = 6.3
Puraka = 0.8
Taro, dry = 3.4
Taro,flooded = 4.6
Taro, raised = 55.5
Tarua = 10.3
Other = 0.7
Mixed systems Avocado = 8.4 NA NA NA
Chilli = 0.2
Banana = 99.3
Breadfruit = 10.4
Chestnut = 8.2
Coconut = 42.9
Coffee = 0.1
Lemon = 5.6
Mango = 42.5
Other = 121.4
Notes
Area (Ha) under crop production for the period between June – Dec 2010 (Agriculture Census Report 2011)
NA = Not available
12Question 8. Comment on the effects of biodiversity for food and agriculture of production destined for exportation versus production for local and/or national consumption. Where information is available, indicate for each production system the proportion of production that is destined for export, the major commodities involved, the impacts on the methods of production (e.g. adoption of specific production practices to meet export needs) and the implications for biodiversity. For the past 5-10 years, Nono Morinda citrifolia juice and Maire Alyxia elliptica leis were the only commercial agricultural export commodities of the Cook Islands. Since 2001, organic Nono juice has been the number one agricultural export product from the Cook Islands to global markets reaching a high of 70 tonnes at the end of 2015 (Cook Islands News June ‘2016). Many years prior to this period, the Cook Islands was a major exporter of both fresh and processed citrus (orange) and pineapples to the markets of NZ. In later years, the country continued to supply overseas markets with fresh bananas, papaya, tomatoes (cocktail), hot and sweet pepper, french beans, zucchinis, and snowpeas. Export of these commodities faced much difficulty through the years due to changes in prefential treatment offered to Cook Islands exports to the NZ markets and stiff competition from other Pacific and Asian nations. The opening of the airport in 1974 saw an opportunity for local farmers through the increased demand for local fresh and processed produce from increasing visitor numbers. Currently, farmers are unable to meet demands and import figures continue to increase. At the same time, the country also witnessed a significant increase in the number of visitor arrivals from 30,000 in 1986 to more than 125,000 in 2015 resulting in considerable new employment opportunities in the tourism industry, and diminishing interest in both subsistence and commercial agriculture. This period has also seen a steady increase in imported foodstuffs and the dietary shift away from local produce to imported foodstuffs (Agriculture Census 2011). 2: DRIVERS OF CHANGE 2.1 Effects of drivers of change on associated biodiversity Question 9. What has been the most important drivers affecting the extend and distribution of associated biodiversity in the last 10 years in your country?. In describing the drivers you may wish to indicate the production systems where associated biodiversity is most affected and identify drivers that are common to the various components of associated biodiversity listed. Indicate where possible the indicators used to measure changes, along with the sources of information During the past 10-20 years, the country has experienced rapid changes in its local environmental and socio-economic structure. This has come-about mainly as a result of increasing outside influence through increasing visitor numbers to our shores, better income and access to improved technology and materials. 13
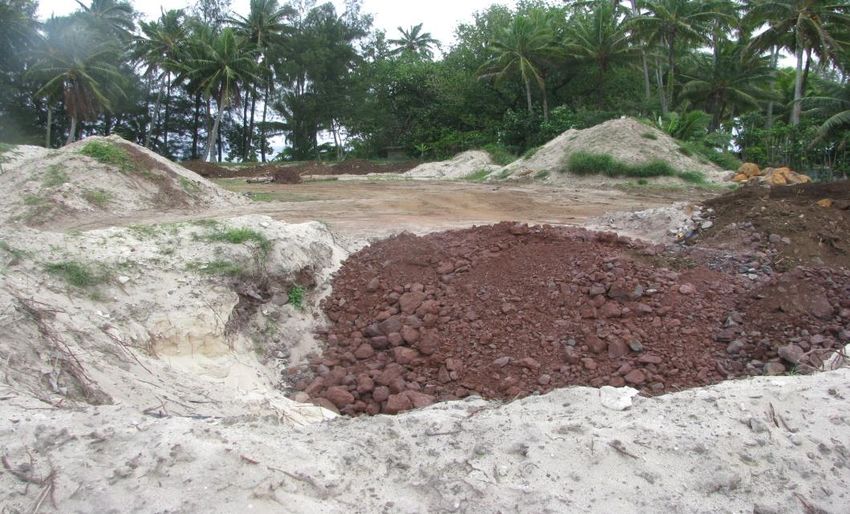
These changes, although useful in many ways, also contributed negatively to our agriculture and
biodiversity.

 Changes in land and water use and management: The capital island of Rarotonga has seen rapid
changes in its land-use over the past 25-years. The increasing visitor numbers and changing lifestyle has
seen a majority of useful agricultural lands being converted to construction of residential housing and visitor
accommodation. The Agriculture Census of 2011 showed that only 540 acres of land was utilized for
agricultural purpose compared to 2,500 acres in 1988. Although not all these lands would have been
utilized for residential purpose, much of it would have been, whilst some will be vacant lands and some for
other uses. There is also an increasing proportion of forest and sloping lands being converted for mainly
residential uses as relatively flat and undulating lands become more scarce. A large proportion of sloping-
lands being leveled are poorly designed which can exacerbate run-off and soil erosion.

Natural wetlands, the majority being commonly utilized for Taro cultivation, are also being reclaimed for
residential and tourism accommodation along coastal margins (Fig 1). Natural wetlands act as a filtration
system for soil particles and nutrients from higher elevations or forested and agricultural areas during
events of flooding and heavy downpours. The loss of these areas will increase the flow and deposition of
sediments and nutrients in the marine ecosystem.

Fig 1. Reclaimed wetland to allow for private home construction

The increasing demands for concrete by the building industry on the main island, has led to increased land
parcels where sand is mined to use an ingredient of concrete for construction purposes (Fig 2). These
areas of sand-mining are basically along coastal margins and close to the shorelines and the sea. Where
sand is mined or extracted, the open mines are back-filled with soils from the hillsides or the higher
elevations. Much of these soils have high levels of nutrients and over the years may seep into the marine
environment through underground water. Developments on the costal margins may lead to an increased
removal of trees which would otherwise assist with the uptake of nutrients before it reaches the marine
environment.

14
Fig 2: Mining of sand from coastal margins and back-filling with soil from hillsides

Pollution and external inputs: There is increasing threat to the marine environment from terrestrial run-off
of silt and clay due to leveling of sloping lands for construction of private homes. Poorly designed and out-
dated septic tanks on highly porous sandy type soils along the coastal margins are also suspected of being
a major contributor to marine pollution especially around the eastern-side of the main island. Many private
homes and tourist accommodation are situated along the inter—tidal zones in this part of the island.
Regular sea-water tests conducted by the Ministry of Marine Resources over the past 5-years, has
revealed relatively high levels of bacteria and nutrient in some of these areas. A project with external
financial and technical support is being implemented in this area aimed at improving septic tank designs to
reduce seepage of nutrients and bacteria into ground-water.

Overexploitation and overharvesting: The regular harvesting of lagoon and reef fish species from some
of the northern atolls islands may see some reduction in the population of certain fish species to verly low
levels. Many families on these islands often sent fresh fish to families on the main island on visiting cargo
and passenger vessels. It has been reported that the parrot fish population on the island of Palmerston, a
species well sought after by many restaurants on the main island, may be declining rapidly (Makikiriti, N.
pers.com). The Cook Islands has one of the largest sea areas in the Pacific accounting for 1.8 million Km2.
Much of the deep-sea fishing operations in our waters are by licensed vessels.

15
Pests and alien invasive species: During the past 10-years, three serious insect pests, namely the
red-banded caterpillar Dennolis sublinbalis; red-banded thrips Selenothrips rubrocinctus; and glassy
winged sharpshooter Homalodisca vitripennis; and, one social pest, the Cuban laurel thrips Gynaikothrips
ficorum, respectively were discovered in the country. The glassy winged sharpshooter is also known to be a
transmitter of the bacterium Xylella fastidiosa, which can cause a serious disease in grapevines. Three
serious weedy species namely Wedelia Wedelia triloba, Dodder Cuscuta campestris, and Morning glory
Meremmia peltata were also found in the Cook Islands. Currently, all these pests are only recorded from
the southern islands.

The increasing movement of people coupled with increased trade in plants and frivesh plant products have
exacerbated the risk of new and serious pests reaching our country. There is also increasing smuggling of
ornamental and flowering plants by in-coming passengers.

In May 2013, the Oriental Bactrocera dorsalis fruit fly was detected in surveillance traps on the islands of
Rarotonga and Aitutaki. Prior to the past 10-years, other serious pests including the Queensland
Bactrocera tryoni fruit fly, Papaya Ringspot Virus (PRSV), and the Orchid Weevil were found in the country.
Eradication programmes were enacted for all species and these pests were successfully eradicated except
for the Orchid weevil. The two fruit fly species are some of the most destructive in the world, in particular,
the Oriental fruit fly. The PRSV is also one of the most destructive pest of papaya in major papaya
producing areas worldwide.

The threat of pest introduction will continue to increase with increased global trade in plant materials and
products, and the movement of people. Legislation and border control systems need to be effective and
efficient in preventing the introduction and movement of pests across borders.

Question 10. Where associated biodiversity is believed to be affected by climate change, please
provide additional information on the nature, severity and frequency of the climate threat and the
production systems affected.

The country has seen during the past 10-years dramatic climatic changes most notably in precipitation and
temperature regimes. Such changes have effected the fruiting patterns in some fruit species including
Citrus spp., Mango, and Breadfruit. For the past 10-15 years the fruiting of these crops did not follow the
normal pattern. During most years, all these species will have more than one main harvest however, the
overall yield from all harvest is normally much smaller except for Breadfruit where the yield from any
harvest is comparable to previous years.

Prolonged periods of very low to no rainfall have also become very common throughout the islands of the
Cooks. During the past 3-5 years, all of the southern islands experienced some of the worst drought in
many years. This affected crop production and especially some of the most important staples such as Taro
and Xanthosoma. On the island of Aitutaki and Mauke, Xanthosoma plants succumbed to the extended
period of drought (Fig 3). On the island of Mangaia all Taro was traditional grown under paddy conditions.

16
As a result of the very low rainfall year-round 90% of paddy fields have now dried-up and all planting is
done on raised-bed systems with water-channels created around each raised-bed (ca.10m x 25m).

Fig 3: Growth of Xanthosoma plants affected by prolonged drought

Extended droughts have also led to the proliferation of certain serious weed species including Nutgrass
Cyperus rotundus, Bermuda grass Cynodon dactylon, Beggars tick Bidens pilosa, and others. These
species can compete successful under very dry conditions and often very difficult to manage and control.

17
2.2 Effects of drivers of change on biodiversity for food and agriculture

     Question 11. For each production system present in your country as indicated in Table 1, fill in the
     name of each production system in Table 4 (repeat table for each production system). For each
     production system indicate which drivers have been influencing biodiversity for food and
     agriculture, disaggregated by sector, during the past 10 years. Drivers may have a strongly positive
     (2), positive (1), negative (-1), and strongly negative effect (-2), or no effect at all (0) on biodiversity
     for food and agriculture. If the effect of the driver is unknown or not applicable, please indicate not
     known (NK) or not applicable (NA).

     Table 4. Effect of drivers on sector biodiversity within production systems in the country, by animal (AnGR),
     plant (PGR), aquatic (AqGR) and forest (FGR) genetic resources.

Production systems                             Drivers                         Effect of drivers on sector biodiversity
                                                                                       for food and agriculture
                                                                                          (2,1,0,-1,-2,NK,NA)
                                                                                 PGR        FGR        AnGR     AqGR
Grassland—based;           Changes in land and water use and                   1          2           1        1
Naturally regenerated      management
forests;                   Pollution and external inputs                       1          0          0          2
Planted forests;           Over-exploitation and overharvesting                0          0          0          2
Self-recruiting capture    Climate change                                      2          1          0          0
fisheries;                 Natural disasters                                   2          2          0          0
Culture based              Pests, diseases, alien invasive species             2          2          1          0
fisheries;                 Markets, trade and the private sector               2          1          2          1
Non-fed aquaculture;       Policies                                            0          0          0          0
Irrigated crops (other);   Population growth and urbanization                  2          1          1          1
Rainfed crops;             Changing economic, socio-political, and cultural    1          0          1          1
Mixed systems              factors
                           Advancements and innovations in science and         1          0          1          2
                           technology

     18
2.3 Effects of drivers of change on ecosystem sercives
Question 12. What have been the main drivers affecting regulating and supporting ecosystem
services in the country during the last 10 years?. Describe for each production system, the major
driver(s) affecting ecosystem services and indicate the effect on ecosystem services as being
strongly positive (2), positive (1), negative (-), strongly negative (-2), no effect (0), not known (NK) or
not applicable (NA))
Table 5: Major drivers and their effect on ecosystem services in production systems
Production systems Drivers Effect of drivers on ecosystem services
(2, 1, 0, -1, -2, NK, NA)
Water purification and
Production of oxygen
Habitat provisioning
Soil formation and
Pest and disease
Nutrient cycling
water treatment
/Gas regulation
Natural hazard
Water cycling
Pollination
protection
regulation
regulation
Grassland based Changes in land and water use NK NK NK NK NK NK NK NK NK
and management
Grassland based Pests, diseases, alien invasive NK NK NK NK NK NK NK NK NK
species
Naturally regenerated forests Climate change NK NK NK NK NK NK NK NK NK
Naturally regenerated forests Pests, diseases, alien invasive NK NK NK NK NK NK NK NK NK
species
Planted forests Acacia mangium – N fixer to NK NK NK NK NK NK NK NK NK
improve poor soils in outer islands
Self-recruiting capture fisheries Overexploitation and NK NK NK NK NK NK NK NK NK
overharvesting of clams and
parrot fish species
Culture based fisheries Disease organisms affecting pearl NK NK NK NK NK NK NK NK NK
farming
Non-fed aquaculture Overexploitation and NK NK NK NK NK NK NK NK NK
overharvesting of milkfish
Irrigated crops (other) Changes in land and water use NK NK NK NK NK NK NK NK NK
management – more water for
visitors and domestic use
Irrigated crops (other) Climate change – extended dry NK NK NK NK NK NK NK NK NK
periods
Rainfed crops Changes in land and water use NK NK NK NK NK NK NK NK NK
management – more water for
visitors and domestic use and less
for agriculture
19Rainfed crops Climate change – extended dry NK NK NK NK NK NK NK NK NK
periods
Mixed systems Changes in land and water use NK NK NK NK NK NK NK NK NK
management – more water for
visitors and domestic use and less
for farming
Mixed systems Climate change – extended dry NK NK NK NK NK NK NK NK NK
periods
Question 13. Briefly describe the main driver(s) affecting ecosystem services in each production
system, as identified in Table 5. Include where possible a description of the components of
biodiversity that are affected, the indicators used to measure change, and the source of
information.
Refer to Question 9.
2.4 Effects of drivers on wild foods
Question 14. What were the main drivers affecting the availability, knowledge and diversity of wild
foods during the last ten years in the country?. In Table 6, indicate the main drivers affecting
availability, knowledge and diversity of wild foods, and if the effects are strongly positive (2),
positive (1), negative (-1), strongly negative (-2), no effect (0), not known (NK), or not applicable
(NA).
The main drivers include pollution and external inputs; over-exploitation and overharvesting; climate
change; natural disasters; pests, diseases, alien invasive species; markets, trade and the private sector;
and changing economic, socio-political and cultural factors.
Rongo, T & C. Dyer (2015) reported changes to availability and prevalence of certain wild foods as being
most likely a factor of changing climatic conditions such as the extended periods of very low precipitation
experienced by many islands.
During the past 30-years, the country has seen a steady increase in imported foodstuffs, up from NZ$10.3
million in 1986 to NZ$33 million in 2011, and the dietary shift away from local produce to imported
foodstuffs as reported in the Agriculture Census 2011 document as a result of changes in economic and
cultural factors. Food imports continue to increase and in 2015, reached a high of NZ$38.5 million
(Statistics MFEM Statistics Office Quarterly Report Dec 2015).
A greater proportion of the population in the more remote islands, particularly the atoll islands depend
greatly on wild foods particularly from their vast marine environment for food security and nutrition.
The structural change of the economy has created a system whereby a majority of the population depends
on foodstuffs from the shops and less on traditional foods. Introduction of technology has also changed
many practices of even remote communities. The dietary shift has affected health of the people thereby
making many immobile and unable to do the physical work expected on the farm.
20The traditional farming knowledge is in danger of being lost, not so much through foreign intervention or
misappropriation, but because the younger generation is not interested in either farming or even in
consuming traditional food crops. Whilst this is a global phenomenon, the Cooks suffer additionally from a
shrinking local population due to emigration to the economic centres of gravity, New Zealand and Australia.
Suggestions to address this issue include the compulsory inclusion of agricultural training in the primary
school curricula and mapping of traditional knowledge related to agriculture, together with the development
of appropriate legislation (Janicke, H. 2011).
Table 6. Drivers affecting availability, knowledge and diversity of wild foods
Drivers Effect of drivers
(2, 1, 0, -1, -2, NK, NA)
Availability of wild Knowledge of Diversity of
foods wild foods wild foods
Changes in land and water use and NK NK NK
management
Pollution and external inputs NK NK NK
Over-exploitation and overharvesting NK NK NK
Climate change NK NK NK
Natural disasters NK NK NK
Pests, diseases, alien invasive species NK NK NK
Markets, trade and the private sector NK NK NK
Policies NK NK NK
Population growth and urbanization NK NK NK
Changing economic, socio-political, and cultural NK NK NK
factors
Advancements and innovations in science and NK NK NK
technology
Question 15. Briefly describe the main drivers affecting the availability, diversity and knowledge of
wild foods in your country, as identified in Table 6. Include where possible indicators used to
measure change, along with the source of information.
Refer to Question 14.
2.5 Effects of drivers of change on traditional knowledge, gender and rural livelihoods
Question 16. Which drivers have had the most significant effect in the involvement of women in the
maintenance and use of biodiversity for food and agriculture?.
Markets, trade and the private sector; and changing economic, socio-political, and cultural factors have had
the most significant effect on women participation in the maintenance and use of biodiversity on many
islands. Traditionally, women were mainly tasked with home chores with limited involvement in planting and
21fishing activities, except for the preparation and cooking of food crops, and in some instances, the maintenance and use of particular food crops and plants around the homes, and the collection of seashells in the lagoon and reef environments. On the islands of Pukapuka and Nassau, however, women are pre-dominantly the caretakers and users of mainly land-based biodiversity for food and agriculture. On these two islands where Taro Colocasia esculenta is the staple food crop, women are involved in all aspects of its cultivation thru to post-harvest preparation and cooking. On these two islands, women also tend to maintain many more cultivars of the crop as different cultivars are preferred for certain cooking techniques. The changing economic and social structure and increasing employment opportunities in more recent times have had greater impacts on women involvement in biodiversity maintenance and use. Many women of today have full-time paid employment and mainly purchase imported food products instead of growing for own use. This rapid shift in diet has lead to a rise in non-communicable diseases even among the women population. Question 17. Which drivers have had the most significant effect on the maintenance and use of traditional knowledge relating to biodiversity for food and agriculture?. Markets, trade and the private sector; policies particularly changes in the education curriculum with increased emphasis on science and technology subjects; and changing economic, socio-political and cultural factors have had the most significant impacts on the maintenance and use of traditional knowledge relating to biodiversity for food and agriculture. Traditionally farming of food crops and fishing in the country was done according to the lunar calendar. The Ministry of Agriculture developed a planting calendar based on the moon phases, although it is recognized that each island may have their own interpretation of key planting dates. This traditional knowledge is in danger of being lost, not so much through foreign intervention or misappropriation, but because the younger generation is not interested in either farming or even in consuming traditional food crops. This is a especially a major problem in the southern islands but, it is also extending rapidly to the northern atoll islands, where through increased sea and air services, more processed products are reaching these islands. Suggestions to address this issue include the compulsory inclusion of agricultural training in the primary school curricula and mapping of traditional knowledge related to agriculture, together with the development of appropriate legislation (Janicke, H. 2011). Question 18. Which drivers have had the most significant effect on the role of biodiversity for food and agriculture in improving food security and sustainability?. Changes in land and water use and management, climate change, markets and trade and, changing economic and social structure are seen as the main drivers affecting biodiversity for food and agriculture in the Cook Islands in more recent time, the past 10-15 years. Changes in land and water use and management; markets and trade and, changes in economic and social structure are most notable on the main islands of Rarotonga and Aitutaki where population growth and tourism is on the increase. On the other southern islands, including Aitutaki, changing climate has had the most impact affecting biodiversity from very low precipitation. In 2013, these islands suffered some of the 22
worst drought in many years. The island of Atiu had no rain for 6-months and agricultural production,
particulary short term crops, and root staples such as Colocasia esculenta and Xanthosoma sagittifolium
were severely affected. Cassava was one of the only crops that survived well during these extended dry
periods.

These drivers will remain as having the major impact on biodiversity into the future along with natural
disasters through extreme weather events such as cyclones reaching category five status that will have
drastic effect on biodiversity and food & nutrition security. The dietary shift from local produce to imported
processed foods will also have a significant effect on food security and sustainability.

2.6 Countermeasures addressing current and emerging drivers of change, best practices,
and lessons learned

Question 19. Referring to the information provided in this Chapter, identify countermeasures
planned or in place to reduce adverse consequences of drivers on a). associated biodiversity, b).
ecosystem services and c). wild foods. Provide any expected outcomes, lessons learned and best
practices.

To reduce the adverse effects of drivers on these sectors, the country has to adopt a holistic approach with
the involvement of both public and private sectors. At the same time, there needs to be a strong directive
from the highest authority in t he country to help address these issues. As these drivers will have long-
lasting impacts on biodiversity and food security, it will also have similar effects on associated biodiversity
and ecosystem services. The country needs the involvement of all stakeholders right to the primary school
level. Leaders, politicians, NGOs, church groups also need to play an active role if our countermeasures
are to be effective.

Often, our approaches to addressing related issues have in the past failed as we either failed to engage
some important players, we failed to understand the real problem, and in many cases we have people with
no understanding of the issues taking a leading role. There is also the need to effectively police and
enforced good legislation and policies.

23
3: THE STATE AND TRENDS OF BIODIVERSITY FOR FOOD AND
AGRICULTURE

3.1 Overall synthesized assessment of forest, aquatic, animal or plant genetic resources

Question 20. Describe the overall 1). state, 2) trends and 3) state of conservation of diversity of
forest, aquatic, animal or plant genetic resources in your country with respect to:

a). common characteristics shared by all sectors;

b). major differences between sectors;

c). synergies or trade-offs in the state of diversity between sectors.

The plant and animal sectors especially have continued to enhance the genetic diversity through the
introduction of new plant species and animal breeds. During the past 30-years, MoA introduced many
varieties of important food crops from CePaCT including: Musa spp.; Colocasia esculenta; Ipomoea
batatas; Manihot esculenta; Artocarpus altilis; Dioscorea spp.; Cyrtosperma merkusii; and Alocasia
macrohizza. Other commercial and perennial species introduced are Ananas comosus; Lappaceum
nephelium; Artocarpus heterophyllus; Garcinia mangostana; Dimocarpus longana; Durio zibenthinus;
Pouteria caimito; Citrus reticulata; Citrus sinensis; Tamarindus indicus; Hylocereus undatus.

Forest genetic resources: Forest in the Cook Islands is classified as either Littoral (4,900 Ha), Makatea
(5,000 Ha), Natural (4,900 Ha), and Plantation (1,100 Ha).There is no commercial harvesting of forest
species in the country and are mainly under conservation and not for economic development. Certain wild
foods,medicinal and culturally significant plants are harvested and collected from the forest zones (see
table 6). Some important species which are commonly found in the coastal forest such as Tamanu
Callophyllum inophyllum, Tou Cordia subcordata, and Miro Thespesia populnea are widely used for local
and cottage type industry such as handi-crafts and for medicinal purposes.

The littoral forest includes combination of tree species Barringtonia asiatica, Calophyllum inophyllum,
Cordia subcordata, Guettarda speciosa, Hernandia nymphaeifolia,Hibiscus tiliaceus, Pandanus tectorius,
Pisonia grandis, Sophora tomentosa, Timonius polygramus, and Tournefortia argentea, and the shrubs
Morinda citrifolia, Pemphis acidula, Pipturus argentues, Scaevola taccada, Schleinitzia insularum, Melia
azedarach, and Suriana maritima.

The vegetation of makatea is generally well preserved because the rough surface of fossilized coral is
unsuitable for cultivation and human habitation. Examples can be seen on the islands of Mangaia, Atiu,

24
Mauke and Mitiaro. The vegetation becomes more species-rich with distance inland. The coastal makatea
forest changes with distance inland from a combination of Cocos nucifera, Hernandia nymphaeifolia,
Hibiscus tiliaceus, and Pandanus tectorius, with occasionally Barringtonia asiatica, and Casuarina
equisetifolia, to a tree assemblage in which Elaeocarpus tonganus, Guettarda speciosa, Pisonia grandis,
Schleinitzia insularum, and Sophora tomentosa, become dominant. Fronting the forest is a shrub layer
dominated by Scaevola taccada, with Euphorbia atoto, Timonius polygramus, and Wollastonia biflora.
Pemphis acidula forms a narrow belt closest to the coast. The inland makatea includes all of the woody
species from the coastal makatea except Pemphis acidula, and includes in addition trees of Aleurite
moluccana, Calophyllum inophyllum, and Hernandia moerenhoutian. That from higher canopy. Other
woody species includes Cyclophyllum barbatum, Ficus prolixa, Ficus tinctoria, Glochidion sp., Morinda
citrifolia, and Pipturus argenteus.

Forested areas on most islands remain unaffected by human intervention except on the main island where
population pressure and residential construction along the intertidal zones, coastal margins, and at higher
elevations have resulted in the removal of areas of littoral and natural forests. The removal of littoral or
coastal forests may have resulted in the normally high levels of nutrients in sea-water as deep rooted trees
may uptake some of the nutrients in ground-water. The use of heavy machinery to level elevated and
sloping lands have also resulted in soil erosion during periods of high rainfall. There may be a need for
government to make amendments to the land tenure system of the country aimed at protecting the
watershed areas from any type of development be it residential or otherwise. Protection of the watershed
areas is vital to ensuring quality water supply for domestic use.

Animal genetic resources: Animal production in Cook Islands of mainly pigs and goats is basically of a
subsistence nature, for family and household requirements, and in on many occasions, as gifts for cultural
and social functions including funerals, weddings, feasts. There are very few commercial operations of pig
meat and egg production for local sales. All processed feeds in commercial operations are imported while
subsistence farmers use mainly local feed stuff. Most farmers keep more than one species of animal.
Locally adapted breeds are important because of their hardiness to rough management, adaptation to the
climate and also to the unbalanced feed such as coconut being the main diet. Many pig farmers either
tether their animal to a tree and move them at regular intervals, or maintain them in small wooden crates.
On the makatea islands many pigs are raised within enclosures of fossilized coral stonewalls. Commercial
operations commonly use concreted floor pens. Subsistence chicken for meat and eggs are raised free—
range where the birds roam freely and feed on local foodstuff. Birds for commercial egg production are held
in battery cages under corrugated roofing iron cover.

Goat remains a delicacy in the local diet and one of the most expensive meat. Like pigs, many farmers
tether their animals and move them at regular intervals or allowed to roam freely, a common practice on the
makatea islands where the animals roam around and within the makatea forest and feed on shrubs and
trees (Fig5). This can be a problem especially when the population increases and their feeding can affect
culturally important species such as the Maire Alyxia elliptica. Cattle farming, at a subsistence level occurs

25
You can also read