EXPLORING THE COOPERATIVE ECONOMY - www.monitor.coop - International Co-operative Alliance
←
→
Page content transcription
If your browser does not render page correctly, please read the page content below
REPORT 2018

EXPLORING
THE COOPERATIVE
ECONOMY

www.monitor.coop
                   Titolo capitolo   1
THE WORLD COOPERATIVE MONITOR IS AN INTERNATIONAL COOPERATIVE ALLIANCE INITIATIVE WITH THE SCIENTIFIC SUPPORT OF EURICSE

                           MADE POSSIBLE BY THE SUPPORT OF OUR ORGANISATIONAL PARTNERS

                                               FOR INFORMATION CONTACT
                                                    www.monitor.coop
                                                  monitor@monitor.coop
THE 2018
WORLD Bruno Roelants
COOPERATIVE
MONITOR Gianluca Salvatori
EXPLORING THE COOPERATIVE ECONOMY
The International Cooperative Alliance (ICA) and the Euro- the report and encourage questionnaire submissions in Brazil,
pean Research Institute on Cooperative and Social Enterpris- resulting in 63 questionnaires from Brazilian cooperatives. We
es (Euricse) present the seventh annual World Cooperative hope to see the total number of questionnaires rise from all
Monitor report. This publication reports on the world’s larg- around the globe, which would greatly enhance the analysis we
est cooperative and mutual organisations, providing rankings can provide about the cooperative movement. We encourage all
of the Top 300 and sectorial analysis based on 2016 financial federations to continue to remind their members to participate
data. actively in the World Cooperative Monitor call for data.
This year’s results show the largest organisations in the We are also excited to present a new feature of the report: a
cooperative movement performing well, with only slight vari- special analysis of the Top 300 and the United Nations’ Sustain-
ations to the top positions across the sectors. In the Top 300 able Development Goals (SDGs). This new addition to the WCM
ranking based on turnover the French Groupe Crédit Agricole report takes a look at how the largest cooperative enterpris-
and Groupe BPCE place first and second respectively, with BVR es and mutuals in the world are moving towards achieving the
of Germany ranking third. And in the Top 300 based on the ra- SDGs, examining documents reported to the UN Global Com-
tio of turnover over gross domestic product (GDP) per capita pact project and Global Reporting Initiative (GRI). We are proud
ranking, reintroduced this year, IFFCO from India holds the top to find many examples of cooperative and mutual enterprises
position. The ratio of turnover over GDP is not intended to com- developing projects and initiatives to ensure fair labour, protect
pute the contribution of each enterprise to the national GDP, the environment, and much more to meet the SDGs. Featured
but rather to relate the turnover of the enterprise to the wealth within the section are also stories about the actions taken by
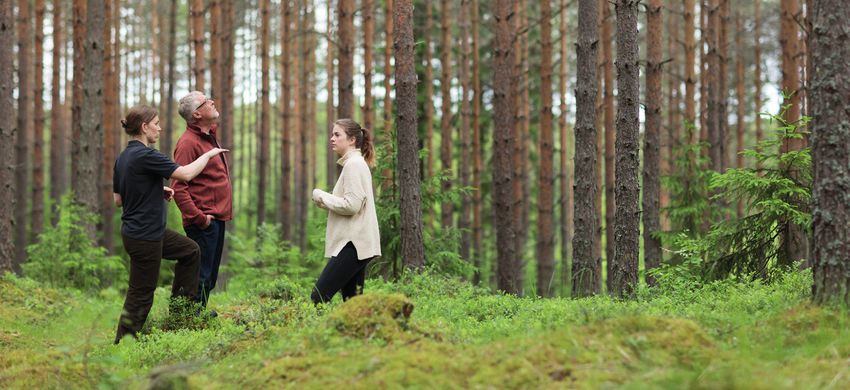
of the country in which it operates, as GDP per capita meas- Grupo Sancor Seguros (Argentina), Metsä Group (Finland) and
ures the purchasing power of an economy in an internationally Sicredi (Brazil), three of the Top 300. We also hear from one of
comparable way. the world’s leaders in SDG development, adoption, and promo-
We would like to give special thanks this year to our tion, Enrico Giovannini.
ever-committed sponsors, OCB System and Fundación Es- Many thanks to all of the contributing enterprises and col-
priu. OCB System made a particular effort this year to promote laborators who produced this year’s edition of the report!
3
INDEX WCM 2018

6 2016 HIGHLIGHTS
   WCM database and key results

12 SECTOR SNAPSHOTS AND TRENDS
   Agriculture and Food Industries
   Industry and Utilities
   Wholesale and Retail Trade
   Insurance Cooperatives and Mutuals
   Banking and Financial Services
   Health, Education and Social Care
   Other services

42 TOP 300 AND SDGS
   Beyond Economic Impact: The Contribution of the Top 300
   to Sustainable Development
   Interview with Enrico Giovannini
   Stories from Grupo Sancor Seguros, Metsä Group, Sicredi

62 METHODOLOGY
   Methodology and Data Sources

71 TOP 300: RANKINGS AND SDG PARTICIPATION
   Top 300 Rankings by Turnover in USD
   Top 300 Rankings by Turnover in International Dollars
   Top 300: SDG Participation

92 TEAM, STEERING COMMITTEE, ORGANISATIONAL PARTNERS
   The World Cooperative Monitor team and steering committee
   Promoters and Organisational partners
EXPLORING THE COOPERATIVE ECONOMY

2016                                                                      1855                                     418           293 9
HIGHLIGHTS                                                                  EUROPE                              AMERICAS          ASIA -
                                                                                                                                 PACIFIC
                                                                                                                                           AFRICA

The World Cooperative Monitor
is a project designed to collect
robust economic, organisational,
and social data about cooperatives,
mutual organisations and non-                                 THE ORGANISATIONS IN THIS YEAR’S DATASET ARE DISTRIBUTED IN

                                                                                           2,575
cooperative enterprises controlled
                                                      THE WORLD COOPERATIVE
by cooperatives worldwide. It is the                  MONITOR COLLECTED DATA FOR                               ORGANISATIONS
only report of its kind collecting
                                                      1,157 ORGANISATIONS HAVE A TURNOVER OVER 100 MLN US$
annual quantitative data on the
global cooperative movement.                                                    SECTORS OF ACTIVITY

22             97             156          174            376             410              494                      846

1%            4%             6%           7%             15%             16%               19%                      33%
Other       Health,        Insurance     Industry      Wholesale           Other         Banking                   Agriculture
         education and    cooperatives      and            and            services     and financial                and food
          social care     and mutuals     utilities    retail trade                      services                  industries

The data collected for the 2018 edition of the World Cooperative                               DATA FOR 2016 COMES FROM:
Monitor is from the year 2016. The primary sources of data include                             Existing rankings
existing databases of economic data, data collected by national                                                    Orbis
                                                                                                                         WCM
associations, research institutes, and other organisations, and the use                                               Questionnaire
                                                                                                                             Euricse
of a questionnaire to collect data directly from enterprises. Euricse                                                              Aida
makes every effort to then complete the dataset through online                                                                         Eikon

research and consultation of financial statements and annual reports.                          76%                  11%     5% 4% 4% 0%

 6   2016 Highlights
REPORT 2018

 ORGANISATIONS GROUPED BY TURNOVER BRACKET (USD)

 30-100 BLN        16

  10-30 BLN             36

   5-10 BLN              41

    1-5 BLN                                               207

  0,5-1 MLN                                        154

200-500 MLN                                                                     338

100-200 MLN                                                                     341

50-100 MLN                                         159

 10-50 MLN                                                                                                             493

  5-10 MLN                                   128

   1-5 MLN                                                                     335

  0,5-1 MLN                   60

    0-500 K                                                     234

              NUMBER OF COOPERATIVES

              0                        100               200            300                 400                         500

 This report presents rankings based on turnover as well as the ratio of turnover over Gross Domestic Product
 (GDP) per capita. The ratio of turnover over GDP per capita measures the turnover of the Top 300 cooperative
 and mutual enterprises in terms of the purchasing power of an economy, relating the turnover of the
 enterprise to the wealth of the country. It does not compute the contribution of each enterprise to the national
 GDP. Rather, it measures the size of the enterprise in its national context.

                                                                                                     2016 Highlights    7
EXPLORING THE COOPERATIVE ECONOMY

               2,575 ORGANISATIONS
                                                              TOP 300
                                                        BASED ON TURNOVER IN US $                                              DISTRIBUTED IN
               300                                  TOTAL TURNOVER 2,018.02 BILLION US$                                         26 COUNTRIES

                             2%                                                                                  1%
                             Other services                                                             Health, education
4%                                                                                                       and social care

Industry and utilities

7%                                                                                                                                       33%
   Banking and                                                                                                              Insurance cooperatives
financial services                                             ORGANISATIONS                                                     and mutuals

20%                                                                                                                                     33%
  Wholesale                                                                                                                        Agriculture
and retail trade                                                                                                                and food industries

                               ORGANISATION                                                                     COUNTRY

                                              Groupe Crédit Agricole          France
                                                      Groupe BPCE             France
                                                                BVR           Germany
                                                         Zenkyoren            Japan
                                                       REWE Group             Germany
                                                        Nippon Life           Japan
                                                ACDLEC - E. Leclerc           France
                                               Groupe Crédit Mutuel           France
                                                           Zen-Noh            Japan
                                                        State Farm            USA
     1     2     3       4    5    6    7      8   9   10

RANK 2016                                The complete Top 300 ranking based on turnover in US$ is on page 72.                  SECTOR OF ACTIVITY

 8   2016 Highlights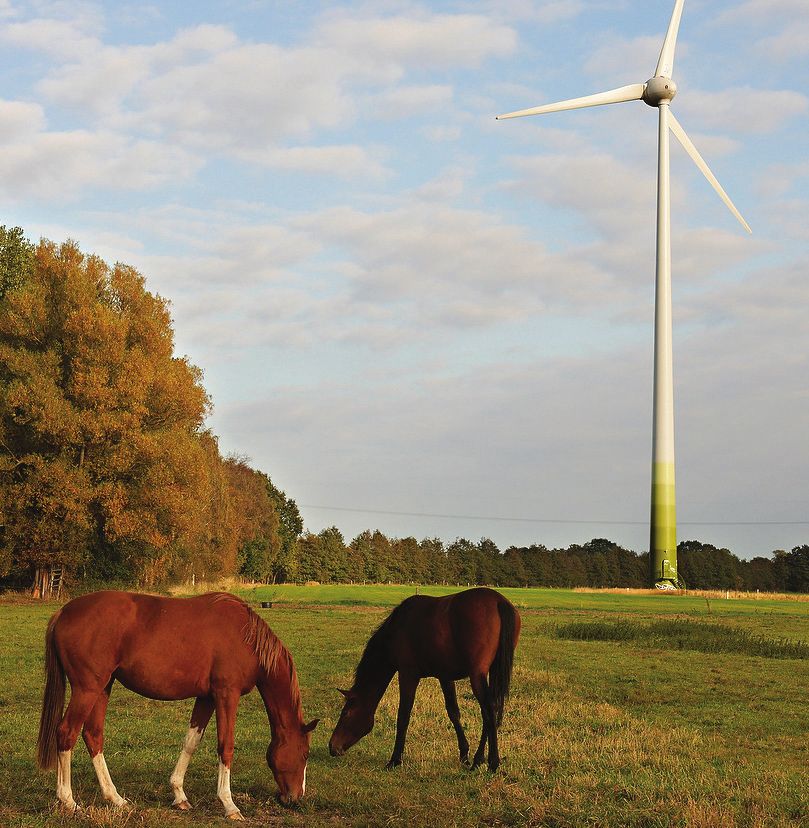
REPORT 2018

                    TURNOVER
                    GDP PER CAPITA
                                                                TOP 300
                                                                                                                                  DISTRIBUTED IN
                                                     BASED ON TURNOVER/GDP PER CAPITA                                              34 COUNTRIES

                             2%                                                                                         2%
                             Other services                                                                Health, education
2%                                                                                                          and social care

Industry and utilities

8%                                                                                                                                          35%
   Banking and                                                                                                                        Agriculture
financial services                                                 ORGANISATIONS                                                   and food industries

19%                                                                                                                                         32%
  Wholesale                                                                                                                    Insurance cooperatives
and retail trade                                                                                                                    and mutuals

                                  ORGANISATION                                                                     COUNTRY

                                               IFFCO                             India
                              Groupe Crédit Agricole                             France
                                       Groupe BPCE                               France
Gujarat Cooperative Milk Marketing Federation Limited                            India
                                           Zenkyoren                             Japan
                                           Nonghyup                              Republic of Korea
                                                 BVR                             Germany
                                 ACDLEC - E. Leclerc                             France
                                        REWE Group                               Germany
                                Groupe Crédit Mutuel                             France
    1     2     3        4    5      6      7    8    9    10

RANK 2016                                The complete Top 300 ranking based on turnover/GDP per CAPITA is on page 81.             SECTOR OF ACTIVITY

                                                                                                                                    2016 Highlights   9
EXPLORING THE COOPERATIVE ECONOMY

NATIONAL                                                                     USA
RANKINGS                                                                     Top 100 Agriculture Cooperatives -
                                                                             published by United States Department
                                                                             of Agriculture Rural Development (USDA)
The highlighted countries publish
or have recently published a                                                 NCB Co-op 100 - published by National
                                                                             Cooperative Bank (NCB)
national ranking of the largest
cooperatives or a report on their
country’s cooperative movement
including rankings based on
turnover of cooperatives.
The World Cooperative Monitor
encourages national organisations
and federations at all levels to       Colombia
                                       Desempeño Sector Cooperativo Colombiano
collect as much data as possible. If
                                       – published by Confecoop - Confederación de
you would like assistance creating     Cooperativas de Colombia
your national ranking or report, we
are available to assist you and to
share our methodology.

Contact us! monitor@monitor.coop

 10   National Rankings
REPORT 2018
UK France Japan
The UK Co-operative La cooperation agricole et agroalimentaire, Top 10 Community-Based
Economy report – published Panorama and Les 100 plus grandes entreprises Retail Co-ops in Japan –
by Co-operatives UK coopératives françaises – published by CoopFR published by JCCU
Spain Malaysia
Listado de empresas más relevantes de la Top 100 cooperatives in Malaysia –
Economía social – published by CEPES published by Suruhanjaya Koperasi
Malaysia (SKM)
Australia
National Mutual Economy Report
– published by Business Council of
Co-operatives and Mutuals
New Zealand
The New Zealand Co-operative Economy – published by
NZ.Coop and Massey University
National Rankings 11EXPLORING THE COOPERATIVE ECONOMY SECTOR SNAPSHOTS 12 Sector Snapshots
REPORT 2018

The following pages present the World Cooperative Moni-                  Two different indicators have been used in these rank-
tor rankings by sector of activity. The results presented in             ings: turnover in US dollars and the ratio of turnover
the rankings are to be considered exploratory, not exhaus-               over GDP per capita. The ratio of turnover over GDP
tive. The methodology found on page 63 provides details                  is not intended to compute the contribution of each
concerning the data collection and analysis; however, some               cooperative to the national GDP, but rather to relate
key points to keep in mind regarding the rankings include:               the turnover of the cooperative to the wealth of the
                                                                         country in which it operates. GDP per capita mea-
––   If an organisation performs more than one activity, it is           sures the purchasing power of an economy in an in-
     categorized in the sector representing its primary activi-          ternationally comparable way. Therefore, the ratio of
     ty. Note that there is no ranking for the “Other activities”        turnover over GDP per capita measures the turnover
     sector due to the limited number of cooperatives in the             of a cooperative in terms of the purchasing power of
     dataset in that category.                                           an economy, in an internationally comparable way.

––   Comparisons among cooperatives in different sectors            ––   The rankings in this edition are based on data from 2016.
     should be made with due caution, keeping in mind                    To create the Top 300 and sector rankings based on U.S.
     that varying economic indicators have been used for                 Dollars (USD) the 2016 average exchange rate was uti-
     different types of organisations (banking income for                lized. Note that the conversion to USD from Local cur-
     banks, premium income for insurance cooperatives                    rency unit (LCU) is impacted by the fluctuations from year
     and mutuals, and turnover for other cooperatives).                  to year.

                                                                                                                  Sector Snapshots   13
EXPLORING THE COOPERATIVE ECONOMY
AND FOOD INDUSTRIES
AGRICULTURE
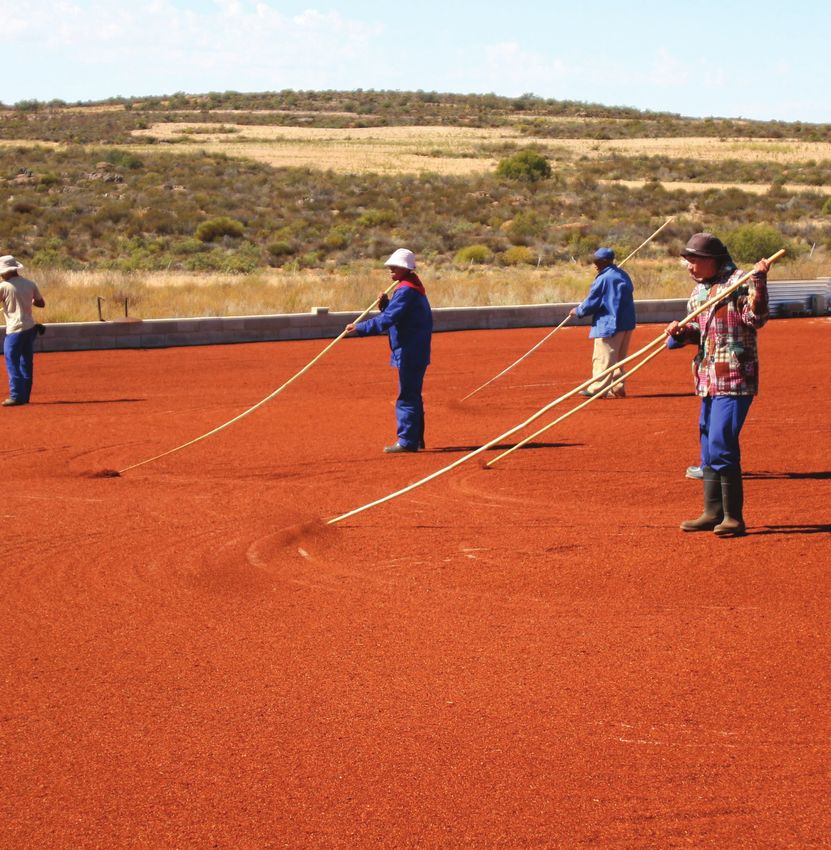
Heiveld (South Africa)
Photo courtesy of Stories.coop
14 Sector SnapshotsREPORT 2018
This section includes all cooperatives that operate along the entire agricultural value chain, starting from the
cultivation of agricultural products and livestock farming to the industrial processing of agricultural products
and animals. This sector includes both agricultural producers’ cooperatives and consortia of cooperatives (or
similar arrangements) that carry out the processing and marketing of agricultural goods for their members.
Agricultural cooperatives exist in almost every country around the world. They are very well represented in
both developed and emerging economies and contribute to food security and poverty reduction in different
areas of the world. They help farmers increase their returns and income by pooling their resources to support
collective arrangements and economic empowerment.
846
AGRICULTURE AND FOOD INDUSTRIES ORGANISATIONS
THE ORGANISATIONS IN THIS YEAR’S DATASET ARE DISTRIBUTED IN
ASIA -
AFRICA PACIFIC AMERICAS EUROPE
- 53 131 662
Sector Snapshots 15EXPLORING THE COOPERATIVE ECONOMY
846
TOP 20
2,575 ORGANISATIONS
386 OVER 100 M US$
846 DISTRIBUTED BASED ON TURNOVER IN US $
IN 30 COUNTRIES TOTAL TURNOVER 274.25 BILLION US$
TOP 20 TOTAL TURNOVER DISTRIBUTED IN 10 COUNTRIES
SWITZERLAND
NEW ZEALAND
NETHERLANDS FRANCE DENMARK GERMANY REPUBLIC JAPAN USA
BRAZIL OF KOREA
RANK ORGANISATION COUNTRY TURNOVER 2016 SOURCE
2016 (BILLION US$)
1 Zen-Noh Japan 44.06 WCM questionnaire
2 Nonghyup* Republic of Korea 36.45 WCM questionnaire
3 CHS Inc. USA 30.35 NCB
4 Bay Wa Germany 17.06 Eikon
5 Hokuren Japan 14.06 Orbis
6 Dairy Farmers of America USA 13.50 NCB
7 Fonterra New Zealand 13.40 NZ.COOP
8 Land O'Lakes, Inc. USA 13.20 NCB
9 FrieslandCampina Netherlands 12.18 NCR
10 Arla Food Denmark 10.83 Orbis
11 Danish Crown Denmark 9.21 WCM questionnaire
12 Copersucar Brazil 7.55 Euricse
13 In Vivo France 7.09 CoopFR
14 Südzucker Germany 7.07 Eikon
15 Growmark, Inc. USA 7.03 NCB
16 Agravis Germany 6.93 Orbis
17 DLG Denmark 6.79 Orbis
18 Fenaco Switzerland 6.04 Orbis
19 Terrena France 5.75 CoopFR
20 Agrial France 5.71 CoopFR
*The Nonghyup figure includes figures of the subsidiaries in the insurance and banking sectors
16 Sector SnapshotsREPORT 2018
TURNOVER
TOP 20
GDP PER CAPITA
AGRICULTURE AND
BASED ON TURNOVER/GDP PER CAPITA FOOD INDUSTRIES
TOP 20 TURNOVER OVER GDP PER CAPITA DISTRIBUTED IN 10 COUNTRIES
NETHERLANDS
DENMARK
FRANCE NEW ZEALAND GERMANY USA REPUBLIC BRAZIL JAPAN INDIA
OF KOREA
RANK ORGANISATION COUNTRY TURNOVER/GDP PER SOURCE
2016 CAPITA 2016
1 IFFCO India 2,572,145.62 WCM questionnaire
Gujarat Cooperative Milk
2 India 1,796,474.31 Orbis
Marketing Federation Ltd
3 Nonghyup* Republic of Korea 1,320,316.68 WCM questionnaire
4 Zen-Noh Japan 1,130,492.78 WCM questionnaire
5 Copersucar Brazil 873,592.28 Euricse
6 Kribhco India 640,861.67 Euricse
7 CHS Inc USA 526,962.50 NCB
8 Bay Wa Germany 403,996.36 Eikon
9 Hokuren Japan 360,718.55 Orbis
10 Coamo Brazil 359,194.71 Euricse
11 Fonterra New Zealand 332,346.13 NZ.COOP
12 FrieslandCampina Netherlands 266,890.02 NCR
13 Dairy Farmers of America USA 234,421.65 NCB
14 CVALE Brazil 229,376.24 Orbis
15 Land O'Lakes, Inc. USA 229,212.28 NCB
16 Arla foods amba Denmark 202,061.28 Orbis
17 In Vivo France 192,219.66 CoopFR
18 Danish Crown Denmark 171,985.71 WCM questionnaire
19 Südzucker Germany 167,446.11 Eikon
20 Agravis Germany 163,980.31 Orbis
*The Nonghyup figure includes figures of the subsidiaries in the insurance and banking sectors
Sector Snapshots 17EXPLORING THE COOPERATIVE ECONOMY
AND UTILITIES
INDUSTRY
Greenpeace Energy eG (Germany)
Photo courtesy of Stories.coop
(Copyright: Sabine Vielmo / Greenpeace Energy eG)
18 Sector SnapshotsREPORT 2018
This section includes cooperatives operating in industrial sectors with the exception of the food industry.
It includes worker cooperatives in the construction sector and cooperatives in the utilities sector, that is,
cooperatives that are active in the management of infrastructure for a public service, such as electricity,
natural gas, and water. Energy and other public services are sectors in which cooperatives are strongly
motivated by ethical-cultural considerations and innovation. Often, they are committed to “green” energy and
employ a more sustainable and responsible model of development, while providing local communities with the
power to intervene directly in their own futures.
174
INDUSTRY AND UTILITIES ORGANISATIONS
THE ORGANISATIONS IN THIS YEAR’S DATASET ARE DISTRIBUTED IN
ASIA -
AFRICA PACIFIC AMERICAS EUROPE
- 11 27 136
Sector Snapshots 19EXPLORING THE COOPERATIVE ECONOMY
174
TOP 10
2,575 ORGANISATIONS
84 OVER 100 M US$
DISTRIBUTED BASED ON TURNOVER IN US $
IN 21 COUNTRIES TOTAL TURNOVER 25.06 BILLION US$
174
TOP 10 TOTAL TURNOVER
DISTRIBUTED IN 4 COUNTRIES
ITALY BELGIUM USA SPAIN
RANK ORGANISATION COUNTRY TURNOVER 2016 SOURCE
2016 (BILLION US$)
1 Corporacion Mondragon* Spain 13.32 Cepes
2 Basin Electric Power Cooperative USA 2.05 NCB
3 Oglethorpe Power Corporation USA 1.51 NCB
4 Tri-State G&T Association USA 1.35 NCB
5 Central Electric Power Cooperative, Inc. USA 1.26 NCB
6 ORES Assets Belgium 1.17 NBB
7 Eandis System Operator Belgium 1.16 NBB
8 Associated Electric Cooperative Inc. USA 1.09 NCB
9 SACMI Italy 1.07 Aida
10 Seminole Electric Cooperative USA 1.07 NCB
* The Mondragon group figure includes consumer cooperative Eroski
20 Sector SnapshotsREPORT 2018
TURNOVER
TOP 10
GDP PER CAPITA
INDUSTRY
BASED ON TURNOVER/GDP PER CAPITA AND UTILITIES
TOP 10 TURNOVER OVER GDP PER CAPITA
DISTRIBUTED IN 5 COUNTRIES
BELGIUM ITALY USA SPAIN
NETHERLANDS
RANK ORGANISATION COUNTRY TURNOVER/GDP PER SOURCE
2016 CAPITA 2016
1 Corporacion Mondragon* Spain 500,546.53 Cepes
2 Basin Electric Power Cooperative USA 35,597.36 NCB
3 SACMI Italy 34,988.90 Aida
4 C.M.C. Italy 34,323.05 Aida
5 ORES Assets Belgium 28,424.82 NBB
6 Eandis System Operator Belgium 28,176.64 NBB
7 Oglethorpe Power Corporation USA 26,168.40 NCB
8 Tri-State G&T Association USA 23,511.62 NCB
9 Central Electric Power Cooperative, Inc. USA 21,879.35 NCB
10 AVIA Netherlands 20,621.44 NCR
* The Mondragon group figure includes consumer cooperative Eroski
Sector Snapshots 21EXPLORING THE COOPERATIVE ECONOMY
AND RETAIL TRADE
WHOLESALE
NTUC FairPrice (Singapore)
Photo courtesy of Stories.coop
22 Sector SnapshotsREPORT 2018
This section includes cooperatives formed to purchase and supply goods and services at competitive conditions
in the interest of their members. There are various types of cooperative forms found within this sector,
including purchasing and consumer cooperatives operating in wholesale and retail activities. As is the case
with cooperatives in general, the aim of cooperatives in this sector is not to maximize profits, but to be of
use to their members and defend their interests. The goals of cooperatives include fostering sustainable
development of local communities, promoting environmental concerns and ensuring the health and safety
of consumers. With strength in numbers, cooperatives are able to further these aims through their ability to
purchase and supply goods and services at competitive conditions in the interest of their members.
376
WHOLESALE AND RETAIL TRADE ORGANISATIONS
THE ORGANISATIONS IN THIS YEAR’S DATASET ARE DISTRIBUTED IN
AFRICA AMERICAS ASIA - PACIFIC EUROPE
1 31 42 302
Sector Snapshots 23EXPLORING THE COOPERATIVE ECONOMY
376
TOP 20
2,575 ORGANISATIONS
272 OVER 100 M US$
DISTRIBUTED BASED ON TURNOVER IN US $
376 IN 32 COUNTRIES TOTAL TURNOVER 355.24 BILLION US$
TOP 20 TOTAL TURNOVER DISTRIBUTED IN 11 COUNTRIES
NORWAY NETHERLANDS
CANADA FINLAND UK ITALY USA SWITZERLAND FRANCE GERMANY
DENMARK
RANK ORGANISATION COUNTRY TURNOVER 2016 SOURCE
2016 (BILLION US$)
1 REWE Group Germany 54.57 Euricse
2 ACDLEC - E. Leclerc France 48.10 CoopFR
3 Edeka Zentrale Germany 34.23 Euricse
4 Coop Swiss Switzerland 28.76 Orbis
5 Migross Switzerland 28.17 Orbis
6 Système U France 21.26 CoopFR
7 Coop Italy 14.50 Euricse
8 Conad Italy 13.73 Euricse
9 John Lewis Partnership PLC UK 13.59 Co-operatives UK
10 Wakefern Food Corp./Shoprite USA 12.84 NCB
11 Co-operative Group Limited UK 12.84 Co-operatives UK
12 SOK Finland 11.60 WCM questionnaire
13 CCA Global Partners USA 11.30 WCM questionnaire
14 Astera France 10.57 CoopFR
15 Associated Wholesale Grocers, Inc USA 9.18 NCB
16 Superunie Netherlands 7.15 NCR
17 Federated Co-operatives Limited Canada 6.32 WCM questionnaire
18 Coop amba Denmark 5.81 Orbis
19 Coop Norge Norway 5.59 Orbis
20 ACE Hardware Corp. USA 5.13 NCB
24 Sector SnapshotsREPORT 2018
TURNOVER
TOP 20
GDP PER CAPITA
WHOLESALE
BASED ON TURNOVER/GDP PER CAPITA AND RETAIL TRADE
TOP 10 TURNOVER OVER GDP PER CAPITA
DISTRIBUTED IN 12 COUNTRIES
COLOMBIA NEW NETHERLANDS
ZEALAND
DENMARK CANADA FINLAND USA UK SWITZERLAND ITALY GERMANY FRANCE
RANK ORGANISATION COUNTRY TURNOVER/GDP PER SOURCE
2016 CAPITA 2016
1 ACDLEC - E. Leclerc France 1,304,487.09 CoopFR
2 REWE Group Germany 1,292,064.17 Euricse
3 Edeka Zentrale Germany 810,625.81 Euricse
4 Système U France 576,568.88 CoopFR
5 Coop Italy 472,930.84 Euricse
6 Conad Italy 447,659.72 Euricse
7 Coop Swiss Switzerland 360,090.35 Orbis
8 Migros Switzerland 352,665.29 Orbis
9 John Lewis Partnership PLC UK 336,314.72 Co-operatives UK
10 Co-operative Group Limited UK 317,724.86 Co-operatives UK
11 Astera France 286,632.81 CoopFR
12 SOK Finland 267,106.18 WCM questionnaire
13 Wakefern Food Corp./Shoprite USA 222,961.03 NCB
14 CCA Global Partners USA 196,219.60 WCM questionnaire
15 Associated Wholesale Grocers, Inc USA 159,476.18 NCB
16 Superunie Netherlands 156,674.46 NCR
17 Federated Co-operatives Limited Canada 149,322.80 WCM questionnaire
18 Foodstuffs North Island New Zealand 111,439.81 NZ.COOP
19 COOP AMBA Denmark 108,386.71 Orbis
20 Copidrogas Colombia 96,498.35 COLCoop
Sector Snapshots 25EXPLORING THE COOPERATIVE ECONOMY
COOPERATIVES
AND MUTUALS
INSURANCE
Uplift Mutuals (India)
Photo courtesy of Stories.coop
26 Sector SnapshotsREPORT 2018
This section focuses on mutual organisations and cooperatives owned and democratically controlled by their
insured customers. Insurance cooperatives and mutuals focus on the long-term needs of their customers
and on delivering high quality products at fair prices. According to the International Cooperative and Mutual
Insurance Federation (ICMIF), mutual or cooperative insurers serve more than 900 million people worldwide.
Their contribution is crucial within the social protection system, enabling members to obtain insurance
policies at more favourable conditions than those available on the open market.
156
INSURANCE COOPERATIVES AND MUTUALS ORGANISATIONS
THE ORGANISATIONS IN THIS YEAR’S DATASET ARE DISTRIBUTED IN
AFRICA AMERICAS ASIA - PACIFIC EUROPE
- 44 44 68
Sector Snapshots 27EXPLORING THE COOPERATIVE ECONOMY
156
TOP 20
2,575 ORGANISATIONS
139 OVER 100 M US$
DISTRIBUTED BASED ON TURNOVER IN US $
IN 22 COUNTRIES TOTAL TURNOVER 469.10 BILLION US$
156
TOP 20 TOTAL TURNOVER DISTRIBUTED IN 7 COUNTRIES
AUSTRIA NETHERLANDS
ITALY GERMANY FRANCE JAPAN USA
RANK ORGANISATION COUNTRY TURNOVER 2016 SOURCE*
2016 (BILLION US$)
1 Zenkyoren Japan 54.62 WCM questionnaire
2 Nippon Life Japan 48.17 Euricse
3 State Farm USA 40.80 Orbis
4 Liberty Mutual USA 34.94 Euricse
5 Talanx Group Germany 34.44 Euricse
6 Sumitomo Life Japan 31.82 Euricse
7 Meiji Yasuda Life Japan 26.37 Euricse
8 Nationwide USA 22.19 Euricse
9 Achmea Netherlands 21.59 NCR
10 MassMutual Financial USA 21.25 Euricse
11 COVEA France 18.17 Orbis
12 Northwestern Mutual USA 17.92 Euricse
13 New York Life USA 15.72 Euricse
14 Unipol Italy 15.67 Orbis
15 Coöperatie VGZ Netherlands 11.66 NCR
16 American Family USA 11.40 Orbis
17 AG2R La Mondiale France 11.15 Euricse
18 Groupama France 11.08 Euricse
19 Vienna Insurance Group Austria 10.19 Eikon
20 Pacific Life USA 9.97 Orbis
* The International Cooperative and Mutual Insurance Federation (ICMIF) did not publish the Global 500 report for FY 2016.
Therefore as much data as possible was collected using other available data sources.
28 Sector SnapshotsREPORT 2018
TURNOVER
TOP 20
GDP PER CAPITA
INSURANCE
COOPERATIVES
BASED ON TURNOVER/GDP PER CAPITA AND MUTUALS
TOP 20 TURNOVER OVER GDP PER CAPITA DISTRIBUTED IN 7 COUNTRIES
AUSTRIA GERMANY
ITALY NETHERLANDS FRANCE USA JAPAN
RANK ORGANISATION COUNTRY TURNOVER/GDP PER SOURCE
2016 CAPITA 2016
1 Zenkyoren Japan 1,401,490.80 WCM questionnaire
2 Nippon Life Japan 1,236,076.56 Euricse
3 Sumitomo Life Japan 816,530.38 Euricse
4 Talanx Group Germany 815,496.88 Euricse
5 State Farm USA 708,388.98 Orbis
6 Meiji Yasuda Life Japan 676,669.85 Euricse
7 Liberty Mutual USA 606,631.13 Euricse
8 Unipol Italy 511,046.89 Orbis
9 COVEA France 492,807.39 Orbis
10 Achmea Netherlands 473,080.20 NCR
11 Nationwide USA 385,371.82 Euricse
12 MassMutual Financial USA 368,927.58 Euricse
13 Northwestern Mutual USA 311,086.21 Euricse
14 AG2R La Mondiale France 302,446.02 Euricse
15 Groupama France 300,416.41 Euricse
16 New York Life USA 272,936.26 Euricse
17 Coöperatie VGZ Netherlands 255,414.79 NCR
18 Vienna Insurance Group Austria 227,746.65 Eikon
19 CZ groep Netherlands 216,428.13 NCR
20 American Family USA 197,873.16 Orbis
Sector Snapshots 29EXPLORING THE COOPERATIVE ECONOMY
FINANCIAL SERVICES
BANKING AND
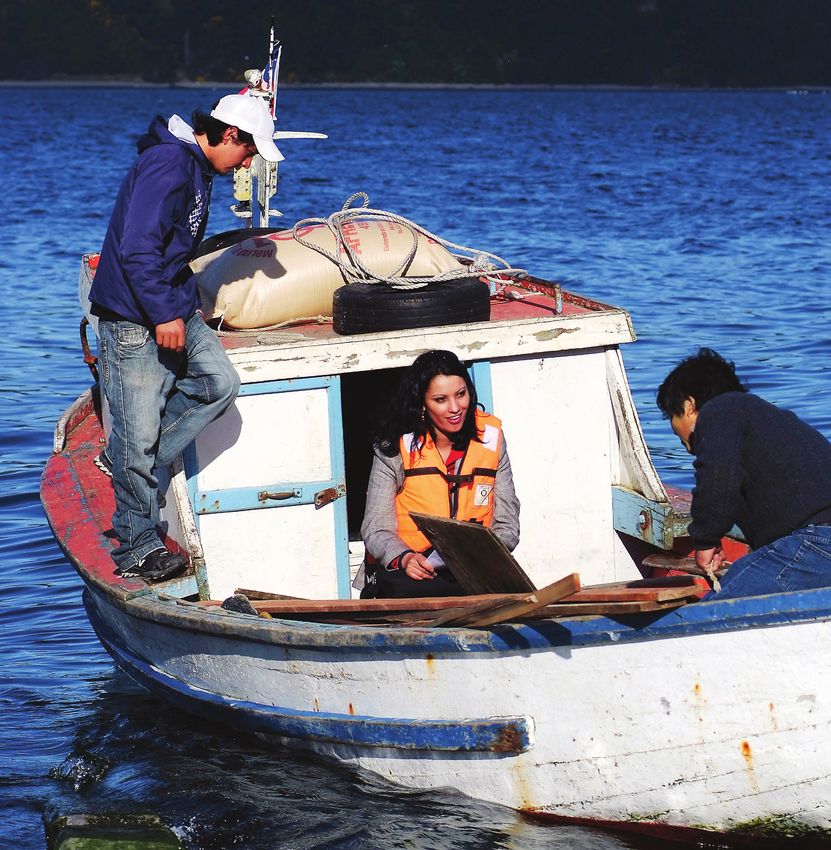
Coopeuch (Chile)
Photo courtesy of Stories.coop
30 Sector SnapshotsREPORT 2018
This section refers to cooperative banks and credit unions providing banking and financial intermediation
services, democratically controlled by member customers (borrowers and depositors). Also included are credit
unions and banks whose capital owners are composed of individuals without rights regarding the management
of the bank or credit union. In the banking sector, cooperatives play a central role in supporting economic
development. Even during the recent economic crisis, cooperatives have remained more stable than other
banks, continuing to provide trustworthy financial support for their members.
494
BANKING AND FINANCIAL SERVICES ORGANISATIONS
THE ORGANISATIONS IN THIS YEAR’S DATASET ARE DISTRIBUTED IN
AFRICA ASIA - PACIFIC AMERICAS EUROPE
5 96 142 251
Sector Snapshots 31EXPLORING THE COOPERATIVE ECONOMY
494
TOP 10
2,575 ORGANISATIONS
179 OVER 100 M US$
BASED ON TURNOVER IN US $
494 DISTRIBUTED
IN 30 COUNTRIES TOTAL TURNOVER 196.99 BILLION US$
TOP 10 TOTAL TURNOVER DISTRIBUTED IN 8 COUNTRIES
JAPAN CANADA USA NETHERLANDS GERMANY FRANCE
AUSTRIA
RANK ORGANISATION COUNTRY TURNOVER 2016 SOURCE
2016 (BILLION US$)
1 Groupe Crédit Agricole France 45.66 Euricse
2 BVR Germany 44.72 Euricse
3 Groupe Crédit Mutuel France 31.75 Euricse
4 Groupe BPCE France 26.59 Euricse
5 Rabobank Netherlands 14.18 WCM questionnaire
6 Desjardins Group Canada 11.51 Euricse
Federal Farm Credit Banks
7 USA 8.08 Euricse
Funding Corp.
8 RZB Austria 5.35 Euricse
9 Navy Federal Credit Union USA 4.67 Euricse
10 The Norinchukin bank Japan 4.47 Euricse
32 Sector SnapshotsREPORT 2018
TURNOVER
TOP 10
GDP PER CAPITA
BANKING AND
BASED ON TURNOVER/GDP PER CAPITA FINANCIAL SERVICES
TOP 10 TURNOVER OVER GDP PER CAPITA DISTRIBUTED IN 8 COUNTRIES
AUSTRIA USA BRAZIL KENYA NETHERLANDS GERMANY FRANCE
CANADA
RANK ORGANISATION COUNTRY TURNOVER/GDP PER SOURCE
2016 CAPITA 2016
1 Groupe Crédit Agricole France 1,238,512.00 Euricse
2 BVR Germany 1,058,866.56 Euricse
3 Groupe Crédit Mutuel France 861,219.73 Euricse
4 Groupe BPCE France 721,101.49 Euricse
5 Rabobank Netherlands 310,656.00 Euricse
6 Desjardins Group Canada 271,901.22 Euricse
7 Cooperative Bank of Kenya Kenya 240,104.66 Euricse
8 Sicredi Brazil 229,589.75 WCM questionnaire
Federal Farm Credit Banks
9 USA 140,323.06 Euricse
Funding Corp.
10 RZB Austria 119,627.71 Euricse
Sector Snapshots 33EXPLORING THE COOPERATIVE ECONOMY
People’s Organization of Community Acupuncture (USA)
Photo courtesy of Stories.coop
(Copyright Milwaukee Community Acupuncture)
AND SOCIAL CARE
EDUCATION
HEALTH,
34 Sector SnapshotsREPORT 2018
This section includes cooperatives that manage health, social, or educational services. These may include
consumer (user), producer (provider) and multistakeholder social and health cooperatives that seek to provide
high-quality, cost-effective community health care and social services. The contributions of health and social
care cooperatives range from medical intervention to the prevention of disease and the improvement of general
health outcomes and collective well-being. The impact of these organisations is all the more important given
the increasing demands on welfare systems around the world due in part to cuts in public funding and an aging
population.
97
HEALTH, EDUCATION AND SOCIAL CARE ORGANISATIONS
THE ORGANISATIONS IN THIS YEAR’S DATASET ARE DISTRIBUTED IN
ASIA -
AFRICA PACIFIC AMERICAS EUROPE
- 10 25 62
Sector Snapshots 35EXPLORING THE COOPERATIVE ECONOMY
97
TOP 10
2,575 ORGANISATIONS
21 OVER 100 M US$
DISTRIBUTED BASED ON TURNOVER IN US $
IN 15 COUNTRIES TOTAL TURNOVER 11.39 BILLION US$
97
TOP 10 TOTAL TURNOVER DISTRIBUTED IN 5 COUNTRIES
COLOMBIA BELGIUM BRAZIL SPAIN USA
RANK ORGANISATION COUNTRY TURNOVER 2016 SOURCE
2016 (BILLION US$)
1 HealthPartners Inc. USA 6.03 NCB
2 Fundación Espriu Spain 1.93 WCM questionnaire
3 Unimed do Brasil* Brazil 1.33 Euricse
Intercommunale de sante publique
4 Belgium 0.45 NBB
du pays de Charleroi
Centre hospitalier regional
5 Belgium 0.38 NBB
de la citadelle
6 Coosalud Colombia 0.34 COLCoop
Cooperativa de salud comunitaria
7 Colombia 0.32 COLCoop
COMPARTA
Centre Hospitalier Universitaire et
8 Belgium 0.21 NBB
Psychiatrique de MONS-BORINAGE
Cooperativa de Trabalho Educacional
9 Brazil 0.20 WCM questionnaire
COOPEEB Ltda
Intercommunale De Soins
10 Belgium 0.19 NBB
Specialises De Liege
* data refers exclusively to the Central National Unimed.
36 Sector SnapshotsREPORT 2018
TURNOVER
TOP 10
GDP PER CAPITA
HEALTH, EDUCATION
BASED ON TURNOVER/GDP PER CAPITA AND SOCIAL CARE
TOP 10 TURNOVER OVER GDP PER CAPITA DISTRIBUTED IN 5 COUNTRIES
BELGIUM SPAIN USA COLOMBIA BRAZIL
RANK ORGANISATION COUNTRY TURNOVER/GDP PER SOURCE
2016 CAPITA 2016
1 Unimed do Brasil* Brazil 154,150.86 Orbis
2 HealthPartners Inc. USA 104,777.79 NCB
3 Fundación Espriu Spain 72,460.74 WCM questionnaire
4 Coosalud Colombia 58,407.69 COLCoop
Cooperativa de salud comunitaria
5 Colombia 54,878.85 COLCoop
COMPARTA
Cooperativa de Trabalho Educacional
6 Brazil 23,269.40 WCM questionnaire
COOPEEB Ltda
7 COOMEVA Colombia 12,927.00 COLCoop
Intercommunale de sante publique
8 Belgium 11,023.52 NBB
du pays de Charleroi
9 ECOOPSOS Colombia 10,626.96 COLCoop
Centre hospitalier regional
10 Belgium 9,221.54 NBB
de la citadelle
* data refers exclusively to the Central National Unimed.
Sector Snapshots 37EXPLORING THE COOPERATIVE ECONOMY
SERVICES
OTHER
Mobility Car Sharing (Switzerland)
Photo courtesy of Stories.coop
38 Sector SnapshotsREPORT 2018
This section covers all cooperatives that provide services other than those included in health, education and
social care, such as cooperative business services, communications and transportation. The cooperatives in
this sector show the variety of sectors of activity in which cooperatives may operate as well as the potential
areas for further development of service-oriented cooperatives.
410
OTHER SERVICES ORGANISATIONS
THE ORGANISATIONS IN THIS YEAR’S DATASET ARE DISTRIBUTED IN
ASIA -
AFRICA AMERICAS PACIFIC EUROPE
3 16 32 359
Sector Snapshots 39EXPLORING THE COOPERATIVE ECONOMY
410
TOP 10
2,575 ORGANISATIONS
DISTRIBUTED BASED ON TURNOVER IN US $
410 IN 29 COUNTRIES TOTAL TURNOVER 12 BILLION US$ 66 OVER 100 M US$
TOP 10 TOTAL TURNOVER DISTRIBUTED IN 8 COUNTRIES
BELGIUM ITALY FRANCE SPAIN GERMANY AUSTRALIA SWEDEN NORWAY FRANCE
RANK ORGANISATION COUNTRY TURNOVER 2016 SOURCE
2016 (BILLION US$)
1 Selectour France 2.86 CoopFR
2 OBOS BBL Norway 1.56 Orbis
3 Capricorn Society Ltd Australia 1.15 CEMI
4 HSB Riksförbund Sweden 1.11 WCM questionnaire
5 Datev Germany 1.03 Euricse
6 Riksbyggen Sweden 0.99 WCM questionnaire
7 Grupo Ilunion Spain 0.99 Cepes
8 Orcab France 0.86 CoopFR
9 CNS Italy 0.85 Aida
Centrale der Werkgevers aan de Haven
10 Belgium 0.60 NBB
van Antwerpen
40 Sector SnapshotsREPORT 2018
TURNOVER
TOP 10
GDP PER CAPITA
BASED ON TURNOVER/GDP PER CAPITA OTHER SERVICES
TOP 10 TURNOVER OVER GDP PER CAPITA DISTRIBUTED IN 9 COUNTRIES
SWEDEN NORWAY GERMANY ITALY SPAIN MALAYSIA FRANCE INDONESIA
AUSTRALIA
RANK ORGANISATION COUNTRY TURNOVER/GDP PER SOURCE
2016 CAPITA 2016
1 Koperasi Telekomunikasi Selular Indonesia 121,546.82 WCM questionnaire
2 Selectour France 77,476.44 CoopFR
Koperasi Permodalan Felda Malaysia
3 Malaysia 37,498.51 SKM
Berhad
4 Grupo Ilunion Spain 37,308.67 Cepes
5 CNS Italy 27,858.76 Aida
6 Datev Germany 24,336.41 Euricse
7 Orcab France 23,272.96 CoopFR
8 Capricorn Society Ltd Australia 23,024.68 CEMI
9 Obos Bbl Norway 21,980.64 Orbis
10 Hsb Riksförbund Sweden 21,416.88 WCM questionnaire
Sector Snapshots 41EXPLORING THE COOPERATIVE ECONOMY TOP 300 AND SDGs 42 Top 300 and SDGs
REPORT 2018

BEYOND ECONOMIC IMPACT:
THE CONTRIBUTION OF THE TOP 300 TO SUSTAINABLE DEVELOPMENT

  Size, in economic terms, is only one of the dimensions that     Although the SDGs were conceived as a call to action for
can be used to evaluate cooperative enterprises. And it is just   countries, they can also be considered targets that companies
one of the many aspects of sustainable development, which         can focus on when they plan their activities. From this point of
has been a key theme in recent years.                             view, the assessment of the contribution of companies to the
                                                                  achievement of the SDGs requires not only an analysis of their
  In fact, since the end of the 1980s, the theme of integrat-     economic dimension, but also an assessment of their sus-
ing economic development, natural resources management            tainability in social and environmental terms. More generally,
and protection, and social equity and inclusion has been at the   this entails assessing their ability to counteract inequalities
centre of the international debate (see the 1987 Brundtland       and generate human well-being and social capital.
Report) that culminated in 2015 with the adoption by the Unit-
ed Nations of 17 Sustainable Development Goals (SDGs). The        Of course cooperatives also contribute to achieving the SDGs.
SDGs aim to reduce poverty, fight inequality, support social      Speaking on the 2013 International Day of Cooperatives, Guy
development and address aspects that are fundamentally im-        Ryder, Director General of the International Labour Organi-
portant to sustainable development, such as climate change        zation (ILO), emphasized “As global attention focuses on the
and the construction of peaceful societies, by the year 2030.     challenge of sustainable development, cooperatives can and
As already emphasised by the Millennium Development Goals         must play a key role as creative enterprises expanding into
(Birchall, 2004), the SDGs also offer a multidimensional view     new and innovative areas” (Dale et. al, 2013). Despite this, an
of development in which human well-being and poverty re-          ILO-ICA report (Wanyama, 2014) highlighted that, although
duction are at the centre of the actions which are based on es-   the Rio+20 Conference recognised the role of cooperatives
sential conditions such as environmental sustainability, equity   in achieving social inclusion and poverty reduction, they
and enabling a global economic environment.                       have been marginally involved in the process of defining the

                                                                                                                Top 300 and SDGs   43
EXPLORING THE COOPERATIVE ECONOMY
SDGs. This is most likely due to the lack of a full understand- the largest cooperative enterprises and mutuals in the world
ing of their potential for action. Moreover, the Blueprint for a are moving towards achieving the SDGs with the conviction
Cooperative Decade underlines how the term “sustainability” that “good data is essential for monitoring and achieving the
is not universally associated with cooperatives and reaffirms SDGs” (UN Data Revolution, 2014).
that one of ICA’s primary objectives is to demonstrate this as-
sociation and how cooperatives contribute to economic, social Which SDGs are the Top 300 targeting?
and environmental sustainability.
SDGs cover many spheres of action, ranging from poverty
Starting from this year, the World Cooperative Monitor proj- reduction to equitable and inclusive education, to combat-
ect aims to provide an opportunity to learn more about how ing inequalities, environmental protection, etc. Which ones
AN INTERVIEW WITH ENRICO GIOVANNINI
Enrico Giovannini
Spokesperson for the Italian Alliance for Sustainable Development, member of the global Alliance for Sustainability and
Prosperity, and Co-chair of the “Independent Expert Advisory Group on the Data Revolution for Sustainable Development”
established by the Secretary General of the United Nations
Progress and challenges on the road to 2030 Conference in Paris, initiated a gradual process of change
“Our task is to address the roots of each problem by building in the structure and functioning of the world economy. On
cooperation through the framework and tools of sustainable the one hand, we have seen an increasing awareness of the
development”, according to Italian economist and former la- relationship between the economy and environmental de-
bour minister, Enrico Giovannini. Professor Giovannini is the struction; between the economy and sustainable develop-
spokesperson for the Italian Alliance for Sustainable Develop- ment; between health and economic well-being; between
ment, which aims to increase awareness of the Sustainable the economy and growing inequalities. On the other hand,
Development Goals adopted by the United Nations. we have witnessed significant political decisions, such as the
United States’ withdrawal from the Paris Agreement, going
How is the international community doing with respect to in opposite directions: they set up a bilateral rather than
the UN’s 2030 Agenda? global development. We need, however, to move towards
“The achievement of the 2030 Agenda is progressing slow- multilateral cooperation, translating the SDGs into action on
ly. The goals defined in September 2015 by the Agenda, and the ground. The good news is that we are encouraged by the
in December 2015 by the United Nations Climate Change numerous initiatives committed to implementing the SDGs
44 Top 300 and SDGsREPORT 2018
are the largest cooperatives, mutuals, and non-cooperative reporting practices with a focus on the areas of action that
enterprises controlled by cooperatives contributing to? To are addressed in the enterprises’ reporting activities. While
answer this question, we analysed the sustainability reports the reports emphasize the actions that the enterprises want
of the enterprises listed in the 2018 Top 300 (based on turn- to communicate – therefore, not everything that is commu-
over) that joined the United Nations Global Compact project nicated might be fully implemented while not everything that
and/or the Global Reporting Initiative (GRI). This provides is implemented is necessarily reported – the analysis can
some preliminary insights on their reporting practices in provide interesting insights that can be used as a starting
relation to SDGs1. The analysis offers an overview of these point for future analysis on individual SDGs.
1
More details in the methodological note of the report.
and the Paris Climate Agreement. For example the first-ev- acknowledge that there is no single correct answer and that
er European Strategy for Plastics in a Circular Economy or no solution can be developed within the framework of a single
the European Commission’s legislative proposals on financ- country, which is why we need to cooperate at the international
ing sustainable growth. Ultimately, as evidenced during the level. According to Zygmunt Bauman, in these days the pre-
last High-level Political Forum for Sustainable Development dominant political aspiration is “Retrotopia”, which is projected
(HLPF), the implementation of the Sustainable Development towards the return to an ideal past more than towards the con-
Goals varies greatly from country to country, and that con- struction of a better future. Instead, if we aim at a “Sustainable
stitutes a weak point: we need a uniform attitude to bridge Utopia” through Environmental and Social Sustainability, the
the gaps. Our task is to address the roots of each problem need to make our voices heard becomes even more important”.
by building cooperation through the framework and tools of
sustainable development”. How and why should cooperatives play a key role in fulfill-
ing the United Nations’ sustainable development Agenda?
How can policymakers increase the level of implementation “Cooperative enterprises are by nature a sustainable and par-
of the SDGs? ticipatory form of business: it is in their DNA. It is not sufficient,
“We need to look beyond narrow economic indicators of prog- however. The pace of change is faster than ever and there must
ress, which have become the main driver of policy making. At be a strong commitment by all governments and all businesses
the opening event of the Italian Sustainable Development Fes- to advance the SDGs. Through collaborative strategies, we have
tival, Italian journalist Monica Maggioni said that the Agenda to review our past, think of our present situation and work on our
is a gift. This is because its complexity forces us to recognize future challenges. In doing so, cooperatives can play a key role in
that complex problems require complex solutions. We must promoting public awareness of a sustainable and viable future”.
Top 300 and SDGs 45EXPLORING THE COOPERATIVE ECONOMY
How many of the Top 300 joined the two initiatives?
Seventy-five organisations out of the 300 listed in the Top 300 tions that joined the GRI, 36 released a sustainability report
ranking joined at least one of the two initiatives: 19 joined both applying the GRI indicators. For the complete list of these or-
initiatives, 39 joined only the GRI initiative and 17 joined only ganisations, see the “Top 300: Rankings and SDG participa-
the United Nations Global Compact. Among the 58 organisa- tion” section of this report (Table 7).
FIGURE 1. TOP 300 ORGANISATIONS THAT JOINED THE GRI INITIATIVE
AND/OR THE UN GLOBAL COMPACT FIGURE 2. LEVEL OF PARTICIPATION IN THE GRI INITIATIVE
39
36
17 19 12
10
Joined only the GRI Joined only the UN Global Joined UN Global Report applying GRI Report citing GRI initiative Non GRI report
Initiative Compact Compact and GRI indicators
FIGURE 3. TOP 300 ORGANISATIONS THAT JOINED THE GRI INITIATIVE AND/OR THE UN GLOBAL COMPACT BY SECTOR OF ACTIVITY
3% 1% 0%
13%
Agriculture and food industries
Insurance
37%
Wholesale and retail trade
15% Banking and financial services
Industry
Health, Education and social care
Other services
31%
46 Top 300 and SDGsREPORT 2018
Which SDGs are addressed?
Twenty-eight of the 36 organisations that joined the United consumption and production patterns (Goal 12). They also
Nations Global Compact project declared they address at declare they are taking urgent action to combat climate
least one of the SDGs in their Communication on Progress change and its impacts (Goal 13), to ensure healthy lives
(CoP). All SDGs are addressed in some way by at least one of and promote well-being for people of all ages (Goal 3) and
the studied organisations in its report. to promote sustained, inclusive and sustainable economic
The statements provided by the Top 300 organisations show growth, full and productive employment and decent work for
that they pay particular attention to ensuring sustainable all (Goal 8).
FIGURE 4. SUSTAINABLE DEVELOPMENT GOALS (SDGS) ADDRESSED IN THE COPS OF THE TOP 300 ORGANISATIONS THAT ADHERE TO THE
UN GLOBAL COMPACT PROJECT.
Goal 1: No Poverty 10
Goal: Zero Hunger 14
Goal 3: Good Health and Well-Being for People 20
Goal 4: Quality Education 10
Goal 5: Gender Equality 16
Goal 6: Clean Water and Sanitation 9
Goal 7: Affordable and Clean Energy 15
Goal 8: Decent Work and Economic Growth 18
Goal 9: Industry, Innovation, and Infrastructure 12
Goal 10: Reducing Inequalities 12
Goal 11: Sustainable Cities and Communities 11
Goal 12: Responsible Consumption and Production 21
Goal 13: Climate Action 21
Goal 14: Life Below Water 8
Goal 15: Life on Land 12
Goal 16: Peace, Justice and Strong Institutions 7
Goal 17: Partnerships for the Goals 12
FIGURE 5. WITH RESPECT TO THE ORGANISATION’S ACTIONS TO ADVANCE THE SUSTAINABLE DEVELOPMENT GOALS (SDGS), THE COP DESCRIBES:
Opportunities and responsibilities that one or more SDGs represent to our business 15
Where the company’s priorities lie with respect to one or more SDGs 15
Goals and indicators set by our company with respect to one or more SDGs 15
How one or more SDGs are integrated into the company’s business model 11
The (expected) outcomes and impact of your company’s activities related to the SDGs 9
If the companies’ activities related to the SDGs are undertaken in collaboration with other stakeholders 8
Other established or emerging best practices 2
Top 300 and SDGs 47EXPLORING THE COOPERATIVE ECONOMY
Which are the most reported “business themes” that can There are four most reported themes: “ethical and lawful be-
contribute to achieving the SDGs? haviour”, “labour”, “environment” and “diversity and equal
opportunity”. The first is mentioned by all organizations along
The Top 300 organisations that compiled a sustainability re- similar lines, as cooperative enterprises relate their driving
port in accordance with the GRI indicators were analysed to values, principles and norms of ethical-social nature to this
verify which of the GRI indicators selected within the SGDs business theme. They discuss these values in relation to how
Compass Project were used. Indicators have been grouped
2 they govern their actions, fostering and strengthening com-
into 35 areas of action, which, in turn, constitute 16 business pliance with the legal system, respect for human dignity and
themes (see the methodological note for more details). An- corporate social responsibility. The other three themes are
alysing the most prominent business themes in the enter- more nuanced and the analysed organisations discuss partic-
prises’ sustainability reports provides more information about ular choices and actions to address those topics. Below, each
specific actions being taken to achieve the SDGs. of these three themes is discussed in more detail.
2
The SDG compass (www.sdgcompass.org) is a project jointly developed by the United Nations Global Compact and the GRI, together with the
World Business Council for Sustainable Development (WBCSD). It “provides guidance for companies on how they can align their strategies as
well as measure and manage their contribution to the realization of the SDGs”.
FIGURE 6. BUSINESS THEMES LINKED TO THE SDGS REPORTED IN THE SUSTAINABILITY REPORTS
Labour 36
Ethical and lawful behavior 35
Environment 34
Diversity and equal opportunity 34
Practices in the supply chain 29
Freedom of association and collective bargaining 29
Education 30
Economic impact 29
Anti-corruption 25
Compliance with laws and regulations 25
Effective, accountable and transparent governance 14
Inclusive decision making 14
Grievance mechanisms 13
Product and service information and labeling 12
Infrastructure investments 12
Possible negative impact 7
48 Top 300 and SDGsREPORT 2018
LABOUR
Although most of the organisations only provide a descrip- In addition to workplace safety, the organisations are com-
tion of the size of the workforce and its main characteris- mitted to the health and well-being of their employees in the
tics, their reports also emphasise occupational health and belief that prevention reduces illness and disease. In some
safety. All the organisations that reported on this area of cases, surveys were launched to monitor worker satisfaction
action have adopted procedures and management systems and working conditions, along with various health promotion
for the prevention, management and monitoring of occu- projects, such as medical care, sickness supplement and life
pational health that often exceed statutory requirements. insurance. Some of the enterprises do not stop at physical
well-being; they have moved to help their workers generate
Many of the organisations reviewed have formed committees overall psycho-physical well-being as proved, for example, by
on these topics. They tend to be responsible for sharing and the initiatives promoted by the Co-operative Group (UK)4. This
disseminating knowledge as well as evaluating and review- cooperative implemented a well-being strategy that includes
ing procedures. Employees are often involved in the definition health services, psychological support and confidential advice
and implementation of the procedures, as for example in the services.
case of Copersucar (Brazil), which conducted a survey of all
employees in 2015 to verify and improve their safety culture3.
3
http://www.copersucar.com.br/relatorio2016/english/?page_ 4
https://www.co-operative.coop/ethics/co-op-way-report-2016
id=161#cap7sec5
FIGURE 7. AREAS OF ACTION WITHIN THE LABOUR THEME REPORTED IN THE SUSTAINABILITY REPORTS
Employment size and characteristics 35
Occuparional health and safety 23
Eamings, wages and benefits 13
Labour/management relations 9
Abolition of child labour 6
Abolition of forced or compulsory labour 6
Top 300 and SDGs 49EXPLORING THE COOPERATIVE ECONOMY
LABOUR
A special focus
GRUPO SANCOR SEGUROS
Ensuring - and insuring - road safety
By Carla Ranicki
Total employees: Total members: Year founded:
2,965 5,000,000 1945
(insured clients)
Road safety is a big issue in Argentina, with traffic accidents companies, founded in 1945, with subsidiaries across Latin
the leading cause of death for people aged between 18 and America. It was one of the first in the country to start incorpo-
45. And deaths on the roads are on the rise, according to a rating SDGs into its business: when the SDGs were launched
report from the country’s Institute of Road Safety and Edu- in 2015, an initial analysis was carried out to identify which
cation (ISEV) last year. But one cooperative is working to cut goals were strategic to the cooperative and how they could
road mortality among its employees and client companies as be incorporated into its Corporate Social Responsibility (CSR)
part of a series of initiatives aimed at contributing to the UN’s process.
Sustainable Development Goal (SDG) 8: to ensure full and One of the targets relating to SDG 8 involves promoting safe
productive employment and decent work for all. and secure working environments for all workers. This is car-
Grupo Sancor Seguros is one of Argentina’s leading insurance ried out through risk assessment, training and innovative and
50 Top 300 and SDGsREPORT 2018
highly successful programs like Motivadores Viales (“road so important: “In several industries, when employees of our
motivators”), which is implemented both within the coopera- clients travel to and from work, accidents are very common.
tive and at client companies, particularly those with high rates Crashes are the biggest cause of deaths at work.”
of road accidents among their workers. She gives some examples of what the program involves: “We
“It’s a very important program because we can measure the give the employees a lot of training, and then we ask them to
impact before implementing the program and then a year af- sign a letter of commitment to use a helmet on motorbikes,
terwards and see what the results are,” says Betina Azugna, to wear seatbelts, to drive without using mobile phones.”
Grupo Sancor Seguros’s CSR/Sustainability Manager. “Among Another element of the program involves designating volun-
some of our clients, accidents and deaths from crashes go teers to look out for road safety among their colleagues and
down a lot – even as much as 20%.” She explains why this is to come up with action plans to improve safety and security
Top 300 and SDGs 51EXPLORING THE COOPERATIVE ECONOMY in their company. ter major accidents at client companies to provide emotional Another example of how Grupo Sancor Seguros is committed to support and minimize the risk of suicides and depression fol- improving working environments is through its labour risk insur- lowing traumatic events. “They act immediately, like an ambu- ance company, Prevención ART, which ensures safety for work- lance, to help workers return to their normal life,” she says. ers and economic stability for small- and medium-sized busi- Azugna says that Grupo Sancor Seguros goes above and be- nesses in the event of accidents at work. This is done through yond other insurance companies because of its cooperative consultancies at business premises or constructions sites by status. “We create these programs thinking about human be- risk assessors, regular medical check-ups to detect work-relat- ings and their good health. We always put the person first, ed diseases early and accident-prevention programs. because that is our philosophy, to work together and take care Azugna also mentions the Equipo de Intervención Psicosocial of everything that makes people sustainable citizens. It’s not (EIPS), the “catastrophe intervention team,” a group of highly about material benefits or income. It’s our philosophy. We get trained psychologists and social assistants who are sent in af- a lot of positive results being the way we are.” 52 Top 300 and SDGs
REPORT 2018

ENVIRONMENTAL SUSTAINABILITY
This is a key theme that includes a wide range of topics, above       carbon footprint of their activity.
all, related to energy efficiency, air quality and waste. The or-     The action of the cooperative enterprises is not limited to the
ganisations within this study mainly report on the amount of          adoption of measures to reduce energy consumption. Several
energy consumed and the production of greenhouse gas emis-            have engaged in activities to increase workers’ awareness of en-
sions and waste. More than half of the organisations also report      ergy consumption, and some have actively participated in energy
what steps they are taking to try to reduce these quantities.         redevelopment actions of the communities in which they are in-
Several actions have been undertaken to improve energy ef-            corporated. For example, Eandis (Belgium) actively participates
ficiency, ranging from the adoption of measures to reduce             in the energy care plan that was launched by the city of Ostend
energy consumption in buildings (such as the use of LED               in 2016 aiming at renovating eight buildings in the city making
bulbs and the improvement of thermal insulation) to the use           them energy-efficient5. Moreover, since 2016, DMK (Germany)
of renewable energy in production and the application of effi-        has been taking part in the “Kopernikus-Projekte für die Ener-
cient cooling of cold storage. With regard to the reduction of        giewende” research project6 in which scientists, private compa-
emissions, many of the participating organisations have set           nies and civil society are collaborating to develop technological
emission reduction targets by 2020 and most issue data on the         and economic solutions to convert energy systems.

5
    https://www.eandis.be/sites/eandis/files/documents/9010025_eandis_jaarverslag_en_mvo_2016_18_mei.pdf
6
    https://www.kopernikus-projekte.de/

FIGURE 8. AREAS OF ACTION WITHIN THE ENVIRONMENT THEME REPORTED IN THE SUSTAINABILITY REPORTS

                               Energy efficiency                                                                                         32
                                     Air quality                                                                                        31
                                          Waste                                                        20
                            Materials efficiency                                               16
                                      Transport                                           15
    Resource efficiency of products and services                                         14
                    Water quality and efficiency                                    13
Risks and opportunities due to climate change                                       13
                                    Biodiversity                         9
                                          Spills                 6
                      Enviromental investments              4

                                                                                                                     Top 300 and SDGs   53
You can also read