Energy Efficiency Trends and Policies In Industry - An Analysis Based on the ODYSSEE and MURE Databases
←
→
Page content transcription
If your browser does not render page correctly, please read the page content below
Energy Efficiency Trends and Policies
                      In Industry
  An Analysis Based on the ODYSSEE and MURE Databases

                                          September 2015

Energy Efficiency Trends and Policies in Industry          1
The sole responsibility for the content of this publication lies with the authors. It does not
necessarily reflect the opinion of the European Union. Neither the EASME nor the European
Commission are responsible for any use that may be made of the information contained
therein.

.

Energy Efficiency Trends and Policies in Industry                                          2
Energy Efficiency Trends and Policies in Industry 3
ACKNOWLEDGEMENTS

This publication was prepared within the ODYSSEE-MURE project coordinated by ADEME.

The project is financed under the Intelligent Energy Europe Programme with the support of 32 partners from
27 countries from EU Member States and Norway, generally with co-funding from their own governments. This
study would not have been possible without the active participation of the national teams and their associated
partners in terms of information supply.

This brochure was prepared by Barbara Schlomann, Matthias Reuter, Sohaib Tariq and Katharina Wohlfarth
from Fraunhofer ISI (Germany), who carried out the policy analysis, and Bruno Lapillonne and Karine Pollier
(Enerdata) who assessed the energy efficiency trends. Data on energy efficiency policy in Europe is from the
MURE database, led and co-ordinated by the Fraunhofer Institute for Systems and Innovation Research ISI
(Germany) and ISIS (Institute of Studies for the Integration of Systems, Rome). Data on energy consumption
and energy efficiency indicators come from the ODYSSEE database coordinated and managed by Enerdata.
Both data bases are updated by the different national participants of the project.

Particular thanks are due to Lea Gynther from Motiva Oy (Finland), Fabrice Conrod (My Energy, Luxemburg),
                                                                                                                   1
for their valuable commentsOur thanks also go to all the other participants in the ODYSSEE-MURE network :
ReinhardJellinek (AEA, Austria), Francis Altdorfer and Yvonne Baillot (Econotec, Belgium), Ludmil Kostadinov
(SEEA, Bulgaria), Alenka Kinderman and Damir Pezut (EIHP, Croatia), Kyriatos Kitsios (CIE, Cyprus), Jiri Spitz and
Jan Harnych (Enviros, Czech Republic), Jane Rusbjerg and Janne Wichard-Henriksen (DEA, Denmark), Gregory
Chedin, Elodie Trauchessec (ADEME, France), Minas Iatridis and Fotini Karamani (CRES, Greece), Martin Howley
and Denis Dineen (SEAI, Ireland), Giulia Iorio and Alessandro Federici (ENEA, Italy), Saara Elväs (MOTIVA,
Finland), Gaidis Klavs (IPE, Latvia), Inga Konstantinaviciute (LEI, Lithuania), Patrick Jung, Fenn Faber and Fabrice
Conrod (My Energy, Luxemburg), Godwin Sant, Simon Scicluna, Alan Bezzina and and Trustin Farrugia (MECW,
Malta), Joost Gerdes and Piet Boonekamp (ECN, the Netherlands), Harry Vreuls (NL Agency, The Netherlands),
Eva Rosenberg (IFE, Norway), RyszardWnuk (KAPE, Poland), GrazynaBerent-Kowalska and SzymonPeryt (GUS,
Poland), Susana Soares and Nuno Climaco (ADENE, Portugal), Iuliana Lazar (ANRE, Romania), Jan Magyar and
SlovamirCifra (SIEA, Slovak Republic), Fouad Al Mansour and Matjaz Cesen (JSI, Slovenia), Pilar de
ArribaSegurado (IDAE, Spain), Annika Persson, , Rebecka Bergström and Rurik Holmberg (STEM, Sweden), Jan
Rosenow (Ricardo-AEA, UK) and Stephen Oxley (DECC, UK).

Finally, we extend our thanks to Timothée Noel from the Intelligent Energy for Europe Programme (IEE) for his
support and belief in this project and his encouragement and advice.

Didier Bosseboeuf

Project leader

1
Alphabetic order of countries

Energy Efficiency Trends and Policies in Industry                                                               4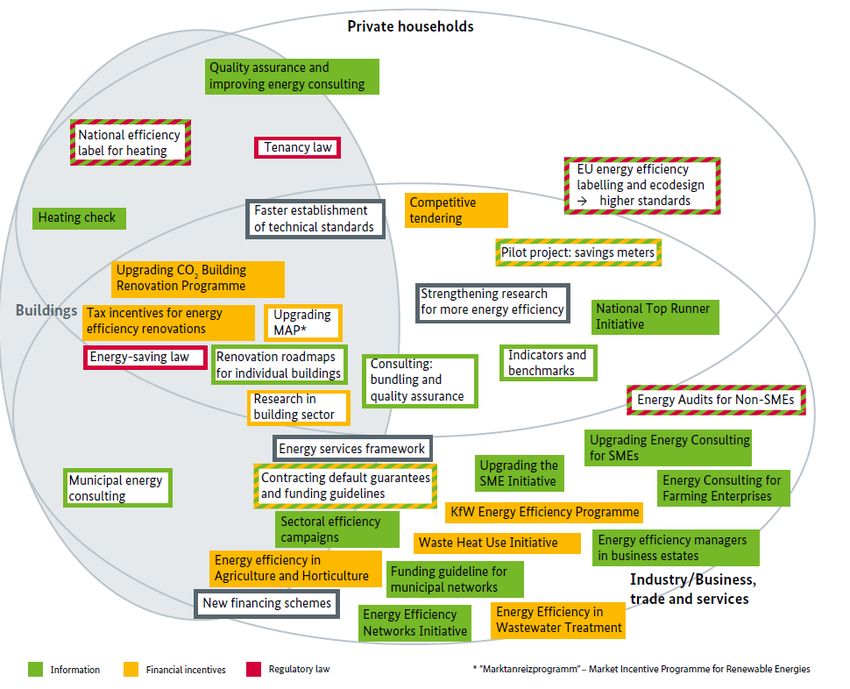
Energy Efficiency Trends and Policies in Industry 5
KEY MESSAGES
TRENDS
Industrial energy consumption has remained roughly stable at EU level between 2000 and
2007 and has decreased rapidly since then with a contraction twice faster than the industrial
activity.
As a result, industrial consumption was in 2013 17% below its 2000 level at EU level and only
represented 25 % of the energy used by final consumers, compared to 29% in 2000.
Between 2000 and 2007, the stability of consumption was the result of the balance between
the increase in industrial activity and energy savings.
Since 2007, more than half of the reduction in consumption was linked to the decrease in
industrial activity and only one fourth to energy savings.
Energy savings were 2.5 times lower since 2007 than over 2000-2007,as there has been a
much slower energy efficiency progress since the recession (0.9%/year since 2007 compared
to 1.9%/year before), because of a slower progress in most branches and even no more
improvement for some others (e.g. steel, cement, machinery). On average, energy efficiency
has improved by 1.4%/year in the EU since 2000.
This slower progress in energy efficiency is due to the recession, as the consumption did not
follow the reduction of activity, because, on the one hand the large equipment did not
operate at full capacity and were thus less efficient, and, on the other hand, part of the
consumption is not linked to the level of production.
The market share of electricity, biomass and heat in industry has progressed significantly (+4
points for electricity since 2000; +3 points each for biomass and heat).
Chemical industry is the main energy consuming branch with 19% of total industrial
consumption in 2013, followed by steel with 18%; while the share of chemicals is progressing
(+1.5 points at EU level since 2000), the share of steel is declining (- 2 points).
Since 2007 the energy consumption has decreased in all industrial branches: steel and non-
metallic minerals experienced the strongest reduction with consumption 25% lower in 2013
than in 2000.
POLICIES AND MEASURES
Financial measures are the by far dominating measure type in industry in almost all EU
Member States. Around half of the policies addressing energy efficiency in industry can be
attributed to this type. However, the new “Successful Policies” facility in MURE shows that in
many countries the remaining part of the the policies in place includes a broad mix of other
Energy Efficiency Trends and Policies in Industry 6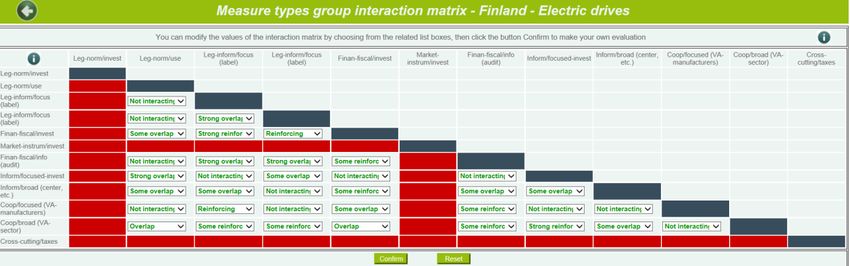
types (incl. new market-based instruments).
The financial crisis since mid 2008 did not considerably change the dominance of financial
measures. They are still dominating the policy mix and became even more important since
2013. Only in some countries which were hardest hit by the crisis (esp. Ireland, Portugal,
Italy, Spain and Greece), no or only very few new financial measures have been implemented
after 2008.
The Energy Efficiency Directive (2012/27/EU) also triggered new energy efficiency policies in
the Member States. With regard to industry, these are especially measures introduced under
Article 7 (energy efficiency obligations and/or alternative measures), mandatory audits
(Article 8) and new certification/qualification schemes. NEEAP measures, i.e. measures
reported in the NEEAP 1 and/or NEEAP 2 and/or NEEAP 3, constitute about 50% of the total
measures in the industrial sector in MURE.
There is no clear correlation between the impact level of the measures and the measure
types. Both high-impact and low-impact measures are of various types. Only informative
measures usually have a relative low impact and are mainly seen as accompanying measures
in a policy mix.
Energy audits and energy management can be seen as important instruments to recognise
and observe existing economic energy efficiciency potentials by systematic procedures to
gain knowledge and developing a strategy to achieve energy efficiency targets. Insofar they
play a crucial role in a policy mix for the industrial sector. One central element to wider
spread this kind of instruments in Europe is the implementation of Article 8 of the EED, which
is, however, delayed in several Member States. To the date of June 2015, some Member
States did not even deliver a national response to Article 8 to the European Commission.
While several energy efficiency measures are already in place for small and medium
enterprises (SMEs), more tailored programmes are needed to address their special needs.
The MURE database shows several best practice examples from countries where SMEs
already are an important target group for energy efficiency policies.
A suitable policy mix addressing energy efficiency in industry should both break down the
most important barriers which hinder the uptaking of energy efficiency measures in
companies (as e.g. information and knowledge deficits, several uncertainties, low priority
fore energy efficiency investment or high transaction costs), and make use of the driving
forces which facilitate the implementation of energy efficiency efficiency measures (as e.g.
positive image of energy efficiency, motivated employees). A suitable policy package for
industry should therefore comprise regulatory as well as the other incentivising instruments
(“stick and carrot”), where the regulatory instruments define the technological baseline. The
other instruments may then either encourage the investor to undertake measures complying
with this baseline or they may set incentives to even exceed the standards significantly and
make use of more advanced technologies.
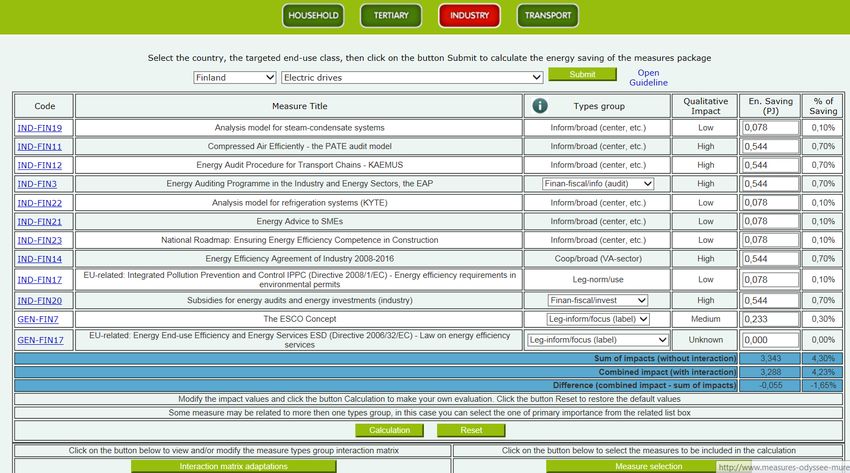
If this kind of policy package is designed for industry, a specific energy use in industry will
usually be targeted by several policy measures. In that case, measure interactions can occur,
Energy Efficiency Trends and Policies in Industry 7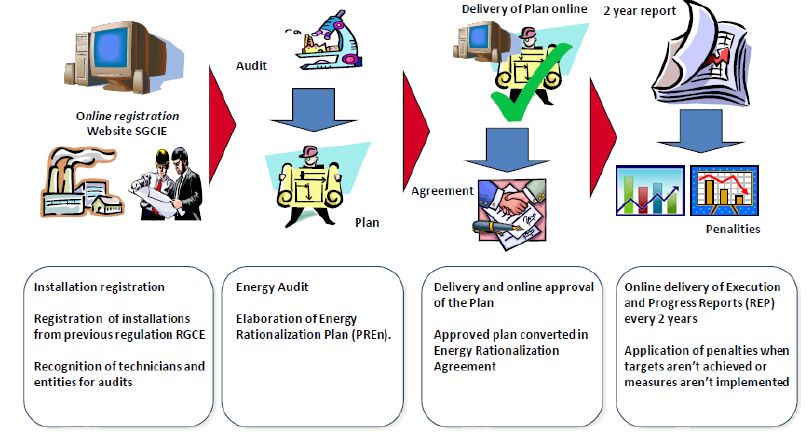
i.e. measures in the package may reinforce each other but they could also counteract against
         each other. These measure interactions have to be taken into account in order to assess the
         impact of the policy actions on the EU (or national) energy efficiency targets in a realistic
         manner. The new MURE “Policy interaction” facility provides a flexible tool to catch these
         impacts in a user-friendly way.

Energy Efficiency Trends and Policies in Industry                                                  8
Energy Efficiency Trends and Policies in Industry 9
CONTENT

ACKNOWLEDGEMENTS ........................................................................................................................4

KEY MESSAGES .....................................................................................................................................6

     Overall trends .........................................................................................................Erreur ! Signet non défini.

     Trends ......................................................................................................................................................... 6

     Policies and measures.................................................................................................................................. 6

CONTENT ............................................................................................................................................. 10

LIST OF FIGURES ................................................................................................................................ 12

LIST OF TABLES ................................................................................................................................. 13

LIST OF BOXES ................................................................................................................................... 14

INTRODUCTION ................................................................................................................................... 16

     Background................................................................................................................................................ 16

     Contents of the report ............................................................................................................................... 16

     The MURE and ODYSSEE databases ........................................................................................................... 16

1.       ENERGY EFFICIENCY TRENDS IN INDUSTRY IN THE EU ..................................................... 20

     1.1.         Trends in energy consumption and industrial activity .................................................................. 20

         1.1.1.       Energy consumption trends ...........................................................................................................20

         1.1.2.       Energy consumption and industrial growth ...................................................................................22

     1.2.         Energy efficiency trends ............................................................................................................... 27

         1.2.1.       Steel, cement and paper ................................................................................................................27

     1.3.         Impact of structural changes ........................................................................................................ 36

     1.4.         Drivers of energy consumption variation ..................................................................................... 39

     1.5.         CO2 emissions .............................................................................................................................. 40

2.       OVERVIEW OF ENERGY EFFICIENCY POLICIES IN THE INDUSTRIAL SECTOR ................ 43

     2.1.         Policies at the European level ...................................................................................................... 44

         2.1.1.       Emissions Trading Directives ..........................................................................................................44

         2.1.2.       Energy Efficiency Directive .............................................................................................................45

         2.1.3.       Eco-Design Directive.......................................................................................................................46

Energy Efficiency Trends and Policies in Industry                                                                                                               10
2.1.4. Renewable Energy Directive ..........................................................................................................48
2.1.5. Industrial Emissions Directives .......................................................................................................49
2.2. Overview of policies by Member States ....................................................................................... 51
2.2.1. Measures by Type ..........................................................................................................................51
2.2.2. Role of NEEAP Measures ................................................................................................................53
2.2.3. Measures by Impact .......................................................................................................................55
3. SPECIFIC POLICY ISSUES IN THE INDUSTRIAL SECTOR FROM A EUROPEAN AND
NATIONAL PERSPECTIVE .................................................................................................................. 58
3.1. Dynamics and innovation of policy development in the industrial sector .................................... 58
3.2. The role of energy management in industry ................................................................................ 63
3.2.1. Article 8 Energy Efficienc Directive.................................................................................................66
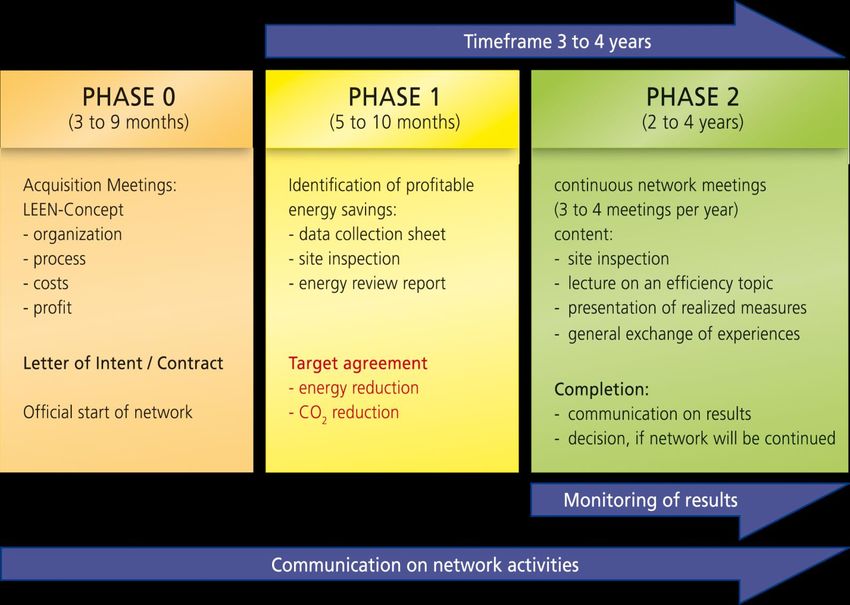
3.2.2. Learning Energy Efficiency Networks .............................................................................................67
3.3. Policies for specific target groups in industry – Small and Medium Enterprises (Smes) ................ 69
3.4. Policies for specific target groups in industry - the energy-intensive industry ..................................... 71
4. DESIGNING AN EFFECTIVE ENERGY EFFICIENCY POLICY MIX FOR THE INDUSTRIAL
SECTOR ................................................................................................................................................ 73
4.1. Barriers to energy efficiency and the role of policy packages ....................................................... 73
4.2. how the MURe database can help to design suitable policy packages for Industry ...................... 75
4.3. Case study: the german “national Energy efficiency action plan” (NAPE) ..................................... 77
BIBLIOGRAPHY ................................................................................................................................... 79
Energy Efficiency Trends and Policies in Industry 11LIST OF FIGURES Figure 1 : The new ODYSSEE and MURE support tools for indicator and policy analysis ..................................... 18 Figure 2: Energy consumption trends and activity in industry in the EU .............................................................. 20 Figure 3: Share of industry in total final energy consumption .............................................................................. 21 Figure 4: Energy mix in the industrial sector in the EU ......................................................................................... 21 Figure 5: Effect of the electrification in industry................................................................................................... 22 Figure 6: Trends in industrial activity .................................................................................................................... 23 Figure 7: Trends in the energy intensities of industry .......................................................................................... 24 Figure 8: Distribution of energy consumption by industrial branch in the EU ...................................................... 25 Figure 9: Share of industrial energy consumption by branch in EU countries (2012) ........................................... 25 Figure 10: Energy consumption trends by industrial branch (EU) ........................................................................ 26 Figure 11: Electricity consumption trends by industrial branch in EU .................................................................. 26 Figure 12: Specific energy consumption per tonne of steel.................................................................................. 28 Figure 13: Energy consumption per tonne of steel and process mix (2012) ........................................................ 29 Figure 14: Trends in the specific consumption of cement in EU countries ........................................................... 30 Figure 15: Energy consumption per tonne of cement produced .......................................................................... 31 Figure 16: Trends in the energy consumption per tonne of paper ....................................................................... 32 Figure 17: Specific energy consumption in the pulp and paper industry.............................................................. 33 Figure 18: Energy efficiency index in industry (EU) ............................................................................................... 34 Figure 19: Energy efficiency trends in industry in EU countries (%/year) ............................................................. 34 Figure 20: Energy savings in industry (EU) ............................................................................................................ 35 Figure 21: Energy consumption and energy savings in industry (EU .................................................................... 35 Figure 22: Energy intensities of manufacturing branches (machinery =1) (2012) ................................................ 36 Figure 23: Intensity trends and structural changes in industry and manufacturing (EU) ..................................... 37 Figure 24: Changes in the value added structure of manufacturing (2007-2012) ................................................ 38 Figure 25: Impact of structural changes in manufacturing on energy intensity (2007-2012)............................... 39 Figure 26: Drivers of the industry’s energy consumption variation (2000-2012) ................................................. 39 Figure 27: Drivers of industry consumption variation: before and after the crisis ............................................... 40 Energy Efficiency Trends and Policies in Industry 12
Figure28: CO2 emissions of industry from fuel combustion.................................................................................. 41

Figure 29: CO2 emissions of industry from fuel combustion (%) .......................................................................... 41

Figure 30: Share of direct and indirect CO2 emissions (2012) .............................................................................. 42

Figure 31: Overview of industry measures in MURE ............................................................................................. 43

Figure 32: Ongoing measures by type and by country in industry ....................................................................... 51

Figure 33: Pattern of measures in industry by type and period of introduction .................................................. 52

Figure 34: NEEAP measures by country and status .............................................................................................. 53

Figure 35 : NEEAP measures in industry by country and by type ......................................................................... 54

Figure 36: Distinction of NEEAP 1, 2 and 3 measures in industry ......................................................................... 54

Figure 37 : NEEAP-3 measures in industry by country and by type ...................................................................... 55

Figure 38: Measures with quantitative impact by country ................................................................................... 56

Figure 39: Measures with the semi-quantitative impact for each country........................................................... 57

Figure 40: Levels of semi-quantitative impact evaluation by measure type ........................................................ 58

Figure 41: Measures added during the economic crisis (2008-2012) by type ...................................................... 59

Figure 42: Measures added since 2013 (after the financial crisis) ........................................................................ 59

Figure 43: Successful measures in industry by country ........................................................................................ 60

Figure 44 : List of successful policies by country and total average score ............................................................ 61

Figure 45: Energy management policies by county .............................................................................................. 64

Figure46: LEEN network process ........................................................................................................................... 68

Figure 47 : Policies in the MURE database addressing SMEs ................................................................................ 70

Figure 48 : Interaction matrix for measures addressing electric drives ................................................................ 75

Figure 49 : Assessment of the policy interaction– Example : measures addressing electric drives in Finland ..... 76

Figure 50 : Policy mapper – Example : measures addressing several targeted end-uses in industry in Poland ... 77

Figure 51 : Measures of NAPE for buildings, private househols and industry ...................................................... 78

 LIST OF TABLES

[to be added Enerdata

Energy Efficiency Trends and Policies in Industry                                                                                                      13
LIST OF BOXES

Box 1.2: The MURE database ................................................................................................................................ 17

Box 1.1: Business cycles strongly influence short-term energy intensity variations ............................................ 24

Box 2.1: Emissions Trading Directive – Examples for National Implementation .................................................. 44

Box 2.2: Provisions for the industrial sector in the EED ........................................................................................ 46

Box 2.3: Denmark: Renewable energy for production processes (Industry) ........................................................ 49

Box 2.4: Integrated Pollution Control UK .............................................................................................................. 50

Box 2.5: Definition of the semi-quantitative impact in Mure ............................................................................... 56

Box 3.1: Portugal – SGCIE: INTENSIVE ENERGY CONSUMPTION MANAGEMENT SYSTEM ................................... 65

Energy Efficiency Trends and Policies in Industry                                                                                                       14
Energy Efficiency Trends and Policies in Industry 15
INTRODUCTION

The objective of this brochure is to analyse energy efficiency in the industrial sector. The analysis includes both
a review of energy efficiency trends and of the policy instruments currently implemented to improve energy
efficiency in this based on the ODYSSEE and MURE databases.

BACKGROUND

The industrial sector accounts for around 26% of total final energy consumption in the EU-28 in 2012. Though
industry is only the third-largest end-use sector in the EU after buildings with a share of 40% and transport with
32% , in some countries with more energy-intensive industries, such as Austria, Germany, Czech Republic, or
Sweden, the share varies between 30 and around 35%. In Finland and Slovakia, industry contributes with more
than 40% to total final energy consumption.

With the Energy Efficiency Directive from 2012 (2012/27/EU) the Member States are obliged to meet their
national energy efficiency target set in Article 3 EED and the 1.5% energy saving target from Article 7 of the
EED. In order to achieve these targets, usually all end-use sectors have to contribute to these targets, also
industry. The EED also includes specific regulations for this sector, especially Article 8 on energy audits. The
achievement of the new 2030 target for energy efficiency, which prescribes a reduction of primary energy
consumption by 27% compared to a reference development, will also need contributions from all end-use
sectors.

At the level of the EU, the industrial sector is regulated by the EU Emission Trading System (ETS). At the
national level, the policy mix addressing the industrial sector is dominated by financial instruments to support
investment in energy-efficient technologies. More recently, the role of energy management also became
important and was more and more addressed by national policies and by the EED.

CONTENTS OF THE REPORT

The first part of this report is dedicated to energy efficiency indicators. It analyses the main trends in energy
consumption and energy efficiency since 2000 based on data and indicators from the ODYSSEE database
(Chapter1).

The second part of the report deals with energy efficiency policies, starting with an overview of the main EU
regulations addressing the industrial sector (Chapter 2.1). Afterwards, an overview of the main national energy
efficiency policies is given (Chapter 0). The main focus is on the policies which were reported by the Member
States in the National Energy Efficiency Action Plans (NEEAPs) under the Energy Efficiency Directive (EED).

In the following Chapter 3 we discuss specific topics which are relevant in the industrial sector. These include
the dynamics and innovation of policies, the growing importance of energy management and the role of
policies for specific target groups as e.g. small and medium enterprises (SMEs) or the energy intensive industry.

The focus of the final Chapter 4 is on the design of a suitable policy mix for the industrial sector. Here we
discuss issues as e.g. the role and non-economic barriers in industry and the importance of policy interaction.

THE MURE AND ODYSSEE DATABASES

Both databases are regularly updated by a network of national correspondents from all EU Member States,
generally from the energy efficiency agencies. They are managed by a technical coordination, namely Enerdata
for ODYSSEE and Fraunhofer-ISI and ISIS for MURE. The two databases can be accessed at http://www.odyssee-

Energy Efficiency Trends and Policies in Industry                                                             16
mure.eu/.
BOX 1.1: THE ODYSSEE DATABASE
The ODYSSEE database contains detailed energy efficiency and CO2-indicators, about 180
indicators with data on energy consumption by sector and end-uses, their activity drivers and
their related CO2-emissions, about 600 dataseries.The ODYSSEE database provides a
comprehensive monitoring of energy efficiency trends in all the sectors and priority areas to
address EU policies. The database contributes to the development of a monitoring
methodology based on top-down assessment of energy savings, through different types of
indicators:
Energy and CO2 intensities, that relate the energy used (or CO2 emissions) by sector to
macro-economic variables (GDP, value added, …)
Specific energy consumption (or CO2 emissions) (e.g. consumption per ton of steel, per
car or per dwelling, gCO2/km)
Adjusted intensities to allow the comparison of intensities (adjustments for differences in
climate, general price level , fuel mix, industry and economic structure…)
Indicators of diffusion that monitor the diffusion of energy efficient technologies and
practices Benchmark indicators compare specific energy consumption among countries
and with reference values
An energy efficiency index (ODEX) for assessing energy efficiency progress and energy
savings by main sector (industry, transport, households, tertiary) and for the whole
economy (all final consumers).
BOX 1.2: THE MURE DATABASE
The MURE database provides an overview of the most important energy efficiency policy measures in
the EU Member States, Norway, Croatia and the EU itself. The da-tabase is structured by final energy
consumption sectors (household, tertiary, industry, transport) and also includes a general cross-
cutting section. At the level of sectors, the focus is on single policy measures in order to allow a
specific analysis of each measure. More general programs comprising several measures are mainly
described in the cross-cutting section of MURE. The homogeneity of the measure descriptions over
sectors and countries is ensured by detailed guidelines. All measures are classified according to
specific keywords, thus allowing queries based on criteria as e.g.:
their status (completed, on-going or planned);
their year of introduction and completion;
their type: legislative/normative (e.g. standards for new dwellings), legisla-tive/informative (e.g.
obligatory labels for appliances), financial (e.g. subsidies), fiscal (e.g. tax deductions),
information/education, cooperative (e.g. voluntary agreements) and taxes (on energy or CO2-
emissions);
the targeted end-uses and the main actors involved by the policy measures;
Energy Efficiency Trends and Policies in Industry 17 their semi-quantitative impact: low, medium or high impact, based on quantitative evaluations
or expert estimates;
the end-uses involved and the quantitative impact of the policy measure related to a specific
end-use (if this information is available).
In order to allow a separate analysis of policy measures from specific sources, two ad-ditional
categories have been added to the MURE database:
If a measure is included in the National Energy Efficiency Action Plan under the for-mer EU
Energy Efficiency and Service Directive ESD (2006/32/EC) and the Energy Efficiency Directive
(2012/27/EU, EED) respectively, it is classified as “NEEAP measure” in the MURE database. A
distinction is also made between the 1st, 2nd and 3rd NEEAPs and the reporting on energy
efficiency obligation schemes and alternative measures under Article 7 of the EED. This allows an
easy identification of policy measures reported in the NEEAPs and under Article 7 EED and a
specific analysis of these policies.
In order to separate of EU-wide measures which are common to all countries (mainly EU
Directives) from pure national measures, a set of “EU measures” was defined in the MURE
database.
In addition, for each policy measure a detailed description is available in the MURE database.
In order to make the use of these database easier and to enable the user to make its own analysis of indicators
and policies, several support tools have been developed during the last 2 years (see Figure 1). Apart from the
two databases themselves, these tools will be the main analytical basis for this brochure.
Figure 1 : The new ODYSSEE and MURE support tools for indicator and policy analysis
ODYSSEE tools for Monitoring the progress Change in energy
indicator analysis: in the market penetration consumption in a given
of energy-efficient period is explained by
technologies various drivers (e.g.
activity, structure,
behaviour, efficiency)
Comparison of the Compilation of historical Assessing and scoring
performance of one data, targets and the energy efficiency
country with selected projections for energy performance by sector
others by adjusted consumption and energy and country.
indicators savings.
Energy Efficiency Trends and Policies in Industry 18MURE tools for Enables to query policies Aims at identifying
policy analysis: by selected topics (e.g. successful and
Buildings, SMEs, energy promising energy
management, consumer efficiency policies in the
behaviour). Member States based on
a set of clearly defined
criteria.
Enables to characterize Visualization of all policies Assessing and scoring
packages of policies and aiming at a given end-use energy efficiency policies
their interaction. and related energy by sector and country.
efficiency indicators.
Source: MURE database
Energy Efficiency Trends and Policies in Industry 191. ENERGY EFFICIENCY TRENDS IN INDUSTRY IN THE EU
1.1. TRENDS IN ENERGY CONSUMPTION AND INDUSTRIAL ACTIVITY
1.1.1. ENERGY CONSUMPTION TRENDS
Industrial energy consumption in 2013 17% below its 2000 level
The energy consumption of industry has been decreasing almost twice faster than the industrial value added at
EU level since 2007 (by respectively 2.6% and 1.5%/year); there was a significant drop in consumption in 2009
(-15%) linked to the deep industrial recession (-13%) followed by a significant rebound in 2010 (+8%) (Erreur !
Source du renvoi introuvable.). Before 2007, energy consumption was strongly decoupled from the industrial
activity, with a slight decrease of consumption (-0.3%/year), while industrial growth reached almost 2%/year.
2
As a result, the energy consumption of the industrial sector was in 2013 17% below its 2000 level.
Electricity consumption was more or less following the same trend as total energy consumption since 2007,
while it was increasing regularly before, by around 1.2%/year. This progression was however almost twice
slower than the industrial activity, thus reflecting also a decoupling between electricity use and industry
activity.
Figure 2: Energy consumption trends and activity in industry in the EU
120
110
100
90
80
70
2000 2002 2004 2006 2008 2010 2012
Total consumption Electricity consumption Value Added
Source: Eurostat
As a result of these trends, the industrial sector is consuming a decreasing share of the energy used by final
consumers in the EU, from 29% in 2000 to 25 % in 2013. In five countries (Austria, Germany, Latvia, Malta and
Slovakia), the share of industry has however increased. Large discrepancies exist among countries as to the
importance of the industrial sector: it absorbs almost half of the consumption in Finland, between 30 and 40%
in Norway, Austria, Belgium, the Czech Republic, Romania, Sweden or Slovakia, but only 15 to 20% in Denmark
Greece or UK (Figure 4).
2
Industrial energy consumption includes manufacturing industry, construction and non-energy mining; it excludes the
energy used for non-energy uses (e.g. gas or naphtha used as feedstock in petrochemicals).
Energy Efficiency Trends and Policies in Industry 20Figure 3: Share of industry in total final energy consumption Source: ODYSSEE from Eurostat; total final energy consumption at normal climate Significant progression of the market share of electricity, biomass and heat in industry Natural gas and electricity are the dominant sources of energy for industry with respectively 32 % and 31% of the market in 2012 (Figure 4). Electricity has experienced a rapid growth between 2000 and 2012 (+4 points), as biomass and heat (+3 points each). The contribution of all fossil fuels has decreased: -2 points for natural gas and coal (including lignite) and -5 points for oil. Figure 4: Energy mix in the industrial sector in the EU Source: ODYSSEE from Eurostat A small part of the progression in the market share of electricity is linked to substitution of fuels by electricity: if electricity share had remained constant, the electricity consumption would have been 9% lower than the Energy Efficiency Trends and Policies in Industry 21
level observed in 2012, i.e. 76 Mtoe instead of 84 Mtoe (Figure 5). This means that substitution explains 9% of
the electricity consumption in 2012.

Figure 5: Effect of the electrification in industry

Source: ODYSSEE

       1.1.2. ENERGY CONSUMPTION AND INDUSTRIAL GROWTH

Industrial recession in most countries since 2007

Since 2007, most EU countries have been hit by an industrial recession, except 5 countries (Poland, Slovakia,
Romania, Estonia and the Czech Republic (Figure 6). At EU level, industrial activity contracted by an average of
1.5%/year between 2007 and 2013. This contrasts deeply with the period 2000-2007 when industrial growth
averaged 1.9%/year.

Energy Efficiency Trends and Policies in Industry                                                            22
Figure 6: Trends in industrial activity
10% 2000-2007 2007-2013
8%
6%
4%
%/year
2%
0%
-2%
-4%
-6%
-8%
-10%
Malta
Spain
Cyprus
Portugal
Hungary
EU
UK
Latvia
Poland
Slovakia
Netherlands
France
Denmark
Ireland
Slovenia
Italy
Finland
Croatia
Greece
Romania
Austria
Germany
Bulgaria
Sweden
Luxembourg
Estonia
Czech Rep.
Belgium
Lithuania
Source: ODYSSEE
Impact of the crisis on the energy intensity trend observed in three fourth of countries
Until 2007, the energy consumption grew less rapidly than the value added in all countries, which was reflected
by an intensity decrease everywhere (Figure 7).
In 11 countries and at EU average, the intensity continued to decrease after 2007, but at a much slower rate
(1.1%/year compared to 2%/year before), and in 10 countries the intensity trend has reversed: in other words,
the recession had an impact on the energy intensity trend of industry in three fourth of countries. This break in
historical trends is mainly explained by the fact that energy consumption did not follow the reduction in energy
consumption during the recession because of lower efficiency (see Box). In 7 countries, however, the
decreasing trend accelerated after 2007, generally in countries with an industrial growth.
Energy Efficiency Trends and Policies in Industry 23Figure 7: Trends in the energy intensities of industry
Acceleration of energy Slower intensity
4% intensity decrease
Intensity increase
decrease
2% %/year
0%
-2%
-4%
-6%
2000-2007 2007-2013
-8%
Latvia
Norway
Estonia
Spain
Lithuania
Portugal
UK
Greece
Hungary
Finland
Poland
Slovenia
Italy
Netherlands
EU
Ireland
France
Romania
Croatia
Denmark
Germany
Bulgaria
Belgium
Cyprus
Luxembourg
Austria
Sweden
Czech Rep.
Slovakia
Source: ODYSSEE
BOX 1.1: BUSINESS CYCLES STRONGLY INFLUENCE SHORT-TERM ENERGY INTENSITY
VARIATIONS
The energy intensity in industry branch tends to decrease less (or even increase) in a period of recession for
two reasons:
First of all, process energy does not decrease proportionally to the activity as the efficiency of equipment
drops if it is not used at full capacity.
Secondly, part of the energy consumed is independent of the production level (e.g. heating and lighting): if
production declines, only the former part of consumption decreases, but not proportionally: as a result,
the energy consumed per unit of production tends to increase.
Chemical industry is the main energy consuming branch
The chemical industry is now the main energy consuming branch with 19% of total energy consumption of
industry in 2013 in the EU (+1.5 points compared to 2000) (Figure 8). Steel arrives in second position with 18 %,
followed by non-metallic minerals and paper (12% each), and food (10%). The share of chemicals, paper and
food is increasing (around 1.5 percentage points more), while the share of steel is declining (- 2 points).
The share of all energy-intensive branches (steel, chemicals, non-metallic minerals, non-ferrous and pulp and
paper) in industrial energy consumption is quite stable and represents two thirds of the industrial
consumption.
The breakdown of energy consumption by branch varies widely across countries: pulp and paper industry plays
the dominant role in Finland and Sweden (more than 50% of the consumption), whereas it is chemicals in the
Netherlands (around 40%), non-metallic minerals in Cyprus (64%), Croatia and Portugal (around 30%), steel in
Slovakia and Luxembourg (above 50%) and food in Ireland and Croatia (20%) (Figure 9).
Energy Efficiency Trends and Policies in Industry 24Figure 8: Distribution of energy consumption by industrial branch in the EU
2000 3% 1%
2%2% 2013
3% 2%
4% 3% 2% 1%
18% 3%
3%
19%
8%
7%
6%
20%
7%
9% 18%
10%
11% 13%
12% 12%
Chemicals Iron and steel Non metallic minerals
Paper Food Machinery
Other manufacturing Non ferrous Transport vehicles
Wood Construction Textile
Source: ODYSSEE from Eurostat
Figure 9: Share of industrial energy consumption by branch in EU countries (2012)
Increasing share of energy intensive branches
100%
90%
80%
70%
60%
50%
40%
30%
20%
10%
0%
Netherlands
Malta
Latvia
Estonia
Lithuania
Spain
Greece
UK
EU
Portugal
Finland
Denmark
Croatia
Ireland
France
Slovenia
Italy
Germany
Poland
Romania
Cyprus
Austria
Bulgaria
Belgium
Norway
Sweden
Luxembourg
Czech Rep.
Slovakia
wood others food machinery
transport equipment textile paper non metallic
steel non ferrous metals chemicals
Source: ODYSSEE
Reduction of the energy consumption in all industrial branches since 2007
The energy consumption decreased in all industrial branches since 2007, and even since 2000 for steel, food,
non-ferrous, transport equipment and textile. Steel and non-metallic minerals experienced the strongest
reduction: their consumption was around 25% lower in 2013 than in 2000 (Figure 10).
Energy Efficiency Trends and Policies in Industry 25Figure 10: Energy consumption trends by industrial branch (EU)
70
60
50 2000 2007 2013
40
Mtoe
30
20
10
0 food
chemicals
equipment
wood
textile
mining
non metallic
paper
machinery
non ferrous
non-specified
construction
transport
steel
minerals
Source: ODYSSEE from Eurostat
Since 2007, electricity consumption has also decreased in all industrial branches. It had increased before in
most industrial branches. Chemicals industry is the largest electricity intensive branch (18%), followed by
paper, steel and machinery (12% each) (Figure 11). Electricity has a market share above 50% in three branches:
non-ferrous (57%), machinery and transport vehicles (53%).
Figure 11: Electricity consumption trends by industrial branch in EU
200
180
160 2000 2007 2013
140
120
TWh
100
80
60
40
20
0
Machinery
Steel
Food
Paper
Transport
Wood
Textile
Construction
Non metallic
Non-ferrous
Chemicals
Non-specified
vehicles
Source: ODYSSEE from Eurostat
Energy Efficiency Trends and Policies in Industry 261.2. ENERGY EFFICIENCY TRENDS
1.2.1. STEEL, CEMENT AND PAPER
3
This section gives a special focus to three energy intensive branches, steel, cement and paper , as these
branches represent around 40% of the energy consumption of industry and have a large impact on the energy
efficiency trends in industry. For these three branches, energy efficiency is captured by an indicator of specific
consumption per tonne produced. Because of the impact of the economic crisis, trends will be analysed for two
periods: 2000 -2007, i.e. before the crisis and the start of the recession, and 2007-2012.
As explained in Box 1, there is usually a loss of efficiency in a recession period, as the consumption does not
follow the reduction of activity, because, on the one hand the large equipment, such as kilns, boilers or motors,
do not operate at full capacity and are thus less efficient, and, on the other hand, part of the consumption is
not linked to the level of production. As a result the specific energy consumption often increases during a
recession.
Decreasing specific energy consumption per tonne of steel until 2007
Until 2007, the average specific consumption per tonne of steel has been decreasing in most countries (by
2.2%/year at EU level) (Figure 12). Since 2007, there has been a slight increase in this specific consumption in
half of countries and at EU level (by 0.5%/year for the EU average). This deterioration of energy efficiency since
2007 is mainly explained by a lower rate of utilisation of the steel factories. In some EU countries however, this
specific consumption has still been decreasing (e.g. Poland, Belgium, France, Romania and the Czech Republic),
4
as a result of an increased penetration of electric steel, the less energy intensive process , and the closure of
old and less efficient steel mills.
3
Steel refers here to the branch “iron and steel” and paper to the branch “pulp, paper and printing”.
4
The electric process, in which steel is producedby melting iron scraps in an electric furnace requires 2 to 3 times less
energy than the oxygen process, which uses pig iron produced in a blast furnace(this is only true if electricity is converted in
toe on the basis of the calorific value of electricity, which is done here and by Eurostat).
Energy Efficiency Trends and Policies in Industry 27Figure 12: Specific energy consumption per tonne of steel5
0,7
2000 2007 2012
0,6
toe/t
0,5
0,4
0,3
0,2
0,1
0,0
US
UK
Italy
Austria
Canada
Poland
Spain
EU
France
Netherlands
Romania
Belgium
South Korea
Sweden
Australia
Finland
Japan
Germany
Slovakia
Czech Rep.
Source: Odyssee for EU countries and Norway, IEA for the other countries
The specific energy consumption per tonne of steel depends on the process mix
As the oxygen process requires 2 to 3 times more energy than the electric process, it is important, when
comparing the average specific energy consumption per tonne of crude steel among countries, to take into
account the “process mix” (i.e. the relative share of the two processes).
Figure 13: Energy consumption per tonne of steel and process mix (2012) compares the specific consumption
per tonne of steel in relation to the share of electric steel in total crude steel production. The vertical distance
from the world benchmark (shown by the red line) shows the possible improvement with the present process
mix. The distance to the 100 % electric process shows the potential theoretically open to process substitution.
In reality, this might be restricted by the availability of iron scrap and quality requirements of the steel
produced.
Benchmarking of countries should be done at similar process mix: for instance, for countries in a range of 30-
35% share of electric steel, Belgium represents the benchmark countries.
5
Only countries with production > 4 Mt are shown.
Energy Efficiency Trends and Policies in Industry 28Figure 13: Energy consumption per tonne of steel6 and process mix (2012)
0,5
toe/t
Czech Rep Japan Finland
0,4
Netherlands Sweden
France Canada
0,3 Best Germany Korea EU US
oxygen Italy
process Slovenia
0,2 Belgium Poland
0,1 Portugal
Best electric
0,0 process
0% 20% 40% 60% 80% 100%
% electric steel
Source: Odyssee for EU countries and Norway, IEA for the other countries
Cement production is now less efficient than before the crisis at EU level and in half of the countries
Cement is made from the mixture of clinker and additives; the ratio clinker/ additive can vary with the quality
of cement (typically 80% clinker and 20% additive, but can go up to 95% clinker and 5% additive). Most of the
energy consumption occurs during the fabrication of clinker in high temperature kilns, and not for producing
cement itself, which consists of grinding clinker with additives (e.g. ashes). The higher the ratio clinker/cement,
the more energy is required to produce one tonne of cement. In addition countries can produce all the clinker
they need for their cement production or can import part of it or export their surplus. Importing clinker will, all
things being equal, decrease the specific consumption per tonne of cement. On the other hand countries
exporting clinker will have a specific consumption per tonne of cement higher than if they were only producing
for their own needs.
Trends in the specific energy consumption per tonne of cement are therefore influenced by two main factors:
the efficiency of clinker kilns and cement grinding, on the one hand, and the ratio between the clinker and
cement production, on the other hand.
This specific consumption was higher in 2012 than in 2007 in 6 countries and at EU level (Figure 14). Such a
trend is first of all explained by a deterioration of energy efficiency, especially significant in countries with a
deep recession with plants operating at low capacity (e.g. Spain and Portugal, with a drop in production of 70%
and 44% respectively). It also linked to an increase in the ratio production of clinker/cement: this is the case in
Portugal and Spain where, because of the contraction of the domestic market, they increased significantly their
6
Differences among countries may also arise from the fact that the energy consumption covers the whole iron and steel
industry, not only the steel plants but also sintering, rolling mills, reheating furnaces.
Energy Efficiency Trends and Policies in Industry 29exports of clinker (the ratio clinker/cement production increased from 59% to 105% in Spain and from 87 to
94% in Portugal).
The specific consumption per tonne of cement has kept decreasing in 7 countries and remained stable in 3
others. This reduction reflects energy efficiency improvements but reflect as well, for some countries a
decrease in the ratio clinker/cement production linked to increased imports of clinker and more additives in
cement (e.g. in Germany, Austria, Poland).
Figure 14: Trends in the specific consumption of cement in EU countries
0,16
2000 2007 2012
0,14
0,12
0,10
toe/t
0,08
0,06
0,04
0,02
0,00
UK
Greece
Netherlands
Italy
France
Poland
EU
Spain
Austria
Cyprus
Hungary
Croatia
Belgium
Sweden
Norway
Portugal
Germany
Source: Odyssee
Comparisons of energy efficiency for cement should take into account the ratio of clinker to cement
production
Differences between countries in the average energy consumption per tonne of cement not only reflect
different levels of energy efficiency, but also differences in the ratio clinker to cement production, i.e. in the
7
composition of cement (% of additives) and in the share of clinker produced in the country .Therefore, cross
countries comparisons should take into account the ratio of clinker produced to cement production, as shown
in Figure 15. Distance to the red line (which represents the world best practice) indicates the potential of
energy efficiency improvements. For countries with a similar share of clinker, the country with the lowest
values represents the benchmark: for instance, Germany for countries in the range 70-80%.
7
Low values may be also due to the fact that for some countries energy consumption of non-conventional fuels (biomass,
wood, tyres...) is not well known.
Energy Efficiency Trends and Policies in Industry 30Figure 15: Energy consumption per tonne of cement produced
0,12
toe/t UK
Norway
0,10 Belgium
Poland Sweden
Portugal
Italy EU Cyprus
0,08 Austria
Spain France
World Germany
0,06
best
practive
0,04
0,02
0,00
40% 50% 60% 70% 80% 90% 100%
Ratio clinker / cement production
Source: ODYSSEE
The specific energy consumption per tonne of paper is generally decreasing
The energy consumption of pulp, paper and printing per tonne of paper has been generally decreasing in
almost all countries since 2000 (-0.5%/year at EU level over the period 2000-2012) (Figure 16). Finland and
Spain experienced the largest reduction, by more than 3%/year since 2000.
Differences among countries depend on the level of pulp production. Countries which are exporting pulp, such
as Sweden and Finland, have the highest values.
Energy Efficiency Trends and Policies in Industry 31Figure 16: Trends in the energy consumption per tonne of paper8
0,7
2000 2007 2012
0,6
toe/t
0,5
0,4
0,3
0,2
0,1
0,0
UK
Netherlands
Italy
EU
France
Spain
Poland
Austria
Sweden
Finland
Germany
Source: ODYSSEE
The energy performance of pulp and paper depends on the production of pulp
To explain the differences observed in Figure 16, it is necessary to take into account how the paper is
9
produced. Paper is produced from raw pulp or from recycled paper. Pulp production is energy-intensive. The
pulp used in a given country may be produced in the country itself or be imported from other countries. If it is
imported, this means that the energy consumption for pulp production has taken place in the exporting
countries. Therefore, the energy performance of the paper industry of a given country is linked to the share of
pulp produced in the country in relation to the paper production: the higher this ratio, the higher the specific
consumption per tonne of paper. Energy efficiency performance can only be benchmarked among countries
with a similar ratio of pulp/paper production. In countries exporting a large production of pulp (i.e. Finland,
Sweden and Norway), Norway has the best performance: this may is due to a higher penetration of electricity
use (around 60% in Norway, compared to 30% in Finland and Sweden), partly linked to a higher production of
mechanical pulp.
8
Only countries with a production over 2 Mt are shown.
9
Pulp includes chemical and mechanical pulp.
Energy Efficiency Trends and Policies in Industry 32Figure 17: Specific energy consumption in the pulp and paper industry10
Countries importing pulp Countries exporting pulp
0,80
Czech Rep
toe/t
0,70
Bulgaria
0,60 Slovakia Sweden
Finland
0,50 Norway
Poland
Belgium
0,40 UK Spain
Hungary
France
Netherlands Austria
0,30 Italy
Germany
0,20
0% 20% 40% 60% 80% 100% 120%
Ratio pulp / paper production
Source: ODYSSEE
Energy efficiency has improved by 1.4%/year in industry in the EU since 2000.
Energy efficiency progress in the industry sector as a whole is measured in ODYSSEE with an index called ODEX
11
that is calculated by weighting trends in the specific energy consumption indices of 14 individual branches ;
for each branch, the weight used is their share in the total industry consumption including the three energy
intensive branches (steel, cement and pulp & paper) for which the trends have been presented above.
As it is based on specifc energy consumtion in physical units, ODEX captures the energy efficiency development
better than traditional energy intensities per unit of value added. For some branches, however, the trends
shown include also some non-technical changes, especially, in the chemical industry, the shift to light chemicals
such as pharmaceuticals, due to the fact that this sector is not sufficiently disaggregated.
The average energy efficiency progress in industry, as measured by the rate of decrease of ODEX, has been
1.4%/year on average since 2000 (-17%)(Figure 18).
There has been a much slower energy efficiency progress since the recession in 2007 (0.9%/year from 2007 to
2013 compared to 1.9%/year from 2000 to 2007), because of a slower progress in most branches and even no
more energy efficiency improvement for some of others (e.g. steel, cement, machinery).
10
Specific energy consumption per tonne of paper produced.
11
The 14 branches include the 3 energy intensive branches (steel, cement, pulp & paper) and 9 other manufacturing
branches (chemicals, food, textiles, machinery, transport equipment, wood, other metals, other non-metallic minerals and
others), mining and construction. Specific consumption is measured in toe per unit of production index for these other
branches.
Energy Efficiency Trends and Policies in Industry 33You can also read