What People Do with Consumption Feedback: A Long-Term Living Lab Study of a Home Energy Management System
←
→
Page content transcription
If your browser does not render page correctly, please read the page content below
Interacting with Computers Advance Access published April 5, 2014
© The Author 2014. Published by Oxford University Press on behalf of The British Computer Society. All rights reserved.
                                                        For Permissions, please email: journals.permissions@oup.com
                                                                                              doi:10.1093/iwc/iwu009

           What People Do with Consumption
           Feedback: A Long-Term Living Lab
          Study of a Home Energy Management
                        System
              Tobias Schwartz1,∗ , Gunnar Stevens2 , Timo Jakobi2 , Sebastian Denef1 ,
                     Leonardo Ramirez1 , Volker Wulf2 and Dave Randall2

                                                                                                                          Downloaded from http://iwc.oxfordjournals.org/ at Fraunhofer-Gesellschaft - FhG on April 29, 2014
                     1 Fraunhofer   Institute for Applied Information Technology, Sankt Augustin, Germany
                                               2 University of Siegen, Siegen, Germany
                                    ∗Corresponding author: tobias.schwartz@fit.fraunhofer.de

         One of the great societal challenges that we face today concerns the move to more sustainable patterns
         of energy consumption, reflecting the need to balance both individual consumer choice and societal
         demands. In order for this ‘energy turnaround’ to take place, however, reducing residential energy
         consumption must go beyond using energy-efficient devices: More sustainable behaviour and lifestyles
         are essential parts of future ‘energy aware’ living. Addressing this issue from an HCI perspective, this
         paper presents the results of a 3-year research project dealing with the co-design and appropriation
         of a Home Energy Management System (HEMS) that has been rolled out in a living lab setting
         with seven households for a period of 18 months. Our HEMS is inspired by feedback systems in
         Sustainable Interaction Design and allows the monitoring of energy consumption in real-time. In
         contrast to existing research mainly focusing on how technology can persuade people to consume less
         energy (‘what technology does to people’), our study focuses on the appropriation of energy feedback
         systems (‘what people do with technology’) and how newly developed practices can become a resource
         for future technology design. Therefore, we deliberately followed an open research design. In keeping
         with this approach, our study uncovers various responses, practices and obstacles of HEMS use. We
         show that HEMS use is characterized by a number of different features. Recognizing the distinctive
         patterns of technology use in the different households and the evolutionary character of that use
         within the households, we conclude with a discussion of these patterns in relation to existing research
                                   and their meaning for the design of future HEMSs.

                                                  RESEARCH HIGHLIGHTS

          •   We developed an own Home Energy Management System (HEMS).
          •   We rolled out our HEMS system in a living lab setting to seven households over a period of 18 months.
          •   Our System provides feedback through TV, PC, smartphone and tablet-based interfaces.
          •   This allowed us to explore ‘what people do with HEMS in daily life’.
          •   We identify and discuss nine meaningful categories of appropriating HEMS.
          •   Based on our results, we discuss potentials for the design of future HEMSs.

                        Keywords: user studies; empirical studies in interaction design; sustainability
                                           Editorial Board Member: Paul van Schaik
                       Received 11 March 2013; Revised 31 January 2014; Accepted 19 February 2014

                                          Interacting with Computers, 2014
2                                                      Tobias Schwartz et al.

1.   INTRODUCTION                                                   publications on smart grid and HEMS technologies (Massoud
                                                                    Amin and Wollenberg, 2005; Rossello-Busquet and Soler, 2012)
In March 2011 the European Commission (EC) adopted a
                                                                    shows that user issues tend to be marginal to the discussion
new edition of the Energy Efficiency Action Plan with the
                                                                    on design decisions. The German Association for Electrical,
global objective of counteracting climate change by improving
                                                                    Electronic & Information Technologies or VDE summarizes
energy end-use efficiency as a means to reduce primary energy
                                                                    the problem (in relation to smart grids) as follows:
consumption and, consequently, the mitigation of CO2 and
other greenhouse gas emissions (European Commission, 2011).           So far, the discussion about the use of smart grids in private
In this plan, special emphasis is put on residential energy           households gives priority to privacy issues. Ergonomic aspects,
consumption which accounts for >20% of overall energy usage           however, have to be considered with an equally high priority,
in the EU (according to Erickson et al. (2013), it is 37% in the      since usability and the market acceptance depends on it. Only
USA), and in terms of absolute consumption continues to grow.         a few consumers have experience with smart grids. Accordingly,
One measure chosen by the EC to promote energy savings is             there is currently almost no knowledge available about ergonomics
                                                                      and accessibility. (Deutsche Kommission Elektrotechnik Elektronik
the enforcement of ‘smart metering’, the electronic measuring
                                                                      Informationstechnik im DIN und VDE, 2010. Translated by the
of electricity consumption. The aim here is to provide end-users

                                                                                                                                          Downloaded from http://iwc.oxfordjournals.org/ at Fraunhofer-Gesellschaft - FhG on April 29, 2014
                                                                      authors)
with individual meters that accurately reflect real-time energy
consumption.                                                        The reasons for this blind spot have to do with assumptions
   In making energy consumption visible to the consumer, smart      about the user. As Erickson et al. (2013) point out, the user
metering addresses a central problem of modern energy use           often is presumed to be a rational actor. Brynjarsdóttir et al.
(Darby, 2001). Indeed, energy is considered ‘doubly invisible’      (2012) argue similarly that existing research on energy feedback
to householders (Burgess and Nye, 2008): First, energy is           is primarily concerned with persuading people to consume
conceptualized as a commodity, a social necessity or a strategic    less energy. Conceptually, this focus on persuasion creates a
material (Sheldrick and Macgill, 1988), and hence is construed      direct link between technological intervention and behavioural
as an abstract entity. Secondly, rather than being an outcome       change, and hence is predicated on a form of technology
itself, energy consumption is a by-product of inconspicuous         determinism that fails to recognize the situatedness of practice
daily routines and habits (Shove, 2004), making it difficult        and the agency of people (Dourish, 2004; Suchman, 2007). This
for people to connect specific behaviours to the energy they        determinism tends to isolate issues in order to operationalize the
consume.                                                            ‘persuasion effect’and thus separates the phenomenon of energy
   To make consumption visible, interactive feedback systems        consumption from its context in everyday life. To avoid the
are considered crucial, as they increase energy awareness,          resulting narrowing of focus, it is important to ask ‘what people
motivate behavioural change and support learning processes          do with consumption feedback systems’, and in particular, how
(Darby, 2001; DiSalvo et al., 2010; Fitzpatrick and Smith, 2009;    people appropriate such systems into their daily lives and how
Mankoff et al., 2007). Feedback provision, it is argued, can        such systems shape patterns of consumption and the social
raise awareness and create knowledge that may bring about           practices of consumers.
change in energy-relevant behaviour, resulting in a decrease           Addressing these concerns, in this paper we present the
of consumption (Wilhite and Ling, 1995). Studies report the         results of a qualitative research approach (Strauss and Corbin,
potential of energy savings ranging 5–15% (Darby, 2001, 2006).      1990), aiming explicitly to investigate the question of how
Following several simple feedback solutions such as ‘Kill-          consumption feedback is appropriated and woven into the
A-Watt’ (Jönsson et al., 2010), a variety of Home Energy            complexity of people’s daily life. Our research is based on a
Management Systems (HEMSs) have emerged, which provide              6-month pre-study, (Schwartz et al., 2013b) followed by the
users several options on how to present the feedback information    development of a custom HEMS, which we rolled out in a living
(Rossello-Busquet and Soler, 2012).                                 lab setting to seven households over a period of 18 months.
   Despite largely positive results from feedback systems           Through TV, PC, smartphone and tablet-based interfaces, our
in academic studies, the widespread deployment of smart             system provides feedback on real-time and past electricity
meters capable of providing such feedback remains an open           consumption, both on a household and an appliance level. To
challenge for the domestic market. Publicly funded pilot            explore the impact of our HEMS on domestic life, we analysed
studies, as well as those conducted by large energy suppliers,      the data from on-site interviews and workshops using an open-
show that smart meters lack market acceptance (Deutsche             coding process, as suggested by grounded theory (Strauss and
Kommission Elektrotechnik Elektronik Informationstechnik            Corbin, 1990). To obtain additional insights, we conducted a
im DIN und VDE, 2010). One of the reasons identified                qualitative analysis of hardware and software adaptation by the
is that existing initiatives governing smart meters, smart          users of the systems and we reviewed system usage based on
grids and similar technologies pay too little attention to the      log file analysis.
desires, needs and practical purposes of users (Bundesverband          The rest of this paper is structured as follows: in Section 2,
Verbraucherzentrale, 2010; Franz et al., 2006). Indeed, a scan of   we present previous work that helped the framing of our

                                               Interacting with Computers, 2014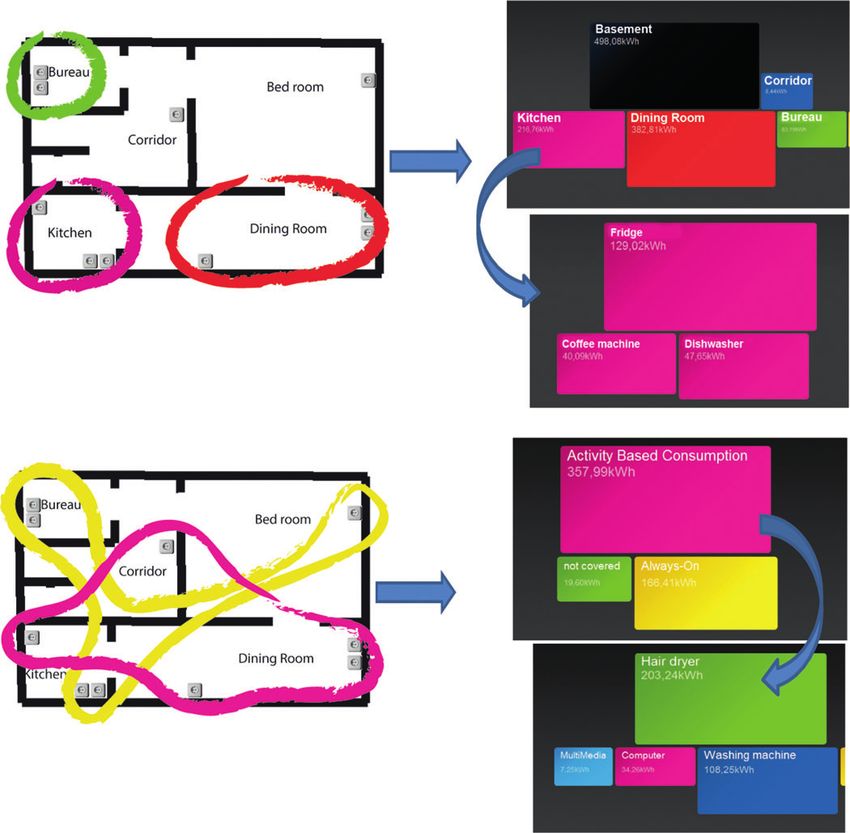
What People Do with Consumption Feedback                                                    3

study. Subsequently, we delineate our approach and methods.                      informed by environmental psychology and their
Section 4 presents the main results of our study, followed by                    findings to promote pro-environmental behaviour. In
a discussion of results and their implications for the design of                 general, normative comparison refers to the feature of
interactive consumption feedback systems.                                        visualizing consumption in relation to someone else.
                                                                                 e.g. the users’ Facebook friends (Foster et al., 2010) or
                                                                                 others households in the neighbourhood (Egan et al.,
2.    RELATED WORK                                                               1996). This feature helps users to understand their
                                                                                 consumption in the light of what is considered to be
In recent years several related concepts have emerged in the
                                                                                 normal and persuade them to modify their behaviour to
literature to describe a new family of IT systems, which
                                                                                 conform to social norms.
involve digitally measuring domestic resource consumption
and making this information accessible to the user. The terms
                                                                         From a historical perspective, the predominant technological
most used in the literature are smart metering technologies
                                                                         design strategies of smart metering technologies started with
(Darby, 2010), in-home displays (Chiang et al., 2012), energy
                                                                         rudimentary displays and evolved quickly over time, nowadays
monitors (Van Dam et al., 2010), energy management systems

                                                                                                                                               Downloaded from http://iwc.oxfordjournals.org/ at Fraunhofer-Gesellschaft - FhG on April 29, 2014
                                                                         covering a wide range in terms of their comprehensiveness.
(LaMarche et al., 2011), electricity consumption feedback
                                                                         First-generation devices were rather simple energy monitors
(Erickson et al., 2013) or eco-feedback technologies (Froehlich
                                                                         like ‘Kill-A-Watt’ and ‘Watt-Lite’ (Jönsson et al., 2010), which
et al., 2010). These technologies are closely related to each
                                                                         presented the raw energy consumption of the total household
other in terms of key design issues, historical development of
                                                                         consumption (smart meter solutions) or isolated appliances
practical implementation, theoretical underpinnings and their
                                                                         (smart plug solutions) on an LCD display. Typically, users
role in HCI research, as we will lay out in the following on an
                                                                         only had the opportunity to switch between different units.
empirical as well as theoretical level.
                                                                         By installing these displays in highly visible locations of
   Despite the absence of a naming convention, aforemen-
                                                                         households, they were supposed to raise awareness of energy
tioned systems share key design issues, which relate to the
                                                                         consumption. More sophisticated feedback systems often are
representation of data, the spatial and temporal aggrega-
                                                                         realized as web-portals (Erickson et al., 2013) or smartphone
tion/disaggregation, the historical and normative comparison,
                                                                         apps (Weiss et al., 2012), combining multiple features and
the topic of motivation support and the output medium and use
                                                                         data representations. While providing detailed information
context (Froehlich et al., 2010; Jacucci et al., 2009; Karjalainen,
                                                                         on household consumption, these systems typically do not
2011).
                                                                         include metering on an appliance level. In this regard, HEMSs
       (i) Concerning data representation, for instance, pragmatic       (Van Dam et al., 2010) go a step further by integrating
           displays focus on highly accurate and informative             various sensors and meters to provide feedback on different
           feedback. They commonly use physical (e.g. kWh),              aggregation levels (Rossello-Busquet and Soler, 2012). In
           economic (e.g. USD) or environmental (e.g. CO2 )              future, by combining concepts from consumption feedback,
           units and also use graphs to make the feedback more           home automation and demand response research (LaMarche
           informative. On the contrary, the primary aim of artistic     et al., 2011), HEMSs are expected to become two-way solutions
           visualizations like the ‘PowerAware Cord’ (Gustafsson         allowing for both: monitoring and controlling devices in the
           and Gyllenswärd, 2005) relates to ‘communicating a            home.
           concern, rather than to showing data’ (Kosara, 2007).            In the HCI community, the new feedback systems are mainly
      (ii) The spatial aggregation/disaggregation allows one to          discussed from a perspective of their capability to provoke
           break down the consumption to a room or appliances            energy savings. Moreover, some authors view this as their
           level. This e.g. makes it easier to detect energy gluttons    defining characteristic. For instance, Froehlich et al. define
           like old freezers that produce large amounts of wasted        eco-feedback technology as a system that ‘provides feedback
           energy (Froehlich, 2009).                                     on individual or group behaviours with a goal of reducing
     (iii) The temporal aggregation/disaggregation covers deci-          environmental impact’(Froehlich et al., 2010 our italics). In this
           sions such as the update frequency and temporal               line of work, an important part of the approaches in HCI adopts
           grouping (e.g. real-time, by day, week or month) of           the dominating stance in environmental psychology, explaining
           consumption data. Real-time information, e.g. helps to        energy consumption by means of the individual, rational
           get direct feedback of actions. Other temporal aggrega-       behaviour (DiSalvo et al., 2010; Froehlich et al., 2010; He et al.,
           tion fosters the detection of specific temporal patterns in   2010; Stern, 1992). In the field of environmental psychology,
           energy consumption (e.g. day/night, workday/weekend,          research on pro-environmental behaviour change has a long
           holidays, etc.; Froehlich, 2009).                             tradition. In particular, feedback mechanisms have been studied
     (iv) The design of normative comparison is closely related          over the past 20 years, demonstrating the positive effects on
           with the motivation support and incentive design.             energy savings since the time of paper-based electricity bills
           A lot of the design solutions became inspired and             (Egan et al., 1996; Wilhite and Shove, 2000).

                                                   Interacting with Computers, 2014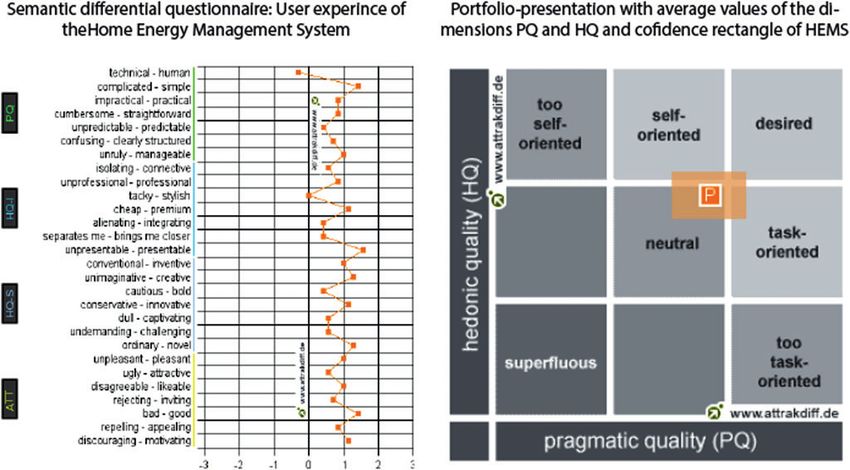
4                                                     Tobias Schwartz et al.

   Translating the theoretical models into design, some            focus, evaluating advanced and experimental technologies.
approaches in HCI make use of Fogg’s concept of persuasive         Representatives of this kind of research include the Wattsup
technologies, concerned with ‘how behaviour modification can       design study—an Facebook app providing social comparison
be induced by intervening in moments of local decision-making      that was evaluated by eight households over a period of 18
and by providing people with new rewards and new motivators        days with regard to electricity conservation (Foster et al., 2010);
for desirable behaviours’ (Fogg, 2002). The merit of this          the PowerPedia design study—a smartphone-based HEMS that
research thread is that it outlines the challenge of behavioural   was evaluated with regard to common usability dimensions
change, which goes beyond the design of usable and easy-to-use     by 25 participants in a lab setting (Weiss et al., 2012); or
systems.                                                           the EnergyLife design study—an eco-feedback game that was
   Brynjarsdóttir et al. (2012), however, note that focussing      evaluated in a 5-month field trial by four households and
on persuasion comes with a narrowing of vision that                concerned its use and resulting energy conservation effects
‘brings into sharp focus certain limited aspects of an             (Gamberini et al., 2011).
otherwise far more complex and unwieldy reality’. This                A notable exception from this model of conduct is the design
theoretical narrowing is accompanied by the danger of              study of EnergyDub—a web-portal based energy monitor that

                                                                                                                                           Downloaded from http://iwc.oxfordjournals.org/ at Fraunhofer-Gesellschaft - FhG on April 29, 2014
neglecting the plurality of theoretic stances in environmental     was evaluated in real, long-term use (Erickson et al., 2013). The
research. Highlighting this plurality, notable work has            findings show that in addition to reducing electricity costs and
been done by Jackson (2005), with a particular focus on            concerns about the environment, curiosity about the technology
consumer behaviour and behavioural change; Wilson and              posed another motivation for system use. They further revealed
Dowlatabadi (2007), addressing consumption-related decision-       that credibility and comprehensibility are important design
making; Hinton (2010), with a special focus on comfort             issues. In particular, they argue that it is not enough to
practices and their evolution, and Darby (2010) who put            simply visualize energy data, but a rich context for interpreting
an emphasis on theories of feedback provision. Recently,           feedback and comparisons is also needed. A similar issue was
in addition to individual-rationalistic explanations, it has       uncovered by a previous study (Schwartz et al., 2013b) as well as
been suggested that socio-technical and praxeological oriented     by Neustaedter et al. (2013), which suggests the use of calendar
approaches (Gram-Hanssen, 2010; Shove, 2004; Warde, 2005)          information to help users to establish connections between the
are needed to get a complete picture of the complex topic of       abstract energy data and domestic life more easily. In respect of
domestic energy consumption. In HCI, alternatively oriented        the effects of EnergyDub on users, Erickson et al. observe that
lenses, for example, help to understand the phenomenon of          their understanding of the consumption increased, but that the
energy as it is constructed by the people themselves (Kempton      system had only a moderate effect on electricity conservation.
and Montgomery, 1982) and how feedback mechanisms can                 Other long-term studies about using energy monitors in the
support making domestic energy consumption accountable             wild are few but where they exist, they further indicate that initial
(Schwartz et al., 2013b). Further notable examples of the          energy conservation and system usage effects decline over time
praxeological lens in sustainable HCI are, e.g., the work of       if dwellers do not change their domestic environment and their
Strengers (2011), Pierce et al. (2011) or Ganglbauer et al.        habits (Barreto et al., 2013; Van Dam et al., 2010).
(2013).                                                               Other research is more critical, holding the view that formal
   On the empirical level, a brief survey of the literature        models inadequately abstract away from the details of daily life
shows that empirical studies are commonly dominated by             and tend to place technologies in a position of authority over
the persuasion stance. In environmental psychology especially      users’ lives (Brynjarsdottir et al., 2012). Representative of such
that frame of reference is instantiated by the concept of pro-     a critical stance are the ethnographically oriented studies of
environmental behaviour change. Abrahamse et al. (2007), for       Chetty et al. (2008), Strengers (2008) and Hargreaves et al.
instance, survey the literature to evaluate several intervention   (2010). Their findings show that there is no simple cause–
strategies like goal-setting, information or feedback concerning   effect relationship between feedback and behavioural change as
their effectiveness in terms of encouraging households to reduce   persuasion models propose. They further indicate that energy
energy consumption. In a similar vein, Darby (2006) surveys        conservation fails not because home dwellers lack information,
the literature to figure out what kind of feedback will be the     but rather because of the complexity and interweaving of
most effective in terms of energy saving. Also meta-analyses       household activities (Chetty et al., 2008), people’s perception of
like Fischer (2008) or Ehrhardt-Martinez et al. (2010) primarily   current domestic practices as being non-negotiable (Strengers,
aim to summarize existing feedback studies with regard to how      2008) and ‘life being for living’ rather than rational decision-
much energy was saved.                                             making (Hargreaves et al., 2010). Hargreaves et al. (2010)
   While investigation into conservation effects represents the    further observe that styles of engagement tend to be gender-
major focus in HCI, studies also tend to follow a more or          specific and that domestic energy consumption presents a social
less standard research design. First of all, they typically are    and collective rather than individualized process.
short-term, small-scaled and lab-based (Froehlich et al., 2010).      We contribute to this research thread by studying the
In addition, they often have a strong design and usability         real-life, long-term use of a HEMS in the wild from an

                                              Interacting with Computers, 2014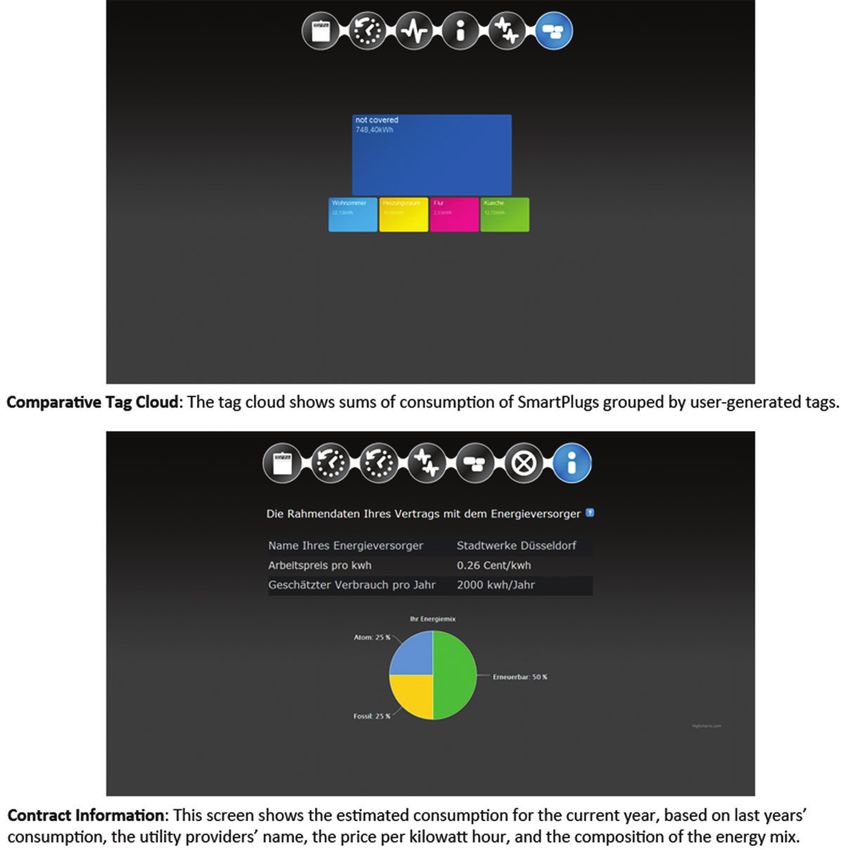
What People Do with Consumption Feedback                                                 5

appropriation-theoretical stance. This is shaped by the work          existing theories or perspectives, but should be methodologi-
of De Certeau et al. (1980), where appropriation represents the       cally indifferent (in the sense in which Garfinkel (1967) uses
tactics of everyday practice, which give artefacts their individual   the term). Existing work on domestication and using energy
meaning and results in use, which might be both unforeseeable         monitors in the wild, then, is of great heuristic value, but does
and unintended.                                                       not exempt us from the duty to develop categories from within
   This stance on appropriation has inspired several researchers      a particular case.
to uncover some typical patterns in relation to how people               To understand what energy monitors mean in the everyday
adopt and embed new products in their daily life. For instance,       life of people, we follow this view on appropriation by
the concept of domestication (Silverstone and Haddon, 1996;           using a grounded theory approach (Glaser and Strauss, 1967)
Silverstone et al., 1992) stresses that artefacts in a complex        where existing literature sensitizes, but does not determine our
and interdependent process have to be made to fit into pre-           analysis.
existing domestic culture and moral economy as well as
into local patterns of use and life rhythms. Pantzar (1997)
investigates the socio-technological relationship between users

                                                                                                                                          Downloaded from http://iwc.oxfordjournals.org/ at Fraunhofer-Gesellschaft - FhG on April 29, 2014
and commodities. He further notes that, in the process                3.   RESEARCH DESIGN
of appropriation, artefacts move through transformations              The work described in this paper was conducted as part of
of meaning, leading from initial phases of exploration                a 3-year project focusing on the research and development
and excitement to—eventually—the routine. Integration of              of concepts and strategies of in-house information systems,
technology into existing functional needs, or desires brought         including HEMSs. To address the complexity and situatedness
about by the artefact itself is critical for the long-term usage      of HEMS use in real-life environments, we applied a living
of technology. Stewart (2003) also uncovers some common               lab approach (Bernhaupt et al., 2008; Eriksson et al., 2005;
themes concerning domestication such as privacy, family/well-         Følstad, 2008). Living labs make it possible to bring users and
being, communication, etc. He further outlines that in order to       technology together in an open-ended design process in real-
understand consumption we have to take into account the social        life environments (Følstad, 2008). They specifically support
processes that are shaped by background and personal history,         long-term cooperation, co-design and collaborative exploration
events, activities and by the social network.                         among researchers, users and other relevant stakeholders.
   The openness of the appropriation process has a methodolog-        Involving users in the design process from the very beginning for
ical consequence insofar as the research question is reversed.        ‘sensing, prototyping, validating and refining complex solutions
Rather than asking what technologies do to people, we ask             in multiple and evolving real life contexts’ allows a continuous
what people do with technologies. To uncover local rational-          formative evaluation of the designed artefacts and uncover
ities, meaning and practice, it implies that appropriation studies    appropriation phenomena at early stages of the technology life
need to be qualitative and ethnographical in nature (Chaiklin         cycle (Bernhaupt et al., 2008).
and Lave, 1996; Pierce et al., 2011). In particular, the categories      At the beginning of our living lab set-up (cf. Fig. 1), we
that we use to describe these phenomena need to be emergent.          conducted a pilot study (Schwartz et al., 2013b), between
Appropriation studies, in this view, should not be predicated on      November 2009 and May 2010, with an independent set of

                                                       FIGURE 1. Research Design.

                                                Interacting with Computers, 2014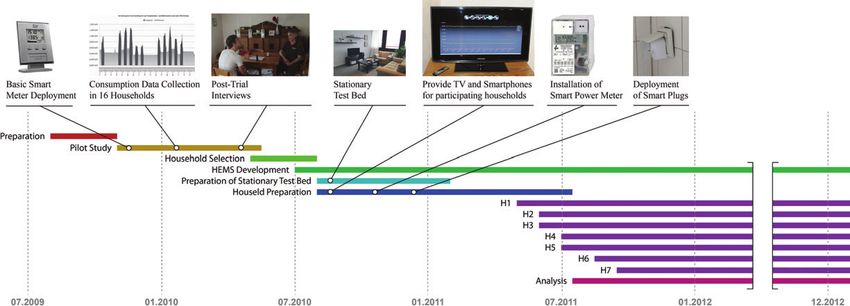
6                                                     Tobias Schwartz et al.

                                                   TABLE 1. List of households.
                                                                                                                 Equipment provided
Type of flat       m2         Type of household              Participants                 Sensors                    with project
RA                 69              Couple             Female, 27, Teacher male,       SmartPlugs                Flatscreen TV,
                                                        26, Office Clerk                                          Smartphone, Media
                                                                                                                  Center PC
 RA                 80              Couple            Female, 28, Marketing           SmartPlugs                Flatscreen TV,
                                                        Specialist male, 31,                                      Smartphone, Media
                                                        PhD Student                                               Center PC
 OFH               140              Family            Female, 37, Office              SmartPowerMeter,          Flatscreen TV,
                                                        Assistant male, 39, IT          SmartPlugs                Smartphone, Media
                                                        Specialist                                                Center PC
 OFH               120              Single            Male, 44, Banker                SmartPowerMeter,          Flatscreen TV,

                                                                                                                                          Downloaded from http://iwc.oxfordjournals.org/ at Fraunhofer-Gesellschaft - FhG on April 29, 2014
                                                                                        SmartPlugs                Smartphone, Media
                                                                                                                  Center PC
 OFH               145              Family            Female, 60, Office Clerk        SmartPowerMeter,          Flatscreen TV,
                                                        (part-time) male, 66,           SmartPlugs                Smartphone, Media
                                                        Retiree male, 28,                                         Center PC
                                                        College Student
 OFH               140              Family            Female, 45, Housewife           SmartPowerMeter,          Flatscreen TV,
                                                        male, 47, Mechanic              SmartPlugs                Smartphone, Media
                                                        female, 10, Student                                       Center PC
                                                        female, 7, Student
                                                        female, 5, Student
 RA                 55              Single            Female, 29, PhD Student         SmartPowerMeter,          Flatscreen TV,
                                                                                        SmartPlugs                Smartphone, Media
                                                                                                                  Center PC
RA, rented apartment; OFH, one family house.

households with 46 participants in 16 homes. We provided             the study in the local press and via radio stations. Interested
an out-of-the-box smart meter infrastructure that measured           people were asked to submit an online questionnaire with
energy consumption on an appliance level over a period               basic information concerning their households’ infrastructure,
of 10–15 days. While participation was voluntary, selected           motivation for participation and expectations about the project.
households varied widely in demographics (age, gender),              Additionally, telephone and on-site interviews were conducted
living arrangements (home owner, apartments) and in terms            to gather additional information about the households, including
of social and professional backgrounds. Following device-            technological constraints and prerequisites, such as the
testing and data acquisition, we used the collected consumption      availability of Wi-Fi and the possibility of installing smart
information for conducting workshops in the households where         meters and device-level meters. We finally selected seven homes
we launched informal and unstructured discussions about              with 16 participants. An overview of the selected households
practices and preferences. All workshops were audio-recorded         and of the participating members is provided in Table 1. All
and to large extent videotaped as well. We analysed the data         households were located near the city of Siegen, Germany,
using media annotation tools in an open coding fashion, to look      representing a typical sample for this region (Federal Statistical
for common patterns and categories related to the ways how           Office Germany, 2011). This sample size allowed us to include
people make use of consumption feedback and how they relate          a range of different household settings and, within the project’s
to and live with such a system. We explored existing energy          resource limitations, to distribute an entire HEMS system
practices, sense-making strategies and accounting procedures         including a set of interactive devices. With a planned overall
for consumption with our partners, drawing on metering               research period of 24 months, the sample was expected to
information and empirical data we had thus far collected.            produce a large body of data that would allow for an in-depth
   In the next step, we conducted a longitudinal living lab          analysis. As can be seen in Table 1, households ranged from
study, based on a qualitative sample of households which we          one to five in the number of inhabitants and from five to 66
chose following a comprehensive selection process. The sample        in age. Furthermore, different levels in terms of technological
was obtained, in the first place, by placing information about       skills and knowledge as well as educational attainment were

                                               Interacting with Computers, 2014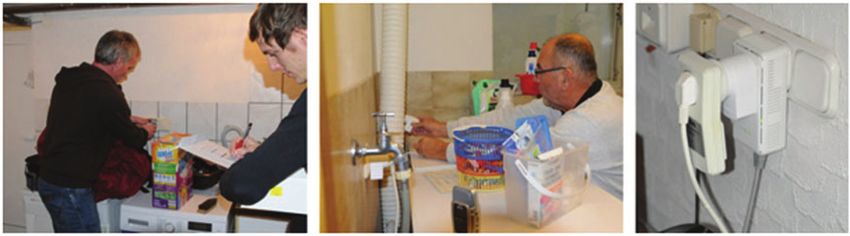
What People Do with Consumption Feedback 7
included. Motivation varied, stemming from disaffection with were not equipped with a TV or smartphone, relevant hardware
current energy billings, technological interest and curiosity was provided.
about being part of a research endeavour. While all participants Once selected, significant effort went into the preparation
reportedly had a high general interest in saving energy, only of households. Since technological conditions and premises
H5 had taken action in taking sample measurements of varied considerably, we needed to standardize participants’
appliances and calculating their total impact on the annual infrastructure in order to create equal basic conditions for
bill. our HEMS throughout the entire project. For installing
For our initial HEMS development, our design was based on the SmartPowerMeter, the support of respective electricity
empirical analysis of our pilot study and, to a limited extent, on providers was required. Previously, we had analysed the
usability features gleaned from the literature on consumption technical features of different Smart Meters, to assess
feedback design. The technical HEMS set-up consisted of a the implementation costs of communication protocols and
number of different components. facilities for our HEMS prototype. The deployment of the
First, capturing the households’ overall power consumption SmartPlugs was carried out during collaborative workshops
required replacing the existing mechanical power meters with householders and our project team. We conducted a
Downloaded from http://iwc.oxfordjournals.org/ at Fraunhofer-Gesellschaft - FhG on April 29, 2014
with digital SmartPowerMeters that enable capturing the deployment workshop with each household, during which they
overall energy consumption of the respective household. distributed the SmartPlugs in their household. Participants
Once installed, we were able to receive measurements via were free to position them, limited only by the necessity of
an optical communication module of the SmartPowerMeters. a working Zig Bee connection. Within each household, about
We used Ethernet gateways as a coupling element and in- 10 SmartPlugs were deployed (Overall, 72 SmartPlugs in 7
house PowerLine communication to make meter readings households). Every deployment was documented in terms of
accessible throughout the participant’s home network. During type of appliance, usage context, position in the house, person
the operation, the meters continuously sent out consumption who wanted to have it there and a short indication of reason.
data using SmartMessageLanguage protocol via message push Figure 4 illustrates how people deployed the SmartPlugs within
(VDE, 2010). their homes.
Secondly, in order to capture power consumption on an Additionally, we implemented a second, stationary control
appliance level, SmartPlug sensors were used providing test bed in our lab. This test bed was equipped in a similar way
disaggregated measurements. The SmartPlugs can easily be to the participants’ households in terms of technology. Hence,
installed by plugging them between the power socket and the we were able to run tests under similar conditions and eliminate
appliance plug. Using an autonomous Zig Bee network, they technological problems before rolling out a new HEMS version.
provide information about current power consumption and keep After this initial work, we started the continuous investigation
a history log of energy consumption of connected appliances. of HEMS appropriation. We began by conducting semi-
Additionally, the hardware allows turning appliances on and off structured interviews with all participating households, to
remotely. uncover existing knowledge, attitudes and motivation affecting
Thirdly, the HEMS included a Media Centre PC, which we energy consumption. The questions of the initial interviews
connected to the households’ main TV. This computer acts focused on participants’management of electricity consumption
as a SmartEnergyServer, managing, storing and processing at home. From this time onwards, numerous activities within
measurements. The server also runs the HEMS’ EnergyMonitor the participating households were conducted, including in-
software to feed back a graphical user interface visualizing depth interviews, prototype explorations, user workshops and
collected information. The software was designed in a way participatory observations of the use of the EnergyMonitor.
that allowed for a straightforward interaction which did not We frequently visited the households, supported them with
require any prior knowledge or special training. The system has technical problems and provided new versions of the HEMS
been iteratively developed throughout the project, predicated when available. The focus of our investigations evolved and
on participants’ feedback and our observations. In its current varied slightly over time. While at the beginning questions
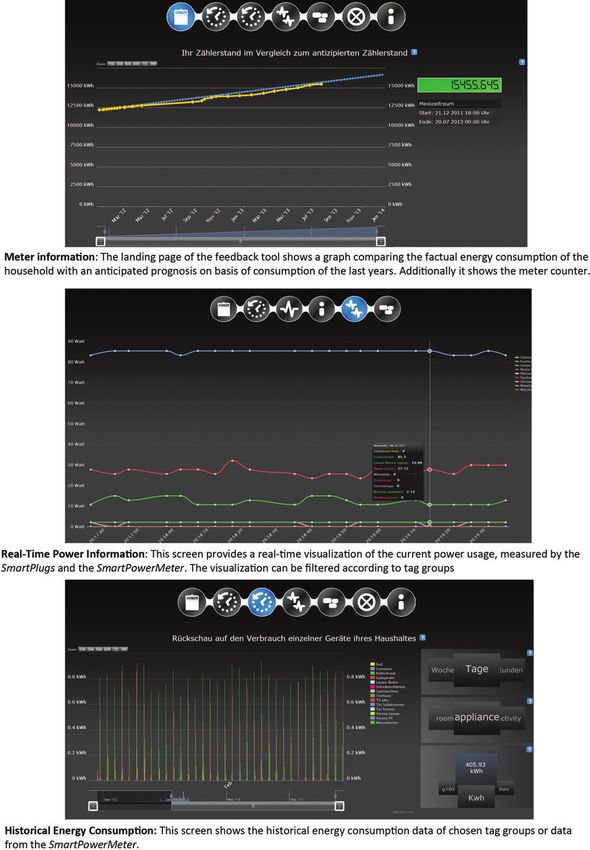
version, the EnergyMonitor includes seven screens that show centred on current management of electrical consumption
readings from the SmartPowerMeter, information on real-time and attitudes towards resource consumption, we then shifted
power consumption, an energy consumption history log and a towards more detailed questions about HEMS use in
comparative tag cloud. The latter allows users to freely assign participants’ daily life. Also, occasional workshops included
tags to SmartPlugs, thus grouping them according to personal more specific tasks such as usability testing and design sessions.
preferences. Selected views of the EnergyMonitor are shown in For data collection, our research involved a mixed-method
Fig. 2. approach with a view to triangulating the results (Flick, 2009).
Fourthly, when interacting with the EnergyMonitor, users As our first source for unobtrusively collecting data in real-
were able to access feedback from a common interface when life settings, we studied the integration of HEMS into the local
calling the EnergyMonitor from their TV, computer, tablet context and its use over time, by evaluating the log files of the
device or smartphone (cf. Fig. 3). In the case where households SmartEnergyServer.
Interacting with Computers, 2014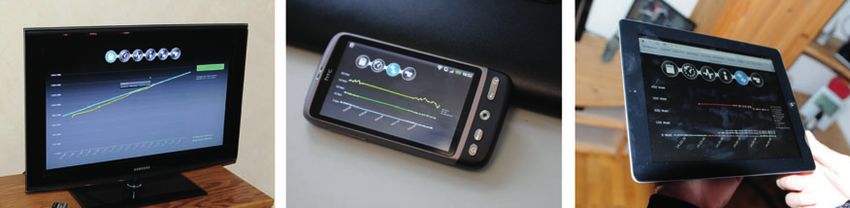
8                                                     Tobias Schwartz et al.

  Secondly, for validating usability and assessing the level            Thirdly, to understand the households’dynamics (Hargreaves
of acceptance of our HEMS design, we conducted an                    et al., 2010, 2013; Wallenborn et al., 2011), we studied emerging
AttrakDiff survey (Hassenzahl, 2006) to learn about the              practices and critical incidents (Stevens, 2009). Here, we relied
perceived usefulness and easy use, as well as hedonic and            on qualitative data captured during interviews, informal talks
pragmatic qualities (Davis, 1989; Hassenzahl, 2006). The             and observations from on-site visits. Overall, we audiotaped 70
survey conducted showed the level of acceptance and pointed          interviews and 34 workshops, with a total length of over 200
out that the system was perceived as both usable and attractive.     hours. Several million datasets on the energy consumption of

                                                                                                                                         Downloaded from http://iwc.oxfordjournals.org/ at Fraunhofer-Gesellschaft - FhG on April 29, 2014

FIGURE 2. Main views of the Energy Monitor (realized as HTML pages that could be displayed on Television, Smartphones and Computers).

                                              Interacting with Computers, 2014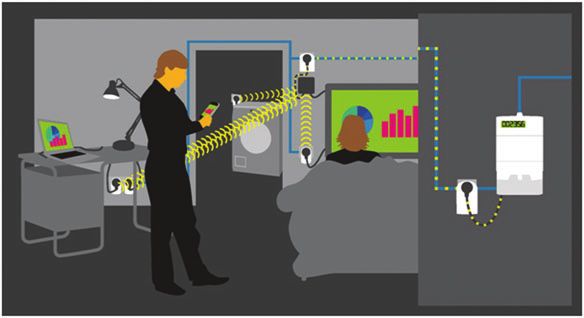
Downloaded from http://iwc.oxfordjournals.org/ at Fraunhofer-Gesellschaft - FhG on April 29, 2014
9
What People Do with Consumption Feedback

                                                                                                                                                                      Interacting with Computers, 2014
                                                                                                                                               FIGURE 2. Continued.
10 Tobias Schwartz et al.
households and appliances were gathered over a time span of scrutinized and coded. Therefore, we used software tools to
18 months. analyse and tag the text-based transcripts of the conducted
Furthermore, households increasingly accepted remote interviews to identify similarities in using HEMS among the
access to the SmartEnergyServer even in their own absence, different households. At first, we composed categories based on
which was helpful when installing new releases or preparing the findings in the collected data. Then, these categories were
follow-up visits and observing the usage of new features. related to each other (axially coded) and evolved through further
As we have suggested, most research into domestic energy research and investigation steps. As is typical for a Grounded
consumption has focused on feedback mechanisms and how Theory Approach, data collection, analysis and interpretation
they affect individual decision-making. Our concern is rather were intertwined and newer data were constantly compared and
different and, as such, the development of alternative concepts included into already assembled codes. This analysis provided
is a part of our focus. For this reason, we chose an inductive the foundation to generate the categories presented in the next
strategy. Grounded theory, of course, has been subject to a sections.
number of criticisms and various interpretations. They range
from the earliest formulations, associated with Glaser and
Downloaded from http://iwc.oxfordjournals.org/ at Fraunhofer-Gesellschaft - FhG on April 29, 2014
Strauss (1967), through separate inputs from Strauss and Corbin 4. IMPACTS OF HEMS ON DOMESTIC LIFE
(e.g. Strauss and Corbin, 1997) and from Glaser (1998) and
In this chapter, we will present the results of the open-coding
more ‘method oriented’ treatments associated with Charmaz
process of the collected data. Our analysis resulted in nine
(2006).
categories, which we will describe in the following. Each
For our analysis of the collected data, we followed an
category begins with a title that describes the core aspect of
open coding process and the constant comparative method
the category. We will then summarize the category in a short
as suggested by Glaser and Strauss (1967). To explore the
paragraph, before describing it in more detail, supported by
impacts of our HEMS on domestic life, we analysed the data
empirical results.
from on-site interviews and workshops using an open-coding
process, as suggested by grounded theory (Strauss and Corbin,
1997). After each step, the transcripts of the material were 4.1. We are curious
Our participants were highly motivated to investigate their
domestic energy use with HEMS. Once they discovered the
opportunities provided by the technology, they are keen to
monitor their domestic energy use. Participants named real-
time local information of energy consumption at point-of-use
as the most important benefit. The new possibilities provided
by the HEMS starkly contrasted with their past situation, where
consumption had remained largely invisible.
Our study shows the value to households of having a
controlling instrument at hand, one which monitors their
consumption and enhances energy awareness. Within the
conducted AttrakDiff questionnaire, the hedonic quality
stimulation (HQ-S) is rated high (mean: 1.6). This value
addresses the human need for excitement (novelty/change) and
FIGURE 3. Collect consumption data on a central home server and refers to quality aspects such as ‘innovative’, ‘exciting’ and
provide multiple accesses to get feedback on different devices. ‘exclusive’ (Hassenzahl, 2006; Fig. 5).
FIGURE 4. Deployment and documentation of SmartPlugs within collaborative workshops.
Interacting with Computers, 2014What People Do with Consumption Feedback 11
Downloaded from http://iwc.oxfordjournals.org/ at Fraunhofer-Gesellschaft - FhG on April 29, 2014
FIGURE 5. Results of the AttrakDiff questionnaire.
The following examples show how participants manifested Example 3
their interest in using the system to observe their energy
P3: So, it was always interesting [using the system], I turned
consumption and get a detailed picture of their local energy
on the TV and then I saw how much energy the different
system:
appliances consume by comparing it to what it was before.
That was pretty interesting—‘guys, tell me what you’ve
Example 1 switched on’—so that I can keep track of what they’re using
[...] and that’s how it was, then you can compare the days,
Interviewer: So, if you could say again, on a general level, my wife was doing the laundry, so the usage is higher and
what was good and what wasn’t. Can you give us feedback? so on. That’s pretty interesting.
P1: I thought it was really good, that you could measure Example 4
every appliance. Even if I was charging my mobile phone or
something else, I could measure that. That’s also interesting P4: Well, I said: I thought maybe you switched on a device or
in regards to something being on stand-by, let’s just say, your laptop, because the curve is up to 200 W, but I don’t
using 100 W. How is it used? I have an overview over all know why. Then I thought, maybe it’s the fridge because it
of the electricity I use. Before I would have had to do that cools now and then but then it showed 100 W before and I
manually and now I can see it on the display. I like that. don’t know which device needs 60 W, that means the 40 W
That is very useful, because I can see where electricity is that the PC uses plus the 60 W […] I have to check this
being used and how much is being used. again, that’s very interesting, clearly!
The ability to get immediate consumption information was the
most attractive aspect of using the HEMS in the participating
Example 2 households and was mentioned as ‘most beneficial’ and a
Interviewer: What are your experiences with the smart ‘quick win’. The system log files show that ‘real time power
metering system that we installed? How did you use the information’ was the most used page of the HEMS. The current
system? […] meter count (‘meter information’) (Fig. 6) ended up as second
most positively received information.
P2: Yes, I have to say, the whole thing interested me from the We found how options for monitoring and inquiring con-
start […] so I did look at it, I was really curious […] my sumption were directly connected to the means of measuring
wife was vacuuming and I took a look to see how much consumption by deploying the sensing infrastructure. Partici-
[electricity] the vacuum cleaner uses. pants frequently reflected on how to deploy smart plugs in order
Interacting with Computers, 201412 Tobias Schwartz et al.
Downloaded from http://iwc.oxfordjournals.org/ at Fraunhofer-Gesellschaft - FhG on April 29, 2014
FIGURE 6. Overview of HEMS component usage.
to get the most interesting information from their local energy
system.
This includes both the aspect of coverage of consumption
information from single devices and the aspect of granularity
for a detailed view on domestic consumption.
During the initial phase of HEMS deployment, participants
mentioned that it was important to them to include all
major appliances, so that the overall energy picture was as
complete as possible, despite the limited number of SmartPlugs.
Householders consciously positioned the SmartPlugs within
their homes according to their own preferences and needs.
FIGURE 7. Overview of device categories covered by Smart Plugs
We noted some recurring decision-making criteria across
and coverage by Smart Plugs from total in %.
households. Participants repeatedly reflected on their most
frequently used appliances and devices that they believed use
a lot of energy and matched this with SmartPlug distribution.
Figure 7 gives an overview of the devices distributed within domestic energy usage for the entire household. In households
the homes, summarized per device category and the coverage with multiple members, this person was our first contact and
of the total household consumption. In nearly every household simultaneously the energy expert in the home, as the following
the initial deployment of SmartPlugs was changed during the excerpt shows:
time of our study to improve the coverage and to accommodate
individual preferences in monitoring consumption. Interviewer: And did you check it together with your wife?
4.2. I or we P5: Yes, sometimes, but I am the one [who uses the system].
She of course found that interesting, too, but technical stuff
Using the HEMS influenced social relations and interactions is my business, she probably wouldn’t even know how to
between household members. There are two broadly distinct boot it [HEMS] up.
cases of HEMS use: Either one person is the main and
independent HEMS user or HEMS is used in a more social, Here, we also observed in some cases that family members
collective fashion. asked their ‘energy expert’ questions concerning consumption.
From our data, we identified two different types of HEMS The expert then either gave advice or supported the use of the
use: On the one hand the local single energy expert, and on the HEMS.
other hand householders’ collaborative and mutually elaborated
use of the HEMS. P5: She asks me and then I said: ‘Here you can see how much
With the first type, the prevailing user takes on the role the washing machine consumes or how much the dryer
of the local energy expert who is in charge of the topic of consumes…
Interacting with Computers, 2014What People Do with Consumption Feedback 13
Also, in some cases, the ‘energy expert’became the controller, understanding of energy usage within the homes to achieve
or ‘teacher’ who enforced the rules for domestic energy energy consumption optimization through joint efforts.
consumption.
P6: Yes, now I know that my daughter used the computer and 4.3. Energy literate1
listened to music at the same time and she also was on the
The HEMS fosters learning about electricity consumption and
phone and went outside to the balcony for a phone call. And
ascribing a meaning to the information presented by it. They
then I just said: Hey, there are already 100 W from your
become more literate and thereby much more specific and
room alone. Either you switch off the devices or you hang
expressive in talking about their home energy usage.
up. That’s a thing: phone calls with the teenagers these
This theme became visible in the stark contrast between the
days go on for half an hour or an hour and the devices are
interviews before HEMS installation and after. We will use the
on anyways.
following two parts, taken from interviews with the same person
Here, the social interaction between household members is from household 2, as an example of the growth of knowledge
about advice and attempts by the local energy expert to avoid and the capabilities of householders regarding their individual
Downloaded from http://iwc.oxfordjournals.org/ at Fraunhofer-Gesellschaft - FhG on April 29, 2014
an inefficient use of resources. energy literacy. The first excerpt is taken from the first visit
In the second type of use, householders develop mutual in the project, where we wanted to learn more about their
practices to understand their energy use. Householders use individual housing context, as well as their understanding of
the HEMS collaboratively and mutually develop strategies for their energy consumption. Here, the person explains his energy
optimization. Here, for instance, one person would monitor the consumption.
HEMS on the TV, while the other person would walk around
the house to turn appliances on and off. P9: I don’t really know how much the receiver consumes. The
TV, because it’s a plasma TV, consumes quite a lot. Other
P7: When I had the TV on, or, I also looked at it in between, than that … the refrigerator, I don’t know how much that
and then I also checked with my wife when we, for instance, consumes, I don’t think it’s that much. […] I’d also say the
turned on the coffee machine, to see how that shows up on stove; I’ve never really paid attention to its consumption.
the curve. Or when she intentionally went downstairs and I would also guess, the TV consumes the most and in the
then turned on the washing machine, we could track the kitchen, the stove. But I’m not that sure about that.
impact.
The second excerpt is taken from an interview with the same
We observed that a collaborative use of the HEMS
participant after a HEMS deployment of 94 days, during which
influenced social relations and interaction between household
the system was accessed on 41 days (cf. Fig. 8).
members. In the case of multi-person households especially,
the use of the HEMS triggered communication among P10: [it was beneficial] seeing how much each device
members. This included an increase in decision-making and consumes and then to think about it […] Alarming how
coordination processes among the members of the household much we use in the evening. […] The TV consumes quite
concerning their energy usage. We observed recurring forms a lot, I have to say, almost 600 W [...] and when the oven
of communication where sharing experiences and joint rockets up to 3000 W […] And the dryer, I would have said
optimization played an important part. This form of exchange it needs quite a bit, but the consumption actually was not
mostly aimed at the promotion of collective efforts to optimize that high. I thought it goes up to 2000 W or so […] if it does
and control the current state of energy use within the homes. full heat. But then it was only 400 W.
The following quote is an example where a husband mentioned
how he communicated spontaneously whilst at work with his Here, the participant is able to de-aggregate his individual
wife at home, in order to clarify energy use at home: consumption on an appliance level. He uses ‘watt’ as a unit
P8: When we did this I could not understand one thing, and to explain and compare electricity consumption and to make
that’s when I remotely logged in [from work], when I logged value statements.
in it was about 100 W. Well, I thought, that’s the computer His explanations are from memory, showing that the
itself, but wait, that is only 40 W. So I thought, OK, maybe knowledge about electricity consumption has been deeply
there are some other appliances running. But then the curve internalized and his competence to assess his own ‘energy
goes up to 200 W—and I think ‘what?’ there’s nothing else system’ seems to have grown through the use of the HEMS.
switched on at home. Then I called my wife at work or on This was a common observation in all participating
her cell and asked: ‘Did you just come home? Because she households. Throughout the study, householders increasingly
goes home at lunch time’. She says: ‘No, I’m at work’. mastered the drawing of a detailed picture of their local energy
system after using the HEMS. Participants were able to be quite
In these cases where the HEMS is used collectively, forms of
communication are shaped by the goal to develop a common 1A detailed report of this category can be found in (Schwartz et al., 2013a).
Interacting with Computers, 201414 Tobias Schwartz et al.
Downloaded from http://iwc.oxfordjournals.org/ at Fraunhofer-Gesellschaft - FhG on April 29, 2014
FIGURE 8. Usage statistic based on log file analysis of the HEMS system.
specific about consumption data relating to their appliances and energy consumption information and the context of their daily
demonstrated this by using numerical units of consumption in life. This connection represented an important precondition
their descriptions. for an informed reflection about the actions that may lead to
We observed that Energy Literacy, for our respondents, significant changes in consumption patterns.
presents a value in itself. It had a significant influence on
covering and improving both the general and theoretical
4.4. We are proud
knowledge about energy, as well as promoting the skills
necessary to understand one’s own energy consumption. In our Householders identify with the system. They proudly present
study, participants developed an increased competence to trace the HEMS to their friends when they visit and also remotely
back energy flows and use it for overall energy management. from work to their colleagues.
The growth of energy literacy that we observed was an As reflected in the peak value of the AttrakDiff evaluation,
evolving process with the accurate and trustworthy information HEMS users think that the system is highly ‘presentable’(Mean:
on energy consumption and the reflexive contextualization of 1.7). This is related to the system’s hedonic quality identity,
this information mutually informing what participants had to which refers to human needs like pride, social power or status
say. Participants progressively made a connection between (Hassenzahl, 2006).
Interacting with Computers, 2014What People Do with Consumption Feedback 15
Our users often expressed the view that they liked the P13: Yes, yes, exactly. It is the interesting to see it again. You
system and could identify themselves with it. As the following know in principle everything is alright. If then suddenly it
statement shows, they also presented the HEMS system to goes up to 2000 W … well maybe someone is stealing power
others: or there’s a malfunction in the house or so.
Example 1 At an early stage in the project, a recurring pattern was that
participants roughly estimated their consumption based on
Interviewer: You said that you used HEMS a number of times.
verifiable values and plausible reference scenarios (as shown
How did you like it? What did you do with it?
in the above quote). Given that householders were increasingly
P11: Also, if friends came over, I say: ‘Look here [and they able to draw a detailed picture of their energy system over time,
would say]. What did you have here? That’s cool.’ Then I this allowed them to maintain an overview of consumption.
said: ‘Hold on. Then I turned on the heater and when it Checking the plausibility of consumption posed a similar
jumped to 3000 W […] you see it’s going up and down.’ motivation for using the HEMS continuously. The practices
of estimating and comparing consumption steadily developed.
Downloaded from http://iwc.oxfordjournals.org/ at Fraunhofer-Gesellschaft - FhG on April 29, 2014
Interviewer: So you showed it to other people? Previous values and more detailed reference scenarios become
increasingly relevant as the following example shows.
P11: Yes, of course also from home. Or I dialled in and then
showed a colleague: ‘Here, look at this! You can see the Interviewer: Does the displayed information mean anything
current power consumption.’ ‘Oh yeah, that’s cool!’ And to you? What kind of relevance does it have?
then he would say: ‘Oh, I would have liked that too …’
P14: […] 300 Watt, currently, for mid-day is not so much.
Usually we have 500 Watt … I memorized this because I
Example 2 check continuously.
Interviewer: And did you sit together and look at it [you and The aspect of keeping energy use under control is also visible
your wife]? in the log files. Users frequently accessed the system right from
the beginning and sustained their usage behaviour over time
P12: Yes, […] also when there were visitors, we showed it.
throughout the 18-month period of our study.
Given these viral effects, we received requests from other people Overall, the analysis of the log files show that users accessed
asking if they could become participants of our study too and the HEMS on average every 5.9 days (range: 2.43–12.64) to
we currently keep a list of users to take part in a future project. check their domestic energy consumption. Small peaks in use
More importantly, and although we have limited data as yet, became apparent after conducting major project workshops
these results provide some early indication of a wider network (WS1: deploying SmartPlugs; WS2: Software Release Version
effect that has been hitherto unreported. Our evidence suggests 2; WS3: Software Release version 3; WS4: Evaluation). Use,
that user pride in the system and their developing abilities however, also continued more or less stably without any project-
to monitor and understand information provided have some related interventions.
spillover influence outside of the family. Our finding of a sustained use points to the wish of users
to maintain an overview of energy consumption and control
impact of actions taken or developments in general on a
4.5. Maintaining the overview longer term. Even though usage statistics in some cases show
The HEMS allows participants to make their energy a decline in HEMS access over time, at the same time it
consumption visible, a fact that they consider very beneficial. clearly demonstrates an overall usage beyond an initial interest.
Beyond an initial curiosity (4.1), there is a sustained desire to Our iterative design process, one which successively provided
maintain an overall picture and monitoring accurate control of households with more sophisticated HEMS interfaces, might
energy usage at home. have fostered interest and motivated participants in learning
The need for maintaining an overview increases with time, about their energy consumption.
as HEMS use changes from a ‘single point investigation tool’
to a control system, which continuously relates information in a 4.6. Individual accounting
broader context. We observed that our users continuously used
the HEMS to maintain an overview by checking the plausibility Ways of explaining private energy consumption are highly
of their energy use from time to time, as the following example individual. The adaptability of our HEMS made it possible to
shows: include individually defined metrics and individual definitions
of comparable groups and classes. With this support for
Interviewer: That means you sit here and check it from time to adaptability, users could progressively create a feedback system
time? that displays consumption in a language that is meaningful to
Interacting with Computers, 2014You can also read