TARGETED COMMUNITY LENDING PLAN- 2021- Federal Home ...
←
→
Page content transcription
If your browser does not render page correctly, please read the page content below
TARGETED
   COMMUNITY LENDING PLAN
          — 2021 —

FHLBNY                      1
Letter from the Community Investment Officer

Dear Members and Community Partners,

As of the writing of this Targeted Community Lending Plan (Plan), the COVID-19 pandemic continues
to press on the vulnerabilities of communities across District II served by the members of the
Federal Home Loan Bank of New York. Those members and the district’s impressive array of housing
developers and social service providers know well the extent of pre-existing needs for access to
credit and affordable, high-quality housing. The pandemic, as data are beginning to show, is only
making those needs more severe.

The escalation of need, though, is not being met with an equal level of financial support or strategic
coordination. Without adequate federal, state and local resources, it is clear today more than ever
that private sector dollars need to be thoughtfully and creatively deployed to maximize their impact.

Two recent, complimentary efforts within the Federal Home Loan Bank of New York (FHLBNY)
have made our community investment products and programs more relevant for today’s
demands. First, 2021 will be the third year that community investment is fully incorporated into
the FHLBNY’s overall strategy. That means staff from across the institution are now shaping the
rules and operations for community investment in new ways. This Plan’s discussion of the district’s
credit needs shows how internal collaboration continues to strengthen the value proposition of
our offerings for the membership.

Second, 2021 will be the first year for the FHLBNY’s full implementation of the new regulation
governing the Affordable Housing Program. The FHLBNY took the new rule, issued in late 2018, as
an opportunity to conduct a comprehensive review of the flagship grant program and the
homeownership program, covered by the same regulation. Stakeholders in every corner of the
district made that review a success.

Previous Plans described, at great length, the community needs and provided FHLBNY members with
a guide to community investment offerings. This 2021 Plan goes further in connecting the rationale
and evidence with the FHLBNY’s choices about products and programs for the coming year.

Members and partners will see changes and innovation across the board, including to our
Community Lending Programs and affordable housing grant programs. We’ve refined the
discounted advance products so they better align with the asset and liability management strategies
and Community Reinvestment Act plans of our members. We modified the Homebuyer Dream
Program™ so participating members can more easily direct needed funds to households on the cusp
of homeownership. And we enhanced the scoring categories in our Affordable Housing Program

           FHLBNY                                                                                2
General Fund, including adding a category called “Member Financial Participation” that rewards true
partnerships between project sponsors and the members who submit their applications.
The updated suite of products and programs shows we have been listening and learning year-round
– an effort that continued and intensified during the pandemic. Much of that listening and learning
was guided by the members of the Affordable Housing Advisory Council, who have been generous
with their time and contact lists. So, too, by our members, who have seen their ways of doing
business upended but continued to take our calls as we refined every last detail. We thank these
individuals and the range of other practitioners and experts who shared their insights.
The district’s credit and housing issues are multi-dimensional and complex, requiring a sophisticated
array of solutions. Our best individual efforts, from state and local governments to financial, non-
profit, or healthcare institutions, will not be sufficient. The FHLBNY wants to encourage greater cross
sector engagement on all the issues described in this Plan.
The FHLBNY considers the research and writing of this Plan to be essential for product development,
beyond just a regulatory requirement. I encourage readers of this Plan to reach out to me and the
FHLBNY’s team of calling officers, or to the members of the AHAC, to share your experiences and ideas.
Sincerely,
Daniel Randall
Vice President and Community Investment Officer
Federal Home Loan Bank of New York
FHLBNY 3Table of Contents
LETTER FROM THE COMMUNITY INVESTMENT OFFICER ......................................................... 2
TABLE OF CONTENTS ............................................................................................................ 4
1. EXECUTIVE SUMMARY ..................................................................................................... 5
2. CREDIT NEEDS AND MARKET OPPORTUNITIES ................................................................. 7
A. Economic development and small business credit needs .............................................................. 8
FHLBNY responses to better support members’ small business lending needs ................................. 10
B. Housing market dynamics facing FHLBNY members and their customers................................ 12
FHLBNY responses to better support members’ mortgage lending needs .......................................... 15
3. AFFORDABLE HOUSING NEEDS ....................................................................................... 17
A. Status of affordable housing in District II ........................................................................................ 17
B. Pandemic impacts and the outlook for 2021 .................................................................................. 20
C. Housing needs as identified from market research ...................................................................... 21
D. FHLBNY responses to address identified housing needs ............................................................. 24
4. TARGETED COMMUNITY LENDING PERFORMANCE GOALS............................................... 33
A. Progress toward credit needs and market opportunities............................................................. 33
B. Progress toward affordable housing needs ................................................................................... 33
5. APPENDIX ...................................................................................................................... 35
Recent FHLBNY publications .................................................................................................................... 35
FHLBNY 41. Executive Summary
Addressing the needs for meaningful credit and for affordable, high quality housing is at the heart of
the mission of the Federal Home Loan Bank of New York (FHLBNY), which serves District II: New
Jersey, New York, Puerto Rico and the U.S. Virgin Islands. In these states and territories, the ongoing
COVID-19 crisis has exacerbated needs that were already severe – from public housing that is failing
tens of thousands of residents, to student debt that is holding back a generation of homebuyers,
from zombie properties abandoned following the Great Recession, to communities decimated by
hurricanes and earthquakes.
This Targeted Community Lending Plan identifies those needs and the role of the FHLBNY’s
Community Investment products and programs in responding to the highest established priorities.
While the Plan’s publication is a regulatory requirement 1, its development is also an essential policy
process for the FHLBNY. As the Plan makes clear, significant programmatic changes and new
offerings for 2021 were generated from the market research the Plan summarizes.
The degree of uncertainty surrounding the duration of the pandemic, and its health and economic
impacts, places any market research and forward-looking strategy on unstable footing. To take one
example, will landlords ultimately press forward with eviction proceedings on millions of vulnerable
renters, once moratoria are lifted, without a plan to identify replacement tenants who have not been
themselves evicted? These kinds of questions were vexing industry-leading researchers as this
Targeted Community Lending Plan was being written.
To overcome this challenge, the FHLBNY took a two-part approach to market research and analysis:
1. On the advice of one of the industry experts consulted during the research, Coalition for the
Homeless’s Policy Director Giselle Routhier, the needs in the district as of the beginning of
2020 are assumed to be a reliable baseline, and those needs were already severe in many
areas. As the expectation is that the figures are likely to get worse, the existing data provide a
good base for making policy decisions about the highest priority needs.
2. FHLBNY staff undertook significantly more qualitative research than in recent years, conducting
interviews with senior staff of many member institutions, the members of the Affordable
Housing Advisory Council, academic researchers, and experts at advocacy organizations. These
interviewees often identified untapped sources of quantitative data, and their insights proved
valuable in determining which emerging narratives were most meaningful for the FHLBNY.
FHLBNY 5Based on this research, the FHLBNY will prioritize the following district credit needs in 2021:
• The changes in the small-business space caused by the pandemic are posing new challenges
to members, which must quickly adapt their offerings and analysis to serve their communities
in an appropriate and sustainable manner; and
• The principal challenges of low- and moderate-income mortgage lending have accelerated in
many areas in the current crisis, and members will need additional support to help
households make the leap to homeownership where possible.
Additionally, three needs in the area of affordable housing are strong targets for the FHLBNY to
address with its Affordable Housing Program:
• Greater funding and long-term protections for the most vulnerable renters, and improved
access to homeownership across the district;
• More support for wrap-around services to keep people safe and stable and let them build for
the future; and
• Incentives for investments that incorporate tenant-focused attributes that improve health and
bring down costs.
This Plan describes the FHLBNY’s analysis for each of the above conclusions. Further, it links the
FHLBNY’s strategy for 2021 to each of the identified market dynamics. As the FHLBNY continually
reevaluates the relevance and value of its Community Investment offerings, future Targeted
Community Lending Plans will assess the success of these initiatives.
FHLBNY 62. Credit Needs and Market Opportunities
The FHLBNY’s products and programs support the credit needs of the membership, which can in
turn make strategic decisions about how to use the FHLBNY’s flexible funding to support the
communities across the district.
The suite of Community Lending Programs provides members with discounted rate advances to
fund their loans for eligible purposes. These products include the Community Investment Program
(CIP), which supports housing related activities where the households’ incomes do not exceed 115%
of the area median income; the Urban Development Advance (UDA), for economic development
projects or programs in urban areas (population of greater than 25,000) and benefitting individuals
or families in areas where the median income is at or below 100% of the area median income; and
the Rural Development Advance (RDA) program, for rural areas (25,000 or less) where the tract
income is at or below 115% of the overall area. The Disaster Relief Funding (DRF) program makes
these same discounted advances available anywhere in the district with a federal or state disaster
declaration; that program is available district-wide due to the COVID-19 pandemic. The DRF was
already available in Puerto Rico following the January 2020 earthquakes in the territory.
The Homebuyer Dream ProgramTM (HDP), launched by the FHLBNY in 2019, is a grant program that
supports members’ lending activity in the low- and moderate-income mortgage market – one kind of
lending that is considered under Community Reinvestment Act exams. In the HDP, members submit
reservation requests on behalf of their mortgage customers, who are currently under contract for a
home. Those customers must be first-time homebuyers and have incomes at or below 80% of the
area median income. When a household closes on its home purchase, the FHLBNY reimburses the
member for a grant of up to $14,500 and up to an additional $500 to cover the cost of
homeownership counseling.
In the sections below, the Plan describes the credit needs in the district, particularly with regard to
small-business lending and low- and moderate-income mortgages. In addition to the present needs,
the Plan reports the findings of market research on the changing credit needs due to the pandemic,
and how those needs could look in 2021.
The products and programs offered to support FHLBNY members’ lending activity, whether for
economic development or housing, will undergo significant changes for 2021. These changes are
broadly intended to more meaningfully match FHLBNY offerings with members’ asset-liability
management practices and business planning needs. They are also expected to broaden the
availability of FHLBNY funds to members’ customers and community partners.
FHLBNY 7A. Economic development and small business credit needs
One straightforward way to demonstrate the ever-present need for credit in the district is to refer
to FHLBNY members’ utilization of the discounted advance programs. Year after year, members
demonstrate a consistent appetite for these advances. While individual member decision-making
can vary based on their access to liquidity or competing sources of funding, in general FHLBNY
discounted advances are issued at or above the level of maturities.
Figure 1 below shows the past three years of activity in the Community Lending Programs. Activity
for the core products – CIP, UDA and RDA – in 2020 is in line with recent performance; however, the
availability of Disaster Relief Funding, and in particular the ability to fund all loans originated
through the Payroll Protection Program (PPP) 2, has driven overall borrowing to a higher level than at
the same point in 2018 or 2019.
Figure 1: Discounted advances borrowed by FHLBNY members as of Sept. 30, 2020
$2,500
$2,000
$1,500
Millions
$1,000
$500
$-
June
July
November
October
January
February
September
March
April
May
August
December
2020 Cumulative CLP advances including DRF 2020 CIP, RDA and UDA
2019 Cumulative CLP advances including DRF 2019 CIP, RDA and UDA advances
2018 Cumulative CLP advances including DRF 2018 CIP, RDA and UDA advances
Just as with CIP, UDA and RDA, members seeking to borrow under DRF submit recent qualifying
loans. During the time that both DRF was available to members and that the PPP was accepting
applications – the months of May, June and July – FHLBNY members submitted 1,600 qualifying
loans to borrow under the DRF program. Of those qualifying loans, 95% were for a PPP loan.
Members were actively involved in supporting their local communities and using FHLBNY products
to make that possible.
FHLBNY 8Members’ response to the economic challenges facing their coverage areas was further
demonstrated in their rapid take-up of the FHLBNY’s Small Business Recovery Grant Program
(SBRG), deployed in response to the pandemic. The SBRG provides grants of up to $10,000 each to
eligible small businesses and non-profit organizations, identified and qualified by FHLBNY members.
Among other requirements, recipients have to document a decrease in revenue due to the
pandemic. The program launched in May 2020, with an initial allocation of $5 million approved by
the FHLBNY’s Board of Directors, and the program was extended with an additional $3 million in
July. As of the end of October, $8 million in program funds had been disbursed by 59 participating
FHLBNY members to 750 small businesses and 486 non-profits. Figure 2 below shows how members
across the district responded by selecting recipients in their areas.
Figure 2: Disbursement of SBRG funds by region
$2,130,000
$1,775,500
$1,553,000
$1,067,100
$949,000 $453,000
$810,000
$614,500
$365,000
$1,062,900 $1,100,000 $410,000 $390,000
$826,500 $349,000 $317,000
$79,500
$235,000 $107,000
$445,000
$265,500 $310,500
$175,000 $210,000
Metro-area Northern NJ Western NY Puerto Rico Central NJ Southern NJ U.S. Virgin Upstate NY
NYC Islands
Funds disbursed to small businesses Funds disbursed to non-profits
Feedback from many of the program’s grant recipients confirms that the funds were essential in
keeping businesses open and people employed. But this kind of grant program is best suited for
short-term needs, and other, complimentary efforts are required to help small businesses contend
with new economic realities over the longer term.
During the pandemic the U.S. Census Bureau deployed a survey for measuring the attitudes and
expectations of small businesses. 3 More importantly, it asked small businesses about their financial
activity. As Figure 3 below shows, many district businesses suffered financial distress to the extent
that they missed loan payments. (Loans that were forgiven or postponed were not included.) The
reported incidence was higher in Puerto Rico than in New Jersey or New York.
FHLBNY 9Figure 3: Percent of small businesses answering Yes to "Since March 13, 2020, has this business missed any loan payments?"
25%
20%
15%
10%
5%
0%
5/3-5/9
4/26-5/2
5/31-6/6
6/7-6/13
8/9-8/15
8/30-9/5
9/6-9/12
5/10-5/16
5/17-5/23
5/24-5/30
6/14-6/20
6/21-6/27
8/16-8/22
8/23-8/29
New Jersey New York Puerto Rico
Though reported missed payments have leveled off over the course of the pandemic, small
businesses remain constrained in their ability to borrow in order to maintain or expand their
businesses. This is compounded for brick-and-mortar businesses that must contend with high fixed
costs. One survey of small businesses in Brooklyn, for example, found that one-third of those
companies were at risk of closure if they did not receive rent relief during the pandemic. 4 Research
in Puerto Rico showed that small- and medium-sized enterprises were especially vulnerable because
they have disproportionately less working capital and less well-established and resilient supply
chains than those of bigger firms. 5 For these companies, taking on new debt would likely be
perceived as a high risk.
Looking to 2021, members consulted for this Plan expect the credit challenges of small businesses
to persist, as those businesses that survive through the pandemic need to adapt their operations
and offerings for remote working, social distancing, and perhaps a changed customer base. In this
atmosphere, members will need to adapt in their own ways, understanding their customers’ new ways
of doing business and tailoring products (credit and non-credit) to support customers’ evolving needs.
FHLBNY responses to better support members’ small business lending needs
Members’ utilization of the Disaster Relief Funding provides a good introduction to the mechanisms
of the other discounted advance programs. In consultations for this Plan, some members suggested
that those customers that were served by PPP may be strong targets for future cross-sell
opportunities. And while members may have considered CIP, UDA and RDA in the past, under
different interest rate environments, members may choose to reevaluate the programs given
present business needs. The discounted advances could help strengthen the value proposition for
new member activity, especially as the funds allocated to DRF are exhausted.
FHLBNY 10These members will find that there is significant overlap in the types of loans that qualify for FHLBNY
discounted advances and the lending that satisfies their obligations under the Community
Reinvestment Act. In other words, members already lend in qualified areas, and they should benefit
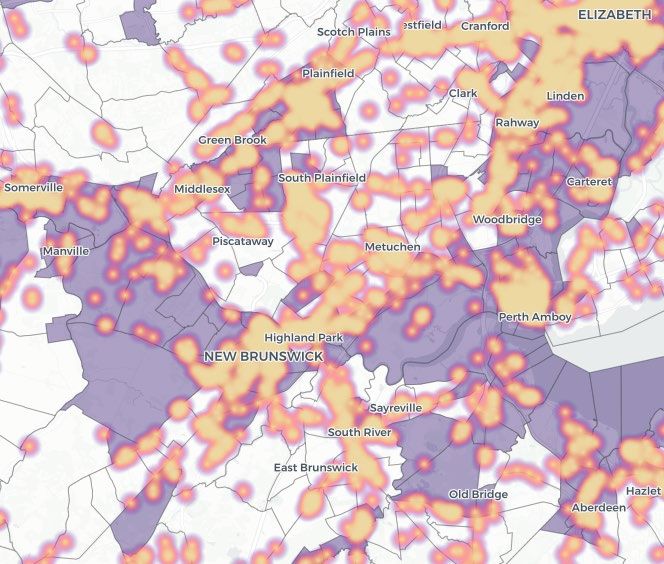
from low-cost funding if it makes sense for their needs. Figure 4 below shows maps of commercial
real estate loans originated by FHLBNY members. When FHLBNY members borrow, they pledge as
collateral the eligible assets in their portfolios, including commercial real estate loans. (This does not
necessarily mean that those loans were funded by discounted advances.)
Figure 4: Maps of commercial real estate loans pledged as collateral as of Aug. 2020
Rochester, New York New Brunswick, New Jersey
Census tracts shaded in purple are those with a median family income at or below 100% of the median family income for
the surrounding county, according to the 2018 5-year estimates in the U.S. Census Bureau’s American Community Survey.
In the areas shown on the map, a heatmap of the lending activity is overlaid on census tracts where
the median family income is at or below 100% of the median family income for the surrounding
county. There are some variations in the qualifying geographies for the discounted advance
programs; however, these map layers provide a rough approximation to demonstrate the synergy
between members’ activity and FHLBNY program requirements.
Given the potentially greater interest in the discounted advance programs, the FHLBNY will
implement several changes to make those programs more accessible and potentially meaningful.
Consultations with both participating and non-participating members in the Community Lending
Programs revealed that the programs’ complexity made it difficult to match the advances with
members’ funding needs. The complex web of borrowing limits – by month and by member –
prevented members from utilizing bulk funding, instead requiring them to break their advances over
multiple time periods.
For 2021, the programs will shift in two key ways: 1) All members will have a full-year borrowing limit
based on their asset size; and 2) Members will receive commitments of funds of 90 days from the
FHLBNY 11date of the oldest closed loan in their application. These changes should allow for the kind of
strategic planning members undertake.
In 2021 the FHLBNY also plans to make available a new discounted advance product: the Business
Development Advance. Modeled after similar programs at other Federal Home Loan Banks, the
Business Development Advance is essentially a discount fund: it uses discretionary dollars to buy
down the interest rate of members’ advances that are used to fund loans to small businesses. The
program’s intent is to give members added flexibility to adapt their offerings to their customers’
needs and financial capabilities. The program establishes a maximum spread that members can add
to those loans above their cost of borrowing. Members may choose to reduce the rate on their
advances all the way down to zero percent, allowing them to offer financing at extremely low rates
to their small business customers. Members consulted during the development of the program
were highly enthusiastic and reported that it would allow them to maintain or increase their level of
activity in the small-business market.
B. Housing market dynamics facing FHLBNY members and their customers
Going into 2020, the market for prospective low- and moderate-income homebuyers in the district
was already challenging. According to FHLBNY members and local housing counseling agencies, two
issues constrain that market:
• High rent burdens make it difficult for households to save for down payment and closing
costs, even if their income would make it feasible to pay their monthly mortgage. Academic
research has consistently shown the importance of down-payment and closing cost
assistance in allowing renters to make the jump to homeownership, with minority
households especially asset-constrained. 6 Those households that are able to make a home
purchase, likely by depleting their savings, lack sufficient reserves for significant home
repairs (and cannot borrow to do so because they are at the maximum allowable loan-to-
value or debt-to-income ratio).
• The above challenge is magnified because of the scarcity of affordable home purchase
opportunities – and much of the existing affordable stock is aging and in need of upgrades for
energy efficiency and quality. The inventory of single-family homes for sale in New Jersey had
been declining steadily for years: by 2020 it was down to about 4 months’ supply, one-fourth
of the figure from its high in 2011 7; in New York the supply had dropped from about 11 months
to about 5 months over the same period. 8 Members and counseling agencies consulted for
this Plan said it was common to have 10-15 buyers for every seller in their markets. The
competition is not all among low- and moderate-income households: a recent study of
purchases in New York City in 2019 found that 52% of homes bought for less than $420,000
were purchased with cash, which is more attractive to sellers. 9
FHLBNY 12The second of these issues took a slightly different flavor in Puerto Rico. There, the 2017 hurricanes
caused significant out-migration, leading to high vacancies. But there was (and is) still a sense of
scarcity because low- and moderate-income households suffered their own losses in income
(economic decline had also preceded the hurricanes), and many homes are not built to high quality
standards, especially problematic given the risks exposed by the hurricanes. 10
Scarcity has been evident in the U.S. Virgin Islands, as well: Inventory had been declining overall
prior to 2020, with homes at the low end of the price range declining disproportionately compared
with higher-priced homes. 11
News reporting suggests the pandemic has not abated these trends, particularly in New York or New
Jersey 12, with the flight of aspiring homebuyers leaving New York City receiving prominent
coverage. 13 Members and housing counseling agencies report that this is indeed the case: a market
increasingly favorable to sellers and competitive (or inaccessible) to low- and moderate-income
households. This is despite the perpetuation of historically low interest rates that would otherwise
be expected to be opening opportunities for this population of prospective homebuyers.
Data on home values supports the anecdotal evidence regarding the market pressures. Zillow
estimates the typical home value between the 5th and 35th percentile in each county. Those figures
show that low- and moderate-income homebuyers are faced with a continuous uphill movement
in the price of homes on the market. 14 Figure 5 below shows the data for New York and New
Jersey counties surrounding New York City. In all of these markets, homebuying is becoming ever-
more unattainable.
Figure 5: Zillow Home Value Index for bottom-tier, by county and month
New York New Jersey
$500 $400
Thousands
Thousands
$400
$300
$300
$200
$200
$100
$100
$- $-
1/1/2017
5/1/2017
9/1/2017
1/1/2018
5/1/2018
9/1/2018
1/1/2019
5/1/2019
9/1/2019
1/1/2020
5/1/2020
1/1/2017
5/1/2017
9/1/2017
1/1/2018
5/1/2018
9/1/2018
1/1/2019
5/1/2019
9/1/2019
1/1/2020
5/1/2020
Dutchess County Nassau County
Orange County Putnam County Bergen County Essex County
Rockland County Suffolk County Hudson County Middlesex County
Ulster County Westchester County Union County
FHLBNY 13The U.S.V.I., too, has seen a continued slide in the availability of affordable homes. According to data
from the Multiple Listing Service in the territory, as of Oct. 1, 2020, there had been just 50 listings at
prices under $160,000 across all three islands, a decrease of greater than 30% from the same point
in 2019. 15 Figure 6 below shows how home purchase opportunities are nearly exclusively available
to higher-income residents. 16
Figure 6: Available listings YTD by listing price in the U.S.V.I. (Oct. 1, 2020)
2019 (Oct. 1 YTD) 2020 (Oct. 1 YTD) 563
505
127 112
100 78
27 23 45 27 44 39
=$500,000
=$750k - >=$900,000These shifts in FICO scores are evident in the data for New Jersey, New York, Puerto Rico and the
U.S. Virgin Islands. However, a similar analysis of loan-to-value ratios for these loans does not reveal
such a marked shift in underwriting standards, possibly because even borrowers with ideal credit
profiles have a limit on their ability to save for down payments. A more definitive analysis of the
credit environment is difficult with existing data but should be more feasible in late 2021 upon the
expected release of the Federal Housing Finance Agency’s dataset of mortgages acquired by Fannie
Mae and Freddie Mac. 17
For existing homeowners, and their lenders, there is also considerable uncertainty going into 2021,
with the coming expiration of forbearance programs and eviction moratoria. The research firm Black
Knight reports delinquencies significantly above pre-pandemic levels in both New York and New
Jersey 18, though there are no hard data yet on how this will translate into households’ eventual
ability to pay their mortgages. In interviews, members and other industry experts predicted that the
incidence of foreclosure may be less than feared because lenders have little appetite for taking over
so many properties and trying to dispose of them.
FHLBNY responses to better support members’ mortgage lending needs
In the face of all these headwinds, low- and moderate-income households need financial support to
make the jump to homeownership, when feasible, and they also need a set of protections to reduce
the risks of their decisions. FHLBNY members can take advantage of the Homebuyer Dream
Program to support their mortgage customers in just these ways.
In 2019 and 2020, the first two years of the HDP, members submitted reservation requests, on
behalf of eligible households, on a first-come/first-served basis. In ongoing consultations with
members and their housing counseling agency partners, the FHLBNY learned that the first-
come/first-served approach, while operationally simple, introduced unintended risk to members’
lending business and the purchasing decisions of their mortgage customers.
Hence for 2021, the program will revert to an allocation approach, a popular component of the
previous First Home ClubSM program, whereby participating members will be allocated a proportion
of program funds with which to make responsible, strategic decisions together with their customers
over the course of the homebuying season. Three aspects of the allocation approach are worth
highlighting: 1) Members’ initial allocations will reflect their past usage of FHLBNY programs,
recognizing their investments and service to eligible households; 2) Members new to the program
will have a guaranteed minimum allocation, letting them test out the program with their borrowers;
and 3) The opportunity for members to grow their allocations over time will depend in large part on
their utilization of the program, meaning strong participation will be rewarded. These aspects are
intended to build the confidence of members, making the program attractive to members of varying
sizes and across the district, and in turn making the grant funds available to a broader set of
potential homebuyers.
FHLBNY 15The program will also have a lower per-household grant limit. Members may determine the grant
amount up to $10,000 per household, inclusive of $500 for homeownership counseling, a reduction
from $15,000 per household. Consider a hypothetical allocation to a member of $60,000: At the
maximum grant amount, that allocation could support six households (or six mortgages) instead of
four. Given that many members report that $10,000 is sufficient in the communities they serve, the
reduced grant amount should make the program available to more households, and it should make
smaller allocations more meaningful to new member participants in terms of mortgages supported.
FHLBNY 163. Affordable Housing Needs
The Affordable Housing Program (AHP), in partnership with the FHLBNY’s members, is the primary
mechanism through which the FHLBNY supports the housing needs in the district. Created by
Congress in 1989, the AHP provides subsidies, in the form of grant funding, to support the creation
and preservation of housing for very-low, low, and moderate-income families and individuals. AHP
funds are awarded to FHLBNY members that submit applications on behalf of project sponsors that
are planning to purchase, rehabilitate, or construct affordable homes or apartments. Funds are
awarded through a competitive process which typically takes place once a year.
The AHP must comply with and address statutory and regulatory priorities, common to all of the
FHLBanks across the country. But within that framework the FHLBNY has the flexibility and mandate
to tailor its program to the specific housing needs and market conditions of its district – New Jersey,
New York, Puerto Rico and the U.S. Virgin Islands. Like in the sections above on the district’s credit
needs, the following sections describe the existing housing needs in the district, the evolution of
those needs due to the pandemic, and the FHLBNY’s initiatives for 2021.
The FHLBNY’s 2020 Community Lending Plan discussed a growing body of research and increased
industry attention on housing as a social determinant of health. The ongoing COVID-19 crisis has
made this framework all the more persuasive and relevant. The rules for the FHLBNY’s AHP should
be viewed through this lens; the housing needs the program seeks to address are complimentary
and speak to the holistic nature of housing in the lives of low- and moderate-income residents.
A. Status of affordable housing in District II
Just as with low- and moderate-income homeownership opportunities, there is simply not enough
supply of affordable rental housing in the district. That scarcity means many district households’
budgets are stretched thin, leaving those households less able to spend on healthcare, education, or
transportation to employment; to prepare for unexpected shocks; or to save for the future. Recent
FHLBNY Community Lending Plans have described various methodologies for assessing the breadth
and depth of rental burdens, and their implications, as used by advocacy groups and industry
experts. Interested readers will find links to those previous reports in the appendix to this Plan.
What is important to consider is that, even pre-pandemic, there was a district-wide affordability
crisis going into the year 2020.
According to the National Low Income Housing Coalition’s 2020 report 19, New York has the fifth
highest housing wage in the country, and New Jersey has the seventh highest. To afford an average
2-bedroom apartment in New York, a household would need to earn $32.53 per hour, whereas the
FHLBNY 17average renter earns just $25.68. In New Jersey, the housing wage is lower, at $29.69, but the gap is
greater, with the average renter earning $19.10. Even considering that many households have
multiple wage earners, this means that a large share of both states’ populations is spending more
than the industry-standard 30% of income on housing, and often exceeding 50% of income. The
Puerto Rico housing wage is $9.36 per hour and the average renter there earns $7.73.; the U.S.V.I. is
not included in the organization’s study because the territory is not covered by the Census Bureau’s
American Community Survey.
Similarly, the pre-pandemic state of homelessness was at crisis levels and showed little sign of
improving significantly. Each year reporters for the New York Times find a new and vivid way to
illustrate that year’s statistics from New York State’s Department of Education. The most recent
article 20 in this series encapsulates how homelessness – which now affects over 100,000 New York
City schoolchildren at some point during the year – consumes children’s development.
Local organizations serving as Continuums of Care perform an annual point-in-time count of
sheltered and unsheltered homeless individuals and families and report their data to the U.S.
Department of Housing and Urban Development. (Previous Community Lending Plans document
the limitations of these counts.) In the most recent available data 21, from the January 2019 counts,
there were over 54,000 homeless households in New York, up about 3% from 2018, which saw a 5%
increase from 2017. Coalition for the Homeless analyzes data for New York City, and that
organization’s 2020 report found rising or flat numbers across all categories. 22
In New Jersey, according to the HUD data, there were 6,746 homeless households in 2019, down
slightly from 2018 but above the level from 2017. The Continuums of Care in the state coordinate
their data analysis through Monarch Housing, which allows for earlier reporting than the HUD
process. The 2020 report shows an increase in the total homeless population, driven by a 9%
increase in the population using emergency shelter. 23
Puerto Rico has seen a decline in homelessness: down to about 2,300 households in 2019 from a
high of nearly 3,200 in 2017. Surprisingly the numbers for the territory do not reveal an uptick
caused by the September 2017 hurricanes there; the 2020 count, yet to be compiled by HUD, took
place before the impacts of either the January 2020 earthquakes or the COVID-19 crisis. The
figures in the U.S.V.I. fluctuated slightly over the past three years, with just over 300 households
counted in 2019.
In each of the states and territories, the HUD data make clear that a significant share of the
homeless population has a severe mental illness, chemical dependency or other additional need
that can be addressed through the kinds of supportive services provided by many Affordable
Housing Program projects.
Issues of housing location and quality compound the ways in which lack of affordability and high
rates of homelessness burden the residents across the district. Superstorm Sandy, in 2012, and
Hurricanes Irma and Maria, in 2017, highlighted the risk climate change and extreme events pose to
FHLBNY 18vulnerable households and the expense and duration of the effort needed to recover. Industry
stakeholders rightly focus on climate resiliency to lessen the impact of future disasters. However,
the utility of considering housing’s role in residents’ health and communities’ resiliency goes beyond
rare, large-scale events. Indeed, emerging research supports a deeper, more sustained focus on the
character of affordable housing units, as opposed to the quantity of units alone.
For example, researchers recently compared redlining maps from the 1930s with today’s
temperature data and found a nearly 6-degree difference between parts of the New York City area
designated as hazardous (i.e. consigned to decades of underinvestment due to restrictions on
government loan guarantees) and those designated as the best areas. 24 Areas ring-fenced for
minorities have grown disproportionately hotter – exposing residents to numerous health impacts –
because there is less open space and tree cover and more paved surfaces, among other things.
Other reports use current income figures and identify the same connections, specifically in major
cities in New York State and New Jersey. 25 Climate change is only exacerbating these inequalities.
In addition to these direct measures of health, the impacts of climate on low- and moderate-income
households can be felt in their wallets, as these households pay a disproportionate share of their
income on utility costs. Harvard’s Joint Center for Housing Studies found, on a national level, that
renters earning $75,000 per year paid just $30 more per month for utilities than renters earning
$30,000 per year: “Under these circumstances, households might reduce food or medical expenses
to pay their utility bills, keep their homes at an unhealthy temperature, or otherwise find themselves
unable to use their heating or cooling equipment. These measures can undermine the basic health
and well-being of household members, particularly children and older adults.” 26
Two further pressures amplify the burdens of rental scarcity, widespread homelessness, and
disproportionate climate impact. First, the lifetime value of growing up and living in an area of high
opportunity is increasingly well understood, but policy choices and inertia continue to site much new
affordable housing in areas of concentrated poverty. A recent report from the Citizens Budget
Commission, for example, documents the low levels of new housing production in the affluent
suburbs north of New York City. 27 Though the report says production is somewhat higher in nearby
New Jersey towns, many have yet to fulfil their fair housing obligations, and some continue to resist
even the scope of those obligations, as the 2020 Community Lending Plan describes.
Second, funding for affordable housing preservation is not keeping pace with the eroding legal
protections for units put into service through the Low Income Housing Tax Credit and other
programs. Data compiled by the National Housing Preservation Database reveal that more than
30,000 units in New York are at risk of losing affordability protections in the next five years, as are
more than 13,500 units in New Jersey. 28 In addition to preserving the long-term affordability of these
units, many are in need of rehabilitation to maintain quality. A recent report from the Federal
Reserve Bank of Philadelphia found that in the New York-Newark-Jersey City area, 43% of rental
units and 28% of owner-occupied units have repair needs, with a total estimated cost of nearly $8
billion. 29 The report found higher per-unit needs for low-income residents of both rental and owner-
FHLBNY 19occupied housing than for middle- and upper-income residents. Another recent paper, from the Urban
Institute, makes the case that preservation should be a higher priority for housing advocates. 30
B. Pandemic impacts and the outlook for 2021
The COVID-19 crisis has certainly made the issues addressed above more visible. A whitepaper
written early in the pandemic offered hypotheses for several potential impacts on affordable
housing. 31 To the extent that quantitative data are available, they are bearing out these early
predictions. Among the most timely and relevant indicators is employment, where data continue to
demonstrate that low-income workers have been hardest hit by the economic impacts of the
pandemic, and their recovery is lagging that of higher earners. 32 Qualitative input from industry
experts points in the same direction: the district’s housing needs in 2021 are likely to be not only
more visible but more acute than they were pre-pandemic.
In the area of rental housing affordability, eviction moratoria seem to have been effective, so far, at
holding back what industry experts expect, as a recent article put it, to be a “crisis of historic
proportions.” 33 As of the writing of this Plan, Fannie Mae and Freddie Mac have extended eviction
protections 34, as has the Centers for Disease Control. 35 However, even these protections are limited
to qualified tenants, they are limited in duration, and of course they do not protect tenants from
eviction in the future if they have been unable to keep up with their rent payments during the
moratorium. 36 Local stakeholders stress that the eventual end of these moratoria should be a top-
of-mind policy concern.
Various researchers are now attempting to estimate the scale of the pending need, particularly of low-
income renters who could be on the cusp of homelessness if hit with a significant loss in income.
Some of these estimation efforts focus on capturing likely job losses in low-income or service-oriented
industries. For example, the Urban Institute applied national figures of job losses in certain industries
to census tract-level employment in those industries. 37 This followed earlier analysis by NYU’s Furman
Center to identify vulnerable occupations 38 and the number of households dependent on income
from those occupations. 39 Further research found that these households are disproportionately likely,
at least in New York City, to live in buildings with fewer units, meaning landlords are more dependent
on the income from each individual unit and perhaps more inclined to evict delinquent tenants when
able (if not via informally during the moratorium). 40 Other analysis has found households with
children 41 and older adults of color 42 to be particularly at-risk.
The highest profile estimation effort to date is from a consortium of academics and advocates. 43 It
relied in part on a new survey of behavior and attitudes deployed during the pandemic by the U.S.
Census Bureau. 44 These experts calculated over 1.2 million households in New York and over
400,000 households in New Jersey to be at risk of eviction – at the low end of their estimates. (Puerto
Rico and the U.S.V.I. were not included in the project.)
FHLBNY 20These estimations are important from a policy perspective to inform rental assistance initiatives, not
a component of current federal pandemic-relief efforts. In Puerto Rico, researchers estimated the
funding necessary to expand existing programs that provide rental vouchers to households 45,
whereas elsewhere rental assistance may be more appropriate in other forms.
Researchers are also estimating the implications of renters’ vulnerability on the future level of
homelessness. One study predicted, on a national level, a 40-45% increase in homelessness. 46 This
kind of surge would compound the pandemic-related issues already facing homeless populations
and service providers. For example, in consultation with public health experts, Coalition for the
Homeless calculated the mortality rate of COVID-19 to be 66% higher among the sheltered homeless
population than among the New York City population overall, as of August 24, 2020. 47 The causes,
especially in congregate shelters, include overcrowding and lack of access to hygiene. An academic
paper recently estimated what it would cost, on an annual basis, to increase homeless housing
capacity as experts recommend: over $747 million in New York, over $126 million in New Jersey,
over $82 million in Puerto Rico, and over $10 million in the U.S.V.I. 48
While the Coronavirus Aid, Relief, and Economic Security (CARES) Act is providing an influx of
millions of dollars to counties through the Emergency Solutions Grant and the Community
Development Block Grant Programs 49, local stakeholders express concern that these funds may be
difficult to use for communities’ longer-term strategic planning efforts around homeless housing, as
opposed to efforts strictly focused on COVID-19.
The pandemic’s impact on state and local budgets will also magnify the challenges to affordable
housing in the district. State and local governments rely not only on tax revenue (and the underlying
economic activity), but also on income from a wide range of revenue-generating activities (e.g.
institutions of higher education, hospitals, etc.). 50 Municipalities further rely on state grants, to
varying degrees. As recent research shows, many cities in the district are at risk of severe shortfalls:
Rochester, Buffalo and Syracuse are all estimated to see decreases of over 12% in revenue for the
fiscal year of 2021, even under a less severe scenario. 51 These decreases will lead to cuts in
municipal staff and services 52, and may impact governments’ abilities to offer subsidy and grant
programs or to make new investments for housing purposes.
C. Housing needs as identified from market research
The market research described above, including the quantitative reports and the insights of
members, the Affordable Housing Advisory Council, and industry experts all support maintaining the
FHLBNY’s focus on the same three housing priorities as in recent years. With the emerging evidence
from the current crisis, the FHLBNY’s understanding of those priorities has become more refined,
hence the sharpened language in Table 1.
FHLBNY 21Table 1: Housing priorities for District II
2020 Priorities Housing is just too Homelessness Climate resilience is a
expensive in nearly all remains at staggering consensus need among
areas of the district levels developers and
funders
A near universal under- The severe deficit in
supply of affordable homeless housing, The industry consensus
rental housing across the most prominently in around the need to
district, and sparse New York City, but in integrate strategies that
home-purchase various forms address climate
opportunities in many elsewhere, as well. resiliency, including
areas for low- and energy efficiency and
moderate-income disaster preparedness
households. and recovery.
2021 Priorities Low- and moderate- Eviction and The design of
income renters and foreclosure affordable housing
potential homebuyers moratoriums are impacts its
are likely to be left holding down what is contribution to
behind as recovery expected to be a wave equitable communities
begins of need for homeless
Energy costs take a
housing and
Job losses and a lack of disproportionate share
supportive services
federal rental support of low-income
are exacerbating existing The pandemic has led households’ income, and
rent burdens, while no to greater awareness of low-income and minority
new sources of funding populations at risk of communities are
are on the horizon to homelessness and how experiencing
sustain or grow the stock tenuous is the situation disproportionate effects
of affordable rental or for many district of climate change.
owner-occupied housing. households.
In the first priority above, the change to the language is intended to capture the evident divergence
in the housing market – between the choices available to higher income populations that have been
more insulated from the crisis and those available to low- and moderate-income households.
Whereas in many cases the first group is able to take advantage of the option to work remotely, and
of low interest rates, to seek out homes with better access to open space and amenities, the second
group is contending with much the same situation as before the pandemic: a severe undersupply of
high quality affordable housing.
FHLBNY 22The change to the second priority recognizes that homelessness is a real risk for households that
rely on employment from vulnerable occupations (as defined in the research discussed above,
typically occupations where face-to-face interaction is indispensable). The supply of homeless
housing and supportive services is a vital part of the social safety net not only for the high volume of
currently homeless individuals and families, but also for those who are one missed rent check away
from losing their home.
And the change to third priority brings it closer to the health and housing framework, with a more
resident-focused framing. Whereas previous Plans discussed climate resiliency and energy efficiency
as social goals, emerging research and the impacts of the pandemic have made clear that these
issues are of immediate concern to the health and wellbeing of low-income households. Consistent
heating and cooling, circulation of clean air, affordable utility bills – all these speak to housing’s role
in someone’s life. As one member of the FHLBNY AHAC put it in a recent roundtable discussion,
affordable housing should pass the “Mother Test”: Would I put my mother in it?
These priorities are all immense in scale, and addressing them comprehensively and collectively
requires the efforts of many stakeholders. While the FHLBNY’s Affordable Housing Program is
typically a gap funder – about 6% of the capital stack, on average, over the 2017-2019 rounds– its
rules and requirements can address these larger housing priorities in important ways. First, on
smaller projects, especially, the program can incentivize developers to design their projects
strategically, whether in regard to tenant mix, resident services, or in some cases even siting.
Second, by providing essential (and grant-based) gap funding, the program can increase the odds
that particular types of larger projects, with other major funders, are ultimately successful.
Within the above priorities, the AHP is best placed to work on three housing needs. Table 2 shows
the housing needs that are the focus of the program. The remainder of this section describes how
the components of the AHP’s scoring criteria work in tandem to address those needs.
Table 2: Housing needs to be addressed by the AHP
2021 Priorities Low- and moderate- Eviction and foreclosure The design of
income renters and moratoriums are holding affordable housing
potential homebuyers are down what is expected to impacts its contribution
likely to be left behind as be a wave of need for to equitable
recovery begins homeless housing and communities
supportive services
2021 Needs Greater funding and long- More support for wrap- Incentives for
term protections for the around services to keep investments that
most vulnerable renters, people safe and stable incorporate tenant-
and improved access to and let them build for focused attributes that
homeownership across the future improve health and
the district bring down costs
FHLBNY 23D. FHLBNY responses to address identified housing needs
The clarity and flexibility of the new AHP regulation encouraged the FHLBNY to not only restructure
the scoring criteria for the AHP – the mechanism by which the program ranks applicants for possible
awards – but to conduct a full-fledged evaluation. Program staff conducted extensive analysis,
surveyed current industry literature, interviewed dozens of district and industry experts, and
convened multiple sessions of a special working group of the AHAC. This research examined the
existing scoring criteria: To what extent were the criteria collectively producing a portfolio of projects
that responded to the housing needs? And to what extent was each individual category supported
by the best available evidence? (This in-depth process was a significant goal established in the 2020
Community Lending Plan.)
While many of the criteria are indeed statutory or regulatory priorities, and hence are required
elements of the program, even these categories received intense review, given that the FHLBNY still
shapes the definitions, standards, and documentation requirements.
The 2021 AHP round will score project applications against 13 criteria. The full details, including
documentation requirements, can be found in the 2021 AHP Implementation Plan, available on the
FHLBNY website. That document and the section below should be read as companions. The intent of
the categories, as well as changes from recent rounds, is as follows:
Use of Donated or This category rewards projects that receive their land or buildings at a
Conveyed significantly discounted price or through a true donation. Originally
Government- included as a statutory priority to facilitate conveyances from the
Owned or Other Department of Housing and Urban Development, the category is
Properties increasingly relevant in the current crisis.
Given the impact of the pandemic on local budgets, as well as the
predictions regarding foreclosures, more district municipalities may find
themselves needing to rehabilitate and dispose of blighted property – a
replay of the “zombie” property issue that followed the Great Recession. For
the 2021 AHP round, projects that receive a discount to 50% of the fair
market value are eligible for points in this category. In previous years, the
FHLBNY required a discount down to 30%. The intent of the change is to
make it feasible for more municipalities to access gap funding to support
their community initiatives.
Sponsorship by a Another statutory priority, this category ensures that non-profit developers
Not-For-Profit are competitive in the application phase against for-profit sponsors, which
Organization or may have more capacity and access to capital. In practice, it means that
Government nearly all AHP projects are either led by non-profit sponsors, or, in the case
Entity of projects with Low Income Housing Tax Credit funding, that for-profit
developers include non-profits in the ownership structure to some extent.
FHLBNY 24Based on the available research in this area 53, and consultation with AHAC
members, this category will remain consistent in the 2021 AHP round.
Targeting Targeting describes the income mix of a project’s residents, and, by
regulation, the category rewards projects with a commitment to deeper
affordability. At 20 points out of 100 available, this is the most valuable
scoring category, and for good reason. It ensures that projects serving low-
income residents can be viable, and by virtue of receiving an AHP award
those projects are then part of the long-term stock of affordable housing
through their retention periods.
In support of the first housing need identified above, the FHLBNY modified
the Targeting category for the 2021 AHP round in two ways: 1) Projects that
are owner-occupied and reserve at least 60% of their units for residents at
or below 50% of the area median income will receive the full amount of
points, something for which only rental projects were previously eligible;
and 2) The formula used to translate the resident mix into the number of
points for owner-occupied projects will increase the points awarded for
units above 60% and equal to or less than 80% of area median income,
recognizing that in many markets of the district the requirement for deeper
affordability is incompatible with the realities of homeownership
opportunities. 54
Table 3: Targeting treatment of owner-occupied projects
Units Units
Units >50% & >60% & Pre- 2021
≤50% of ≤60% of ≤80% of 2021 round
AMI AMI AMI score score
Project with 60%
very low-income 15 10 0 17.6 20.0
units
Project with
moderate 10 5 10 12.0 14.0
income units
Both of these changes should encourage sponsors of owner-occupied projects
to continue to look to the AHP, and allow the AHP to continue to promote low-
and moderate-income homeownership opportunities in the district.
FHLBNY 25You can also read