GETTING AHEAD OF GENTRIFICATION: 1Woodlawn
←
→
Page content transcription
If your browser does not render page correctly, please read the page content below
ABSTRACT
                                               The announcement of the Obama Presidential Center
                                               and Tiger Woods led redesign of the Jackson Park Golf
                                               Course, coupled with the continued expansion of the
                                               University of Chicago, the success of the city’s Micro
                                               Market Recovery Program and the deployment of the
                                               POAH administered thirty-million dollar Choice Award
                                               have all converged, indelibly transforming the
                                               Woodlawn neighborhood. These achievements have
                                               also unavoidably fanned the flames of displacement
                                               fear. In a community where +77% of all households
                                               are renting, that distress is not unfounded. Several
                                               studies commissioned by the Network of Woodlawn,
                                               successor to the LISC New Communities Program for
                                               this south side Chicago neighborhood, together with
                                               data compiled by the Institute for Housing Studies at
                                               DePaul University, have revealed that some 70% of all
                                               renters in Woodlawn were rent burdened in 2016.
                                               Rents since then have continued to soar. And while
                                               an estimated 33% of all households enjoy the
                                               protection of government-assisted housing, there is
                                               an uncomfortably high number of low, moderate and

GETTING AHEAD OF                               middle income renters, the “Uncomfortable Middle,”
                                               which are perilously vulnerable to involuntary
                                               displacement. The Network of Woodlawn has

   GENTRIFICATION:                             advanced several strategies to both identify
                                               vulnerable population and to advance public policies
                                               to alleviate this risk. Absent preemptive public policy,
Woodlawn’s Strategy for Managing Involuntary
                                               this neighborhood is poised to join other gentrified
                               Displacement
                                               American communities where displacement may have
                                               been contained.

                                               By: Thurman Smith, Vince Lane and Mattie
                                               Butler.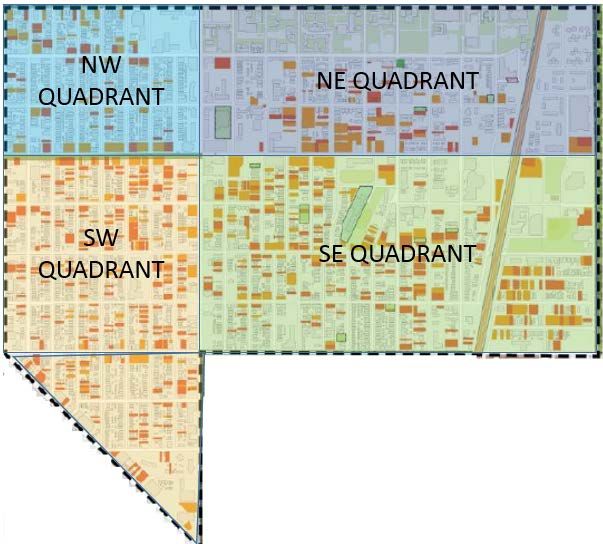
Getting Ahead of Gentrification: Woodlawn’s Strategy for Managing Involuntary Displacement

                                        TABLE OF CONTENTS
Project Overview                                                                                    2
Community Conditions                                                                                7
Population Segmentation Analysis                                                                    9
Vulnerability Analysis                                                                            11
Policy Recommendations Summary                                                                    17
Bibliography                                                                                       18

APPENDIX:

    A)   Policy Recommendations – Detailed                                                          23
    B)   Non-Traditional Resource Glossary: Funding Woodlawn Initiatives                            34
    C)   Draft Proposal to Create Woodlawn Affordable Housing Trust Fund                            35
    D)   Land Trust and Share Equity Housing (C. Holmes and C. Daas)                                39

                                        ACKNOWLEDGMENT
The primary authors of this report would like to thank Geoff Smith and Sarah Duda from the Institute of
Housing Studies (IHS) at DePaul University, Alyssa Berman-Cutler and Ianna Kachoris from the Office of
Community Engagement at the University of Chicago Office of Community Engagement, Dr. Jeffrey
Leslie, co-director of the Kreisman Initiative on Housing Law and Policy at the University of Chicago Law
School, Paula Grant – Renew Woodlawn Program Manager and Deborah Moore - Director of
Neighborhood Strategy and Planning, both from Neighborhood Housing Services, Cathy Gerlach at
Community Investment Corporation, Stacie Young, Executive Director – Preservation Compact, Kevin
Jackson and Rachel Johnston at the Rehab Institute, Skidmore Owings Merrill and Gensler for their
invaluable corporate assistance in gathering and evaluating data used in this report. And a special thank
you to Dr. Charles F. Daas of the University of Illinois at Chicago for his advice on Land Trusts and Calvin
Holmes, Executive Director of Chicago Community Loan Fund, for both his editing and advising on this
report.

                                   6320 S. Dorchester Ave.
                                   Chicago, IL 60637
                                   www.thenetworkofwoodlawn.org.

                                                                                                 1|Page
Getting Ahead of Gentrification: Woodlawn’s Strategy for Managing Involuntary Displacement

      IMMINENT DISPLACEMENT RISK: As used herein, a neighborhood is deemed to be
      imminently vulnerable to wide-spread displacement when all of the following hold true: 1)
      both home values and rents are increasing materially faster rate than the city as a whole, 2)
      the neighborhood median income is < 60% of citywide median, 3) more than 33% of the
      residents are already severely housing cost-burdened, and 4) more than 20% of the
      population are renters with household incomes < 80% of area median but do not reside in
      government-assisted housing. Woodlawn demonstrates all of these characteristics.

PROJECT OVERVIEW
The primary intent of this study is to determine the form, magnitude and timing of events in Woodlawn
which, if left unaddressed, could lead to either involuntary displacement or blockage (inability to enter a
neighborhood due to affordability). This report will also describe the methodology and data used and
includes stress testing to identify specific tipping points where identified population segments become
severely housing cost-burdened 1,2 and thus more likely to exit 3. The report will not examine race but
does accept well-known correlations between race and income in Woodlawn and the city as a whole.

Largely using census based demographic reports, we have identified three principle dimensions for
evaluating displacement data: 1) renters (both those residing in government-assisted/income-restricted
housing and those in market-rate units) and owners, 2) income level (Low, Moderate, Middle and
Upper), and 3) life stage (Type A - households headed by either a senior (age 65+) or person living with a
disability or Type B – non senior or disability qualified head of households)).

Our analysis uses 2016 as a base line, a year that intentionally coincides with the announcements of the
Obama Presidential Library and Tiger Wood’s redesign of the Jackson Park and South Shore golf courses.
It also coincides with a massive deployment of neighborhood improvement capital by the University of
Chicago 4 and all of the local elementary schools on track to achieve a Level One or better status 5. There
is also a plethora of data demonstrating that 2016 was an inflexion point, one where Woodlawn home
values and rental costs turned markedly upward after a glacial recovery from a tsunami of foreclosures
and the painful duration of the area’s elevated and sustained unemployment.

1
  Rent Burdens: Rethinking Affordability Measures, HUD, (n.d.). Retrieved February 01, 2018, from
https://www.huduser.gov/portal/pdredge/pdr_edge_featd_article_092214.html
2
  Schwartz, M., & Wilson, E. (n.d.). Who Can Afford To Live in a Home?: A look at data from the 2006 American
Community Survey, U.S. Census Bureau, Retrieved February 16, 2018, from https://www.bing.com/cr?IG=
5886678FDB684B1BB382E2AC5C23B0AE&CID25E23B404BC06D82384730D84A6F6C10&rd=1&h=VK3oYrxRe-
mANBkmf9ekbJTDLA7rhhKk0_azCE5pf6I&v=1&r=https%3a%2f%2fwww.census.gov%2fhousing%2fcensus%2fpublic
ations%2fwho-can-afford.pdf&p=DevEx,5065.1
3
  The State of the Nation's Housing 2017. (n.d.). Retrieved February 05, 2018, from
http://www.JCHA.harvard.edu/research/state_nations_housing
4
  Gensler (2017, March 7), Woodlawn Neighborhood Master Plan, Chicago, IL., Retrieved January 30, 2017 from
http://1woodlawn.com/wp-content/uploads/2015/10/Gensler-
WoodlawnNeighborhoodIndicatorsPresentationNov3.pdf
5
  Edwards, L. (2017, May 04). Alderman Report Card: Leslie Hairston. Chicago Defender, Retrieved February 04,
2018, from https://chicagodefender.com/2017/05/03/alderman-report-card-leslie-hairston/

                                                                                                 2|Page
Getting Ahead of Gentrification: Woodlawn’s Strategy for Managing Involuntary Displacement

From this base, we were able to gauge the magnitude of housing cost escalations required before any of
the housing segments reached a severely cost-burdened condition. As used herein, severely cost-
burdened (SCB) observes the HUD standard, further defined as the point at which median housing costs
(mortgage + taxes + property insurance + utility costs, or rent + utility costs) exceeds 50% of the median
income thresholds for a population segment. We were particularly looking to identify the tipping points
where 20% and 50% of any segments becomes SCB classified and thus more pressured to leave.

To be clear, the Joint Center for Housing Studies of Harvard University (2017) reports 6 that “32.9% of all
US households are housing cost-burdened.” This suggests that a housing cost-burdened condition alone
will not necessarily drive displacement. It further implies that households rationalize and adapt to that
cost burden condition and for a wide range of reasons. However, the concentration of SCB households
is not as pervasive. JCHA goes on to explain that concentrations of severely cost-burdened households
varies widely across US cities, with most under 20%. Mindy Ault (2015), Social Science Analyst at U.S.
Department of Housing and Urban Development, however, cites more explicitly that less than 15% of all
US Households are living in this severe condition 7 compared to plus 42% in Woodlawn.

This all, of course, raises the obvious question; at what point do severely cost burdened household, and
particularly lower-income households with fewer options, actually begin to exit a community and how
long does this exodus take before gentrification is acknowledged?

The simple truth is we don’t know. The predictive analytics required to address the wide array of
economic and behavioral factors simply do not exist. Absent a definitive model, we elected to test for
“Imminent Displacement Risk,” as defined above. This test concentrates on the likelihood and
magnitude of any population segment being pushed out solely based on cost burden, and ultimately,
leveling off at more normalized SCB levels of 15% to 20%.

The U.S. Census Bureau, consistent with this approach, concludes that the most severely housing cost-
burdened cities 8 in the U.S., cities which in turn are a sum of their neighborhoods, gravitate towards an
implied equilibrium where severely cost-burdened household generally top-out below 20%. The notable
exception again are low and very-low income communities where severe housing cost burden is a
consistent reality – discussed later in this paper.

One might add that this cost avoidance behavior suggests that moderate and middle households elect to
move, even if begrudgingly, to areas where the housing burden falls below 50% of income.

6
  Joint Center for Housing Studies (page 5)
7
  Ault, M. (2016, February). An Annual Look at the Housing Affordability Challenges of ... Retrieved February 5,
2018, from
http://www.bing.com/cr?IG=661347F654CF4E319BC8F3A7F0B97479&CID=17A7173A963F6ECF01551CB797906FB
D&rd=1&h=K-JcsqudEYqQnKWdo_pEseADizXli96jnTg5Zyydj-
k&v=1&r=http%3a%2f%2fwww.vtaffordablehousing.org%2fdocuments%2fresources%2f680_Landscape2011brieffi
nal.pdf&p=DevEx,5063.1
8
  Josephson, A. (2016, April 12). Severely Housing Cost-Burdened Cities. Retrieved February 05, 2018, from
https://smartasset.com/mortgage/the-most-and-least-severely-housing-cost-burdened-cities

                                                                                                    3|Page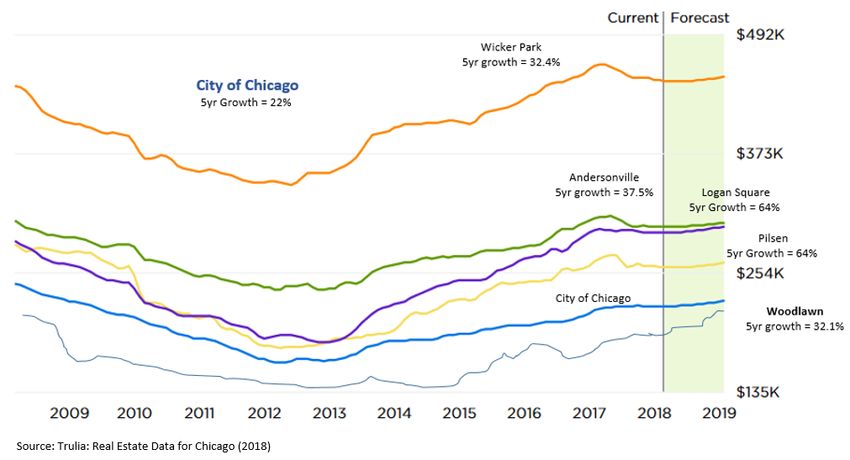
Getting Ahead of Gentrification: Woodlawn’s Strategy for Managing Involuntary Displacement

Thus, applying a 20% threshold as a meter, one can stress test for neighborhood tolerance levels that
might precipitate displacement. At a 50% threshold, we assume the likelihood of exiting is heightened
sufficiently to more forcibly drive an out-migration. To test this, we have introduced the Woodlawn
Expulsion Index (WEI), as a predictive tool, to gauge the magnitude of housing cost movements required
to push a population segment into the severely cost burdened category and thus define specific points
or stages where aggregate households migrate into early, middle and late stage displacement 9.

More specifically, median home prices and rents were stressed/increased in line with percentage hikes
forecasted for the neighborhood by Trulia 10. Noteworthy is that since 2016, Woodlawn’s median home
price increases mirror early stage increases (in percentage terms) observed in other Chicago
communities that were classified as “gentrified neighborhoods” between 2000 and 2017. More
specifically, we are referring to the increases realized across four Chicago Neighborhoods
(Andersonville, Wicker Park, Pilsen and Logan Square) where gentrifications has occurred.

IHS defines the level of said escalations as high magnitude increases (meaning > 21.6% change). As
observed by Trulia (2018) below, the median 5 year price increase was greater than 30% in each of the
gentrified neighborhoods compared to 22% for the city. For East Woodlawn (West Woodlawn not
available) more than half of that growth occurred between 2016 and 2018.

In each of the comparative gentrification cases, the neighborhood median income also rose dramatically
over the study period (2013 to 2016). Given a relative flat level of inflation and median income growth
for the city, the neighborhood changes observed in the chart below, suggest an the in-migration of
higher-income families and the implied out-migration of lower-income families. In each case, the local
communities and press rather uniformly agree that gentrification occurred and was accompanied by an
exodus of lower-income families, and in many cases, households of minority ethnicities. Noteworthy is

9
  University of Illinois at Chicago, Nathalie P. Voorhees Center for Neighborhood and Community Improvement.
(2015, March). Gentrification & Neighborhood Change: Helpful Tools for Communities. Retrieved February 16,
2018, from https://www.voorheescenter.com/gentrification-index
10
   Real Estate Data for Chicago. (n.d.). Retrieved February 28, 2018, from
https://www.trulia.com/real_estate/Chicago-Illinois/market-trends/

                                                                                                    4|Page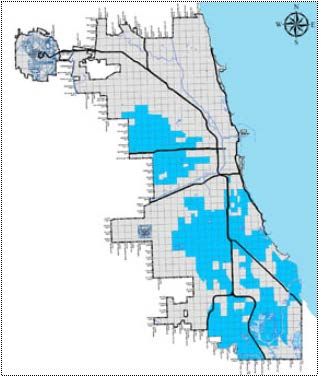
Getting Ahead of Gentrification: Woodlawn’s Strategy for Managing Involuntary Displacement

that the gentrification in Pilsen and Andersonville started prior to 2013 and since then income growth
has stabilized at near or below the city averages (meriting additional exploration).

Also noteworthy is that Woodlawn, since 2015 has shown a median income increase of roughly 13%
compared to 7% for the city. When coupled with the relative small increase in households, we had to
examine where this growth was coming from. The not so surprising observation was a slight increase in
both the number of upper-income holds and lower-income households. Upper-income households in
Woodlawn (defined using the IHS meter at $75,000 and above) increased .2% while lower-income
households increased by 1.1%. Geoff Smith (2018) explains again that “the growth in lower-income
household is most likely the growth in the student population.” Some of this is also explained by
families now accommodated in the government assisted units added by POAH.

Source: IHS (2018)

Noteworthy is that median incomes in these neighborhoods also changed dramatically and presently
median household incomes for the study group, except for Pilsen, are all increasing more sharply than
the city. Given known CPI adjustments to income, the change in the study area implies that lower-
income households were replaced with more affluent households – a classic displacement indicator.

THE GREYNESS OF FAIR MARKET RENTS AND SECTION 8
Fair market rent measures for Woodlawn merit some discussion, in part because there is some overlap
in census tracks and zip codes which include the more affluent and neighboring Hyde Park markets. In
fact, the 60637 zip code is roughly 20% weighted by Hyde Park. The consequence is that median rents
are nudged higher by Hyde Park markets and create an opportunity for Woodlawn lessors to enjoy
Section 8 rents which are higher than market rents otherwise realizable in certain parts of Woodlawn.

                                                                                              5|Page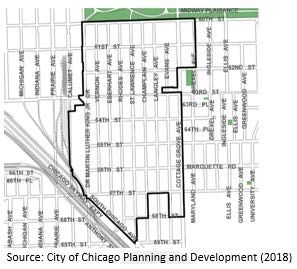
Getting Ahead of Gentrification: Woodlawn’s Strategy for Managing Involuntary Displacement

                                     West              East                                   Weighted
                                   Woodlawn          Woodlawn          Hyde Park       (HP 20% / Woodlawn 80%)
Market for 2 Bedroom Unit           $1,040            $1,625            $2,350                $1,565.25
HUD 110% rent cap                   $1,210            $1,210            $1,210                 $1,210.0
Gap between Market & HUD             $170             ($415)            ($1,140)                 ($355)
Section 8 Premium                     YES               NO                NO                       NO

That premium, however, has largely reversed itself in east Woodlawn which has enjoyed substantial rent
appreciation during the last 24 months. West Woodlawn and the most southern parts of East and West
Woodlawn, which overlap the LMI communities of Park Manor, Grand Crossing and South Shore remain
at the low end of this rent spectrum.

The Section 8 tenancy also creates a level of revenue or payment stability that many landlords
appreciate. The combination of a rental premium and stability give some reason to believe that
landlords are not likely to exit the Section 8 market. However, as the gap between market rents and
Section 8 caps increases, that argument weakens measurably. East Woodlawn has reached that point.

POPULATION GROWTH IN CONTRAST TO REGIONAL POPULATION LOSSES
There is an abundance of literature demonstrating that the Chicagoland region has and continues to be
experiencing population losses 11. Despite this, the population in Woodlawn grew during this period as
previously observed by Geoff Smith and Sarah Duda at IHS.

Further supporting this expectation of population growth is the number of vacant residential properties
acquired with intent to repopulate, as evidenced by both rehab activity and 1QTR2018 sales
Realtor.com, plus the profile of West Woodlawn units sold in 2017 by Neighborhood Housing Services.

11
  Eltagouri, M., & Wong, G. (2017, March 24). Chicago area leads U.S. in population loss, sees drop for 2nd year in
a row. Retrieved March 23, 2018, from http://www.chicagotribune.com/news/local/breaking/ct-chicago-census-
population-loss-met-20170322-story.html

                                                                                                       6|Page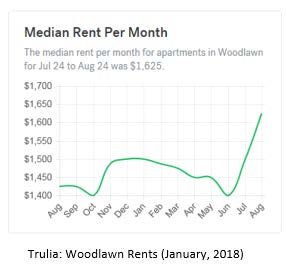
Getting Ahead of Gentrification: Woodlawn’s Strategy for Managing Involuntary Displacement

Realtor.com reports 213 properties making up more than 240 units were sold in the first three months
of 2018 12. The combination of increased rehabbing and sales, with a record high sales price of $599,000
single family home price reported in March, 2018 support the expectation for continued population
growth and a shift in the economic demographics, including an increase in the ownership ratio.

                                 Source: Realtor.com

THE UNIQUE CASE OF LOW-INCOME FAMILIES
Uniform across a broad series of studies is that low-income households that do not enjoy access to
income subsidized housing are measurably more likely to be severely cost-burdened. JCHA (2017), by
way of example, cites that 70.3% of the lowest-income households (earning under $15,000) would be
characterized as severely housing cost-burdened. It is also understood that only a fraction of all low-
income households reside in project-based rental units. And while those not accommodated in project-
based assisted housing may still have Section 8 or other assistance units, SCB may still be a daily reality.
And while this observation applies to both owners and renters, renters are singled out because of the
added vulnerability to landlord changes in preferences which can lead to resident evictions.

JCHA goes on to explain that “the share of renters with severe burdens varies widely across the nation’s
100 largest metros, ranging from a high of 35.4 percent in Miami to a low of 18.4 percent in El Paso.

12
  Illinois. (n.d.). Retrieved March 23, 2018, from
https://www.realtor.com/soldhomeprices/Woodlawn_Chicago_IL/pg-2

                                                                                                 7|Page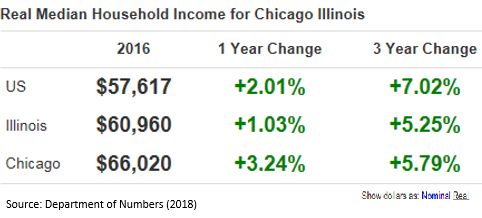
Getting Ahead of Gentrification: Woodlawn’s Strategy for Managing Involuntary Displacement

While most common in high-cost markets, renter cost burdens are also widespread in areas with
moderate rents but relatively low incomes.” Recall again that IHS characterizes Woodlawn in this way.

However, in Woodlawn, some 3,141 of a total 9,629 households (Gensler, 2018) making up roughly
32.6% of the community and nearly 2/3rds of all low-income households in the neighborhood, are
accommodated in income-restricted housing. One could conclude that they are somewhat immune to
the effects of gentrification. On the other hand, this suggests that it is necessary to examine when said
housing protections expire in order to identify both the magnitude and timing of the related
vulnerability to housing losses should such income restriction be allowed to lapse.

As noted below, affordability covenants on an estimated 976 units expire before 2023 (some may have
been renewed since 2016). Failure to extend these would impacting an estimated 10.4% of all
household by 2023. More concerning is that the fact that some 40% of all subsidized units reserved for
seniors and people living with disabilities expired or will expire in less than 5 years 13. “This vulnerability
alone bolsters the argument for establishing the community as a conservation district (Holmes, 2018) 14.

To be clear, traditional databases for verifying extensions of income-restrictions are often stale dated
and the data continuously changes. Collection methods also vary or are based on sampling over
multiple years – as is the case with the American Community Survey (ACS). We manually compiled our
list of income-restricted housing by merging data from HUD, The Illinois Housing Development Authority
(IHDA), Chicago Housing Authority (CHA) and the National Low-Income Housing Association (NLIHA).
We also asked POAH and the Chicago Rehab Institute (CRI) and the Preservation Compact to review and
opine on the same to strengthen the glossary. Together we have compiled the chart on page 9.

What we have clearly suggests that continuously addressing renewals of the affordability covenants
must remain a priority – one that is already being policed under the city’s Affordable Housing
Preservation Ordinance (AHPO).

13
   National Housing Preservation Database. (2018). Retrieved February 27, 2018, from
http://nhpd.preservationdatabase.org/
14
   Holmes, C. (2018, March 7). Woodlawn Subcommittee on Displacement - Request [E-mail to the author].

                                                                                                    8|Page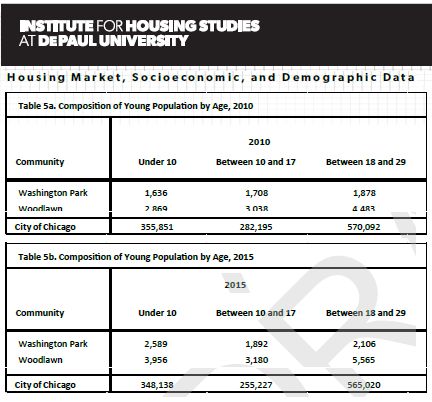
Getting Ahead of Gentrification: Woodlawn’s Strategy for Managing Involuntary Displacement

Source: Blend of National Housing Preservation Database (2018), POAH. HUD, IHDA, CHA, CRI and Preservation Compact

                                                                                                            9|Page
Getting Ahead of Gentrification: Woodlawn’s Strategy for Managing Involuntary Displacement
It should also be again be noted that there are also several new income-restricted developments in
planning or under construction and multiple privately financed market-rate rental and for-sale
developments in progress – all of which are also changing the population totals and distribution as well.
The not yet completed POAH properties, including its 22-unit “Washington” development is included.
Also, the vast amount of vacant but city controlled land creates an opportunity to create more
affordable and workforce housing to offset units lost. But, the underlying vulnerability is still significant.
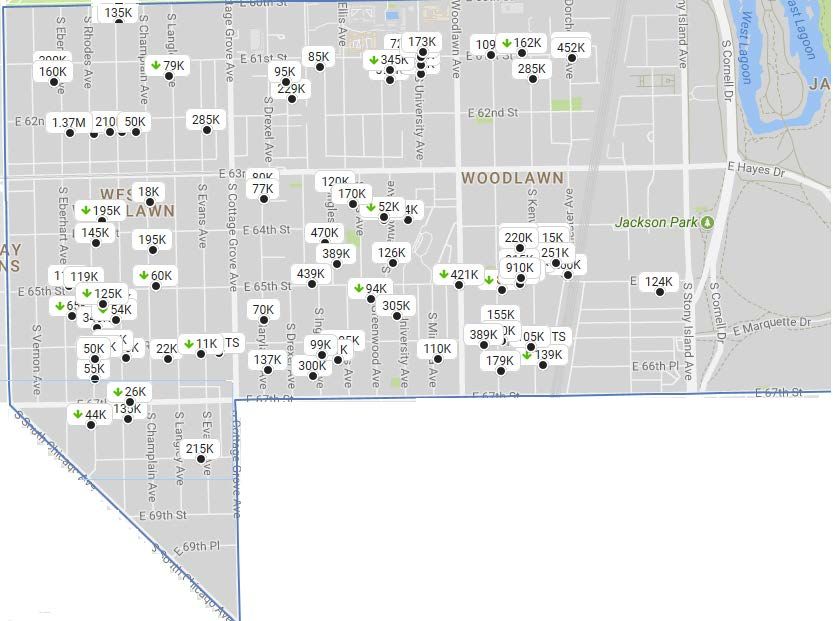
COMMUNITY CONDITIONS:
The community of Woodlawn has organized itself along the geographic boundaries of 63rd Street,
running east and west, and Cottage Grove, running north and south, to create four quadrants, each with
its unique socio-economic profile. Guided by the Network, each quadrant has its own community
planning committee and is headed by a resident leader. That leader in turn serves as part of the
broader Network of Woodlawn’s (NOW/the Network) Partnership for Economic Development (WPED)
leadership committee. Each quadrant, armed with NOW resources, was charged to identify its own
priorities, inventory community assets, create its own plan, maintain neighborhood communications
and share the responsibility of implementing programming. More than 400 residents are participating
in this community led planning and economic development process.
In 2016, NOW commissioned Gensler, one the
nation’s most respected integrated
architecture, design, planning and consulting
firms to conduct an assessment of the
neighborhood’s current condition and to
identify and prioritize logical next steps for
revitalization by quadrant. The Network
expanded on this research by commissioning
Skidmore Owings and Merrill (SOM) to advise
the community on how to conduct its own
independent research. This included
identifying the various resource utilities
available to access census, property ownership
and other data required for a critical
examination and forecasting process. This
work overlapped unrelated but highly relevant
studies completed by the Institute for Housing
Studies (IHS) at DePaul University. The IHS work centered on displacement pressures in Chicago.
Together, these works have served to frame what many Woodlawn resident already knew anecdotally,
gentrification is coming quickly and the risk of involuntary displacement is real. This belief runs in
contrast to traditional backwards-looking displacement theories that do not acknowledge gentrification
until after a population has been displaced en masse. Instead, the community-shared belief is founded
on the observation that perhaps gentrification occurs unevenly over time and often in more subtle
bursts that are easily ignored. Because of this, we have chosen less traditional but measurably more
current data sources to peg and project housing cost increases. The Multiple Listing Service (MLS) and
Recorder of Deeds are chief among these.
10 | P a g eGetting Ahead of Gentrification: Woodlawn’s Strategy for Managing Involuntary Displacement
To be clear, the research, from IHS in particular, confirmed that some 70% of all residents residing in
Woodlawn were already housing cost-burdened in 2016 15. The Gensler study 16 further revealed that
roughly 61.8% of all housing units were rented, with another 22.4% of all units or sites vacant, making
homeowners a meager 15.7% of total Woodlawn households. Gensler also pointed out that “at a
median neighborhood income of $22,184, 32% of all household fell below the federal poverty level.”
Gensler further explained that through 2015, “population growth in the neighborhood had been positive
but slightly lower than the city average”, some of this the trailing effect of massive foreclosures.
Population growth between 2010 and 2015 is estimated at 13% 17 with stagnant home sales activity.
That trend however reversed abruptly after the Presidential Library Center was announced in 2016.
Since the announcement, home value have increased and rental hikes have been noteworthy.
According to Sam Cholke at Chicago’s DNA Info 18, Redfin (sales-based) estimates Woodlawn home
values went up by 23% in the first six months of 2017, a rate far faster than the 4.6 percent increase in
value for the Chicago area as a whole. RedFin’s year end estimate was 46% 19. Trulia 20 likewise estimates
that the value hikes reflect another 18% hike for 2018 while rents spiked 14% between August 2017 and
August 2017.
The value and rental hikes do not bode well for lower and moderate income segments which are already
housing cost-burdened and that do not have access to subsidized housing. On the other hand, one
might argue that there is still plenty of affordable inventory. To this end, the same Trulia and RedFin
surveys suggest the area still lags other prime communities with a meager median home price of $100K
to $119K. Likewise, Gensler highlights that 22.4% of the homes were vacant. That number is dwindling
and undescores, in part, the Network’s concern that early stage gentrification has set in and that the
traditional data to evidence it has not yet been reported. Said another way, the lag in data collection
does not mean the problem does not exist.
Organizations like Neighborhood Housing Services (NHS), levering funding from the Choice Award, the
Attorney General and other charitable sources, was able to offer first time buyer incentives – all with
long term affordability covenants. In partnership with the Preservation of Affordable Housing (POAH)
under a collaboration called Renew Woodlawn, NHS also offers property discounts, rehab and term
financing for underserved families. According Kristin Faust, Executive Director at NHS, Renew
15
Institute for Housing Studies (2017, December). Displacement Risk in Chicago. Retrieved February 16, 2018, from
https://displacement-risk.housingstudies.org/
16
Gensler (2017, March 7), Woodlawn Neighborhood Master Plan, Chicago, IL., Retrieved January 30, 2017 from
http://1woodlawn.com/wp-content/uploads/2015/10/Gensler-
WoodlawnNeighborhoodIndicatorsPresentationNov3.pdf
17
Affordable Housing Partnership Exceeds Goal in Efforts to Lead Neighborhood Revitalization in Woodlawn. (n.d.).
Retrieved February 09, 2018, from http://www.poahchicago.org/news/affordable-housing-partnership-exceeds-
goal-efforts-lead-neighborhood-revitalization-woodlawn
18
Cholke, S. (2017, September 12). Woodlawn Home Values Soar As Obama Library Draws New Interest to Area.
Retrieved January 30, 2018, from https://www.dnainfo.com/chicago/20170912/woodlawn/home-values-increase-
redfin-barack-obama-presidential-library-center-prices-real-estate-markets-hot-jackson-park
19
Redfin, Retrieved January 30, 2018 from https://www.redfin.com/neighborhood/29328/IL/Chicago/Woodlawn
20
Woodlawn Real Estate Market Overview. (n.d.)., Trulia, Retrieved January 30, 2018, from
https://www.trulia.com/real_estate/Woodlawn-Chicago/2970/
11 | P a g eGetting Ahead of Gentrification: Woodlawn’s Strategy for Managing Involuntary Displacement
Woodlawn has already rehabbed and sold 28 homes, all in the western most quadrants, and has more in
its pipeline. NHS’s report also illustrates that three quarters of the homes were sold to non-Woodlawn
residents, and all sales were to moderate-income families earning less than 120% of AMI.
That reactivation of the western and lowest income quadrants, as a place of choice for the middle-class,
is of particularly good news to residents. As Gensler (2016) points out, Woodlawn’s population is highly
concentrated in the eastern quadrants, including the POAH development along Cottage Grove and the
University of Chicago dormitories on Ellis Avenue. The eastern most quadrants, bordering the University
of Chicago, Jackson Park, the lake front and the Obama
Presidential Center, are projected to account for
approximately 60 percent of the population by 2020
Household and family sizes in the Woodlawn
neighborhood are lower than the city wide average of
2.67. This is partially due to much smaller households and
families in the more densely populated south eastern
quadrants.
The Network is quick to point out that perception
about the area’s school system may have
contributed to why families migrated out of or
elected not to migrate into the neighborhood. But even that has changed. In 2017, all four of the area’s
elementary schools were rated Level or Level 1 or Level 1+s, the benchmark for highest performing
schools. Most authorities consider the performance of elementary schools as a key motivator of home
purchase or renting and as such can be a contributor to an area’s gentrification.
Gensler also highlights that the western most quadrants also have a higher concentration of low income
households with roughly 36% living below the federal poverty level and the lowest household income
levels.
POPULATION SEGMENT ANALYSIS:
The data identified 17 distinct population
sub-segments, four of which are both very
small and upper income. Because of the size
and resilience to the stress level
contemplated, we intentionally de-
emphasized the upper income segments in
the analysis. Likewise, as one may have expected, low and moderate-income segments were both very
large and very sensitive to even small increases in cost. The related LMI segments also carried with it a
relatively large inventory of project-based, income-restricted housing. As a result, we condensed these
12 | P a g eGetting Ahead of Gentrification: Woodlawn’s Strategy for Managing Involuntary Displacement
into a singular category for Eligible Low income Renters (ELIR) which are renters currently
accommodated in long-term, income-restricted units. The ELIR segment was insensitive to price
movements and instead vulnerable to the lapse of protective covenants. We appropriately gauged this
segment relative to the risk of covenant expiry.
This left those LMI household (owners and renters) that were not accommodated in income restrictive
housing, where cost sensitivity was most noteworthy and thus stress tested.
It should be noted that Woodlawn’s population grew between 2010 and 2015, but this growth was
largely in household size versus the number of new households. According to Geoff Smith (2018) 21 at
IHS, Woodlawn’s “population growth between 2010 and 2015 was largely driven by residents under age
10 (1,087 increase) and young people between ages 18 and 29 (1,082 increase). These numbers are
from Tables 5a and 5b of the Housing Market, Socioeconomic and Demographic data set shared. This
growth in young people is also serving to migrate the neighborhood closer to city norms.
Geoff (2018) explains that “it’s hard
to know if the growth in population
between 18 and 29 was driven by
University of Chicago (U of C)
students without further analysis.
But, a few things to note from our
data report that might help us make
a more educated guess:
Poverty increases - Another area of
growth in Woodlawn was in
population below the poverty level
which increased from 6,556 in 2010
to 10,062 in 2016. This growth in
population below poverty is likely
the function of a few things. It could
be families in poverty moving to
Woodlawn from other parts of the
city. It could be families that were in
poverty in Woodlawn in 2010 had
children, therefore increasing the population below poverty. It could also be families or individuals living
in Woodlawn who were not in poverty in 2010 are now in poverty. However, it could also be U of C
students.
Households flat - While population increased in Woodlawn by nearly 2,900, the number of households
increased by only 160. This would indicate that population increases did not lead to a ton of new
household formation, but rather shifts in the composition of households living in Woodlawn. If you look
at Table 2a, this gives a sense of how this plays out by income. There was substantial growth in
households earning less than $50,000. This could include households in poverty. It could also include U
21
Smith, G. (2018, February 20). Woodlawn Info NOW Tech Asst_Draft_small.pdf [E-mail to the author].
13 | P a g eGetting Ahead of Gentrification: Woodlawn’s Strategy for Managing Involuntary Displacement
of C students. There was a large drop in middle income households earning between $50,000 and
$75,000 per year, and there was a small increase in households earning more than $75,000. My guess
would be that increases in this higher-income group was the product of U of C employees, but probably
not students.”
NOTEWORTHY SEGMENT ATTRIBUTES:
Given that Woodlawn’s concentrations of low and moderate-income households is so pervasive (2016
census) – making up over 78% of the population coupled with a relatively modest middle income
population, sensitivity to cost far outweighed other risk factors as a priority displacement driver for the
neighborhood. Additionally, seniors (along with people living with disabilities) had the added
vulnerability to nearer term lapses of government-assisted housing contracts or expiry of governmental
loans.
Low, Moderate and Middle Income Non-Seniors (Renters and Owners): The population segment of
Woodlawn jumped dramatically in 2016, but a large part of this was the 787 students that were
accommodated in dormitory units developed by the University of Chicago. Per Gensler (2016), this
student population was largely migrated in from neighboring Hyde Park when the university
simultaneously sold a portion of its multi-family property inventory (also mostly Hyde Park but with
some in Woodlawn). We eliminated the dormitory population from our analysis.
The remaining residents in this segment include families and more than a third were young families
(those with a three year old enrolled in school), notwithstanding that per Rev. Byron Brazier (2018) 22,
head of the Network of Woodlawn, more than half of all school-aged children residing in Woodlawn are
enrolled in schools outside of Woodlawn.
It should be noted that the average family size in Woodlawn is slightly lower than the city as a whole.
Per Gensler (2016) and HIS (2017), this is the largest segment in Woodlawn and it carries a medium
income of less than $26,000 compared to $66,020 for the city as a whole as defined by the Department
of Numbers 23 extract from the U.S. Census for 2016.
This segment is also largely renters concentrated in two
groups: ELIR, Non-Eligible Low to Moderate-Income Renters
(NELMIR) – not housed in government assisted housing but
some of which utilize Section 8 vouchers in market rate units.
It is this latter group that has historically been the most
vulnerable to eviction should properties sell or the owner
elects to otherwise reposition the property – in both cases evicting LMI renters.
Seniors: According to IHS (2018), roughly 10.9% all Woodlawn residents were seniors in 2015. This
accounts for roughly 2,886 people compared to roughly 872 government-assisted housing units set
aside for either seniors or people living with disabilities. Of course, there are other government-assisted
22
Dr. Byron Brazier on Education in Woodlawn [Personal interview]. (2018, February 8).
23
Chicago-Naperville-Joliet Illinois Household Income. (2017). Retrieved February 23, 2018, from
http://www.deptofnumbers.com/income/illinois/chicago/
14 | P a g eGetting Ahead of Gentrification: Woodlawn’s Strategy for Managing Involuntary Displacement
units that accommodate seniors and some seniors reside in market rate units that accept Section 8
vouchers.
To get at the number of seniors hat are homeowners we have asked the County Assessor to report the
number of households claiming a senior exemption. That data is not yet available.
For the homeowner segment, we are looking to identify seniors, many of which are fixed-income, who
would self-characterize themselves as highly vulnerable to housing cost escalations, most notably
deferred maintenance costs, taxes insurance and utilities. This vulnerability is validated across an
abundance of literature and by AARP as cited by SeniorAdvisor.com (2018) 24.
Non-ELIR Senior Renters, were also readily identified in our analysis as a sub-segment which merits
more exploration. The combination of fixed-income attributes coupled with the relative shortage of
housing units specifically dedicated to seniors, merit this focus.
WOODLAWN DISPLACEMENT VULNERABILITY ANALYSIS:
There are several questions we have attempted to address in this analysis:
• Which population segments are vulnerable to displacement or blockage due to cost burden?
• What happens if a rebalancing occurs, one where the mix of renters and owners migrates to one
reflective of the city (say 50% owners and 50% renters)?
• What vulnerabilities arise should current income restrictions on the neighborhood’s low-income
housing inventory be allowed to lapse?
This analysis is being completed to inform the most appropriate public policies and economic
development strategies pursued by the community and its stakeholders.
Vulnerability to Housing Cost Burden:
There is an abundance of literature demonstrating the high concentration of low-income families in
Woodlawn. The most recent reports from IHS (2018) suggest that +77% of the population is housing
cost burdened and that nearly 42% of all renters were severely housing cost burdened. Our intent was
to determine the threshold at which more than 50% of any income segment would become severely
housing cost burdened. To do this, we found it necessary to determine and view affordability by
household size.
24
Chicago Low-Income Senior Housing. (n.d.). Retrieved February 09, 2018, from
https://www.senioradvisor.com/chicago-il/chicago-low-income-senior-housing
15 | P a g eGetting Ahead of Gentrification: Woodlawn’s Strategy for Managing Involuntary Displacement
As explained in the TIF ordinance creating the West Woodlawn TIF 25, affordable rents is relative to the
number of bedroom required to accommodate a family. The most accurate assessment would then
stress test by Family size and income (implying 28 LMI segments in their HUD based model below).
Given the complexity of this approach and noting that income remains the primary driver, we assumed a
median family size of 2.5 (rounded to 3), as supported by the Gensler (2016) data for Woodlawn, and
this in turn implies a 2 or 3 bedroom unit. We then stress tested income for the Low, Moderate and
Middle income segments.
The stress testing implies that with as little as a 15% increase in median rents while household income
grows at an inflation adjusted rate of 2%, more than 50% of all low and moderate income households
would become(or already are), severely housing cost burdened.
Overlaying this data on our Expulsion Index, an estimated 3,750 to 4,500 renting households could be
displaced, albeit over an unspecified timeline. Again, this very narrowly assumes that the population
distribution in Woodlawn will, over time, migrate towards demographics that typify the city as a whole.
25
Laube Consulting Group. (2010). West Woodlawn Eligibility Study: Redevelopment Plan and Project Amendment
#1 (Publication). City of Chicago, IL: Department of Community Development
16 | P a g eGetting Ahead of Gentrification: Woodlawn’s Strategy for Managing Involuntary Displacement
Observing the cost sensitivity noted herein, the Network is examining strategies specifically designed to
manage costs escalations. These are outlined in the “Strategy Options” section later in this paper.
WHAT HAPPENS IF RE-BALANCING OCCURS?
Currently an estimated 15.7% to 20% of all Woodlawn housing units are owner. The variance also
largely depends on how statisticians treat vacant inventory. Trulia (2018) 26, estimates the city of
Chicago proportions at 45% owner-occupied and 55% renters. If Woodlawn were to rebalance over
time in line with citywide metric to say 50%/50%, the result would be a massive erosion of rented
inventory and most likely a displacement of low-income families which make up the majority of the
renters.
The risk of rebalancing is heightened when one considers
that through the recession there was a significant level of
cash buying by non-resident investors 27. According to
Geoff Smith and Sara Duda (2012) at the Institute for
Housing Studies (IHS), roughly 68% of all Woodlawn
property sales in 2011 were cash buyers.
Given the relatively low numbers of home occupied units
sold during the same period, it is reasonable to assume
these were rented, and given the large number of low-
income households, a large portion of these with Section
26
Demographics of Chicago. (n.d.). Retrieved February 09, 2018, from
https://www.trulia.com/real_estate/Chicago-Illinois/community-info/
27
Smith, G., & Duda, S. (2012, May 12). Cash or credit: The role of cash buyers in Cook County’s ... Retrieved
February 22, 2018, from
https://www.bing.com/cr?IG=490FA71478904630992BF024C6B0025F&CID=15D8B42AB99765BD30E6BFB4B83864
17 | P a g eGetting Ahead of Gentrification: Woodlawn’s Strategy for Managing Involuntary Displacement
8 enabled residents with children (also consistent with the way the population expanded). Assuming a
profit motive for as little as half of this cash acquired inventory, several hundred units could be resold as
market rate properties or converted for single-family occupancy.
Today the IHS 28 describes Woodlawn as an area of “Moderate-Cost with Rising Prices.” The study goes
on to argue that “if these areas are also near stronger real estate markets or amenities (as Woodlawn
is), this could lead to more rapid shifts in future housing demand and increased pressure on housing
costs for vulnerable populations.”
While the IHS study does not speak to rebalancing or conversion of rental housing to owner-occupancy,
the reality observed in Wicker Park, Logan Square and Pilsen do.
What is at stake is an estimated 1,000 to 3,000 housing units that might be converted from rental to for-
sale as two or three story town-homes. And while this is at best a “guestimate,” a term offensive to true
statisticians, for community residents it characterizes a fear that has played out in other communities.
WHAT HAPPENS IF HOUSING COVENANTS ARE ALLOWED TO EXPIRE?
As noted below, subordinated loans (with income-restricting covenants) covering 976 affordable units
have or will expire by the end of 2023. This could potentially create a noteworthy vulnerability for 431
households headed by seniors or people living with disabilities plus another 545 units of housing for the
general public. Together this impacts roughly one in every ten households in Woodlawn and nearly a
third of all residents housed in government-assisted properties.
The likelihood of this happening, however
is partially mitigated by the fact that most
of this housing is either controlled by the
city or not-for-profit, affordable housing
oriented organizations. Further, based on
conversations with the various property
owner, we were able to zero in more
specifically on a more-narrow subset of vulnerable projects and are working to obtain evidence that
extensions of those commitments or contracts had either been documented (but not yet published by
the authorizing issuer) or negotiations were underway. These are summarized as follows:
Noteworthy, however, is that at least two developments have been sold, including the 204-unit, Park
Shore East, which was sold by Woodlawn Community Development Corporation to Elzie Higginbottoms.
The strategy for that project has not yet been ascertained. Another 86-unit property, Drexel Terrace,
has been on and off the market for several years, asking for as much as $9 million at one point.
When coupled with an uptick in home sales for the neighborhood, this loss of inventory risk remains a
principle concern.
47&rd=1&h=UJFjDaXzcYGjGOSILdti2coxHPBxCTYM9tBE7TlNucw&v=1&r=https%3a%2f%2fwww.housingstudies.org
%2fresearch-publications%2fpublications%2fPropertyTransactionsMay2012%2f&p=DevEx,5066.1
28
Duda, S., Purcell, J., & Smith, G. (2017, December). Displacement Risk in Chicago. Retrieved January 30, 2018,
from https://displacement-risk.housingstudies.org/
18 | P a g eGetting Ahead of Gentrification: Woodlawn’s Strategy for Managing Involuntary Displacement
MITIGATION STRATEGY OPTIONS:
Given the risks defined above, the Network studied a plethora of strategies being deployed by other
communities. Extracting from the Displacement Glossary constructed by The Urban Displacement
Project at University of California, Berkley, together with those policies defined by the University of
Illinois Chicago’s Nathalie Voorhees Center, the Network has embarked on implementing several
strategies to arrest involuntary displacement. These are summarized as follow:
1. Control of Municipally Owned Properties under one development plan whereby WPED and
Aldermanic letters of support are required for acquisition.
a. Expand on the City’s Lots for Working Families program
i. Pair with an extension of Renew Woodlawn
ii. Creation of Woodlawn Affordable Housing Trust Fund (Mirror of Chicago’s Pilot
Act For the Preservation of Affordable Housing in Logan Square)
b. Support operationalization of existing land trusts and promote creation of
shared equity housing cooperatives.
2. Continuous Monitoring and Proactive drive for renewal of income restrictions on government-
assisted housing units.
3. Inclusionary Zoning on New Developments (increase inventory of workforce housing)
4. Expand TIF ordinance to allow for funding work force housing and to make home repairs for LMI
homeowners in both the eastern and western quadrants.
a. Include Incremental funding for energy improvements for LMI households
b. Permit some limited funding to NHS for homeowner education (PITI) to drive more
consistent use of place tax-exemptions, energy grants and cost reduction strategies.
5. Tax abatement for low-income households and fixed income seniors.
6. Support launch and invest in Woodlawn Displacement Mitigation Fund
7. Confirm Woodlawn eligibility for city’s Neighborhood Opportunity Fund and THRIVE zone.
19 | P a g eGetting Ahead of Gentrification: Woodlawn’s Strategy for Managing Involuntary Displacement
BIBLIOGRAPHY
Affordable Housing Partnership Exceeds Goal in Efforts to Lead Neighborhood Revitalization in
Woodlawn. (n.d.). Retrieved February 09, 2018, from http://www.poahchicago.org/news/affordable-
housing-partnership-exceeds-goal-efforts-lead-neighborhood-revitalization-woodlawn
Biasco, P. (2016, January 27). How Much is Rent in Chicago? A Neighborhood Look. Retrieved January
30, 2018, from https://www.dnainfo.com/chicago/20160127/downtown/median-rent-for-1-br-chicago-
1970
Cholke, S. (2017, September 12). Woodlawn Home Values Soar As Obama Library Draws New Interest To
Area. Retrieved January 30, 2018, from https://www.dnainfo.com/chicago/20170912/woodlawn/home-
values-increase-redfin-barack-obama-presidential-library-center-prices-real-estate-markets-hot-jackson-
park
Chicago Metropolitan Authority for Planning. (2017). Cook County property tax classification effects on
... Retrieved February 23, 2018, from
http://www.bing.com/cr?IG=1297A47E27DA48D4B58061103A340079&CID=0E5B010B6A4268740F1B0A
946BED69ED&rd=1&h=xvIVMIQKjWj7cWCOquYbGsWvMO3-
DQhf3k4vHw4iLbQ&v=1&r=http%3a%2f%2fwww.cmap.illinois.gov%2fupdates%2fall%2f-
%2fasset_publisher%2fUIMfSLnFfMB6%2fcontent%2fcook-county-property-tax-classification-effects-on-
property-tax-burden&p=DevEx,5069.1
Chicago-Naperville-Joliet Illinois Household Income. (2017). Retrieved February 23, 2018, from
http://www.deptofnumbers.com/income/illinois/chicago/
City of Chicago. (2017). FY 2016 West Woodlawn TIF Annual Tax Increment Finance Report (Rep.). IL:
State of Illinois Comptroller Susan A Mendoza.
Demographics of Chicago. (n.d.). Retrieved February 09, 2018, from
https://www.trulia.com/real_estate/Chicago-Illinois/community-info/
Duda, S., Purcell, J., & Smith, G. (2017, December). Displacement Risk in Chicago. Retrieved January 30,
2018, from https://displacement-risk.housingstudies.org/
Eltagouri, M., & Wong, G. (2017, March 24). Chicago area leads U.S. in population loss, sees drop for 2nd
year in a row. Retrieved March 23, 2018, from http://www.chicagotribune.com/news/local/breaking/ct-
chicago-census-population-loss-met-20170322-story.html
Gensler (2017, March 7), Woodlawn Neighborhood Master Plan, Chicago, IL. Retrieved January 30, 2017
from http://1woodlawn.com/wp-content/uploads/2015/10/Gensler-
WoodlawnNeighborhoodIndicatorsPresentationNov3.pdf
Holmes, C. (2018, February 20). Woodlawn Displacement Assessment [E-mail to the author].
Holmes, C. (2018, March 7). Woodlawn Subcommittee on Displacement - Request [E-mail to the author].
20 | P a g eGetting Ahead of Gentrification: Woodlawn’s Strategy for Managing Involuntary Displacement
Household Income in Chicago, Illinois (City). (n.d.). Retrieved February 28, 2018, from
https://statisticalatlas.com/place/Illinois/Chicago/Household-Income
Josephson, A. (2016, April 12). Severely Housing Cost-Burdened Cities. Retrieved February 05, 2018,
from https://smartasset.com/mortgage/the-most-and-least-severely-housing-cost-burdened-cities
LaTrace, A. (2017, January 11). Your guide to Woodlawn, the 2016 Neighborhood of the Year. Retrieved
February 01, 2018, from https://chicago.curbed.com/2017/1/11/14215428/woodlawn-chicago-
neighborhood-guide
Laube Consulting Group. (2010). West Woodlawn Eligibility Study: Redevelopment Plan and Project
Amendment #1 (Publication). City of Chicago, IL: Department of Community Development
Planning and Development: DPD promotes the comprehensive growth and sustainability of the City and
its neighborhoods. (2010). Retrieved February 21, 2018, from
https://www.cityofchicago.org/city/en/depts/dcd/supp_info/tif/west_woodlawn_tif.html
National Housing Preservation Database. (2018). Retrieved February 27, 2018, from
http://nhpd.preservationdatabase.org/
Perkins, K. (2007). The Future of Limited Equity Cooperatives. Retrieved February 23, 2018, from
http://scholarship.sha.cornell.edu/crer/vol5/iss1/11/
Policy Tools. (n.d.). Retrieved February 06, 2018, from http://www.urbandisplacement.org/policy-tools-
2
Real Estate Data for Chicago. (n.d.). Retrieved February 28, 2018, from
https://www.trulia.com/real_estate/Chicago-Illinois/market-trends/
Redfin, Retrieved January 30, 2018 from
https://www.redfin.com/neighborhood/29328/IL/Chicago/Woodlawn
Rent Burdens: Rethinking Affordability Measures, HUD, (n.d.). Retrieved February 01, 2018, from
https://www.huduser.gov/portal/pdredge/pdr_edge_featd_article_092214.html
Rob Paral and Associates, (2017). Retrieved March 05, 2018, from
http://robparal.com/ChicagoCommunityAreaData.html
Smith, G., & Duda, S. (2012, May 12). Cash or credit: The role of cash buyers in Cook County’s ...
Retrieved February 22, 2018, from
https://www.bing.com/cr?IG=490FA71478904630992BF024C6B0025F&CID=15D8B42AB99765BD30E6B
FB4B8386447&rd=1&h=UJFjDaXzcYGjGOSILdti2coxHPBxCTYM9tBE7TlNucw&v=1&r=https%3a%2f%2fw
ww.housingstudies.org%2fresearch-
publications%2fpublications%2fPropertyTransactionsMay2012%2f&p=DevEx,5066.1
21 | P a g eGetting Ahead of Gentrification: Woodlawn’s Strategy for Managing Involuntary Displacement
Smith, G. (2018, February 20). Woodlawn Info NOW Tech Asst_Draft_small.pdf [E-mail to the author].
Smith, T. (2017). Woodlawn Expulsion Index. In Managing Involuntary Displacement in Woodlawn (pp.
7). Chicago, IL: Network of Woodlawn.
The State Of Housing Supply in Illinois - ILCMA. (n.d.). Retrieved February 5, 2018, from
https://www.bing.com/cr?IG=A6AFD26C8D9F481192D5C281DE12AC6A&CID=2DE6838B3D85600104AA
88063C2A6103&rd=1&h=Z2LVmOrbakwyrkxR4eljGuOEWWpa9kM_UW0HVNLhdiU&v=1&r=https%3a%2
f%2fwww.ilcma.org%2fwp-content%2fuploads%2f2017%2f06%2fState-of-Housing-Supply-in-
Illinois.pdf&p=DevEx,5066.1
The State of the Nation's Housing 2017. (n.d.). Retrieved February 05, 2018, from
http://www.JCHA.harvard.edu/research/state_nations_housing
University of Illinois at Chicago, Nathalie P. Voorhees Center for Neighborhood and Community
Improvement. (2015, March). Gentrification & Neighborhood Change: Helpful Tools for Communities.
Retrieved February 16, 2018, from https://www.voorheescenter.com/gentrification-index
Young, S. (2018, February 21). Preservation Compact Class 9 Question [E-mail to the author].
22 | P a g eGetting Ahead of Gentrification: Woodlawn’s Strategy for Managing Involuntary Displacement
APPENDIX A: POLICY RECOMENDATIONS
STRATEGY 1: Woodlawn Policy to Manage Redeployment of Municipally Controlled Residential
Properties (Update as said policy draft is updated).
To mitigate the risk of involuntary resident displacement resulting from the neighborhoods vulnerability
to gentrification, the Network of Woodlawn has asked the City of Chicago and Cook County to support a
comprehensive and equitable housing initiative aimed at managing the dwindling but still large
inventory of under-utilized, foreclosed, blighted or vacant residential properties in the Woodlawn
quadrants. The outcome desired is to craft a policy that aligns with community’s aspiration to be an
economically diverse and inclusive community. The intended policy is being fleshed out and will be
informed by input from the community and subject matter experts.
PROPOSAL: Policy to Manage Redeployment of Municipally Controlled Residential Property.
This is one of several proposed but concurrent housing policy initiatives designed to support equitable
but viable housing development in Woodlawn. While all elements will ultimately need to be more fully
vetted and developed with the guidance of subject matter experts (policy, financial, market), the key
elements of this proposal include:
SITE CONTROL: Aggregate all of the city and county controlled residential or residentially
zoned properties in Woodlawn under one strategy with intent to implement a long-term
redeployment that insures the following:
1. Accelerate/Expedite cycle times on city processes (a key developer compliant)
2. Both aldermanic and WPED support letters will be required for any entity to
acquire city owned land in Woodlawn.
3. 40% to 50% redeployed as market rate for-sale or rental properties
4. 20% to 40% redeployed as for-sale or rental workforce housing (affordable to
households earning not more than 140% of the area median).
5. 20% to 30% redeployed as affordable rentals subject to long-term affordability
restrictions but eligible for families earning up to 140% of the area median.
a. Affordable properties would be subject to a 20 year affordability condition
coupled with a non-forgivable subordinated mortgage with a deferred and
compounding interest payable that all becomes due upon default or sale.
BIAS TOWARDS RESIDENTS VERSUS INVESTORS (ABSENTEE LANDLORDS)
The Network is looking to more aggressively implement the City Lots for Working Families
program in Woodlawn. The City Lots for Working Families (CL4WF) program provides
vacant, City-owned lots to developers of affordable single-family homes and two flats for
$1 each. Through the program, eight to 20 City-owned lots with a maximum appraised
value of $125,000 can be conveyed per developer for each project. Homes must be made
available to qualified buyers with incomes up to 140 percent of area median income.
Buyers must use the homes as their primary residences for a minimum five-year occupancy
period. The program:
23 | P a g eYou can also read