YOUR VOICE. YOUR HOME - WHAT WE HEARD REPORT MEETING THE HOUSING NEEDS OF BURNABY RESIDENTS - City of Burnaby
←
→
Page content transcription
If your browser does not render page correctly, please read the page content below
YOUR VOICE.
        YOUR HOME.
MEETING THE HOUSING NEEDS OF BURNABY RESIDENTS

 WHAT WE HEARD REPORT
         PHASE ONE: GENERATING IDEAS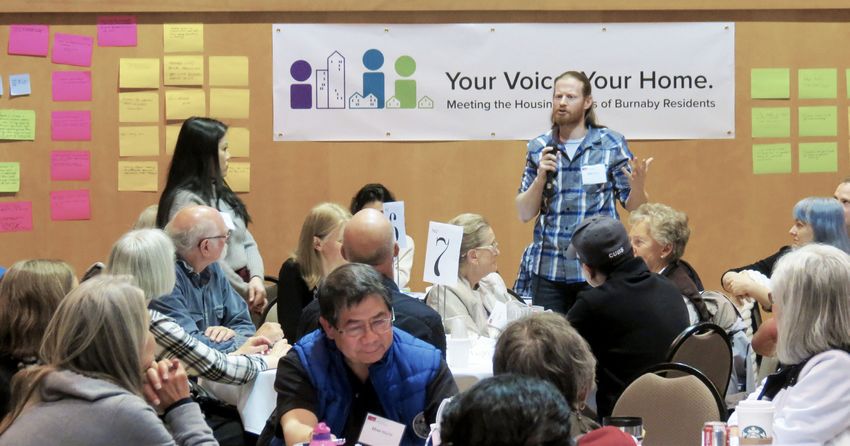
YOUR VOICE YOUR HOME: MEETING THE HOUSING NEEDS OF BURNABY RESIDENTS

1
WHAT WE HEARD REPORT

                                     Purpose of Document

        This report was independently prepared by Simon Fraser University’s Morris J. Wosk Centre for Dialogue
        under the sponsorship of the City of Burnaby. The purpose is to provide a summary of public input shared
        during the first phase of the Your Voice. Your Home. Meeting the Housing Needs of Burnaby Residents
        engagement process. This publication does not necessarily reflect the opinions of Simon Fraser University’s
        Centre for Dialogue or the City of Burnaby. It is published in the Creative Commons (CC BY-ND), and may be
        reproduced without modification so long as credit is attributed to Simon Fraser University’s Morris J. Wosk
        Centre for Dialogue. Any works referring to this material should cite:
        Simon Fraser University’s Morris J. Wosk Centre for Dialogue. (2019).
        What We Heard Report, Your Voice. Your Home.

City of Burnaby                                                 SFU Morris J. Wosk Centre for Dialogue
Burnaby is a vibrant city at the geographic centre of           Simon Fraser University’s Morris J. Wosk Centre for
Metro Vancouver. It has an amazing natural environment,         Dialogue fosters shared understanding and positive action
a strong cultural mosaic and thriving town centres. The         through dialogue and engagement. As a trusted convener
City of Burnaby provides facilities and services that           and hub for community initiatives, we have engaged
support a safe, connected, inclusive, healthy and dynamic       hundreds of thousands of citizens and stakeholders to
community. As the third-largest city in B.C., Burnaby is        create solutions for critical issues such as climate change,
home to more than 232,000 residents (2016 Census) and           democracy & civic engagement, peace & security, inter-
is projected to grow to 345,000 by 2041.                        cultural dialogue, urban sustainability and health.
                                                                The Centre actively connects the university and
                                                                community partners to exchange knowledge and work
                                                                towards shared objectives and supports student success
                                                                through the Semester in Dialogue and other experiential
                                                                education opportunities.

                                                                                                                          2
YOUR VOICE YOUR HOME: MEETING THE HOUSING NEEDS OF BURNABY RESIDENTS

                    EXECUTIVE SUMMARY

3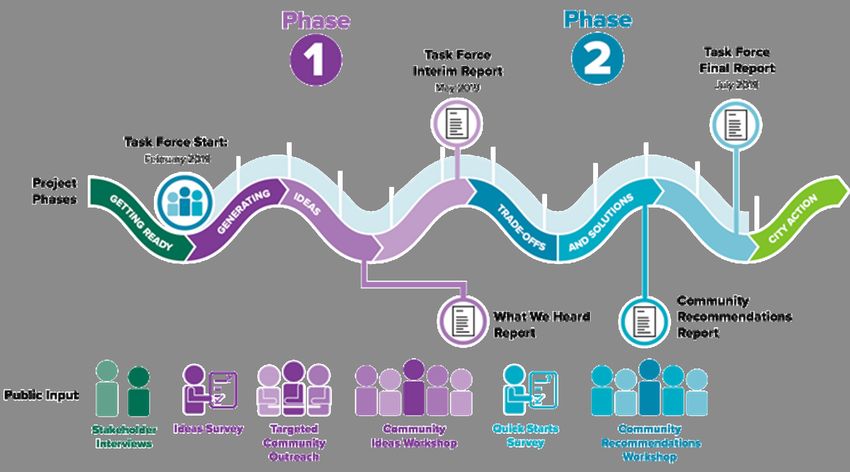
WHAT WE HEARD REPORT

Your Voice Your Home: Meeting the                               Disconnect between prices and incomes, versus the
Housing Needs of Burnaby Residents is                           quality of available housing;
an innovative public engagement initiative                         “Housing costs keep rising yet wages are not keeping
designed to address Burnaby’s current and                          up with inflation, which puts the most vulnerable
future housing needs.                                              citizens, such as seniors, disabled, single parent
                                                                   families, single income families and those living
It provides a unique opportunity for residents, community
                                                                   paycheque to paycheque at risk of homelessness.”
members and stakeholders to come together, share ideas
and experiences, and engage with one another to find            Loss of sense of community and quality of life; and
workable solutions.                                                “Burnaby needs to grow in a [humane] manner that
What We Heard presents a detailed overview of all                  allows a variety of people the ability to live, work [and
public input collected during Phase One of this initiative.        play].”
Phase One engaged with approximately 2380 Burnaby               Risk of demovictions.
residents to gather ideas, assess current housing
                                                                   “Too many demovictions -- too much development that
needs and challenges and generate possible solutions.
                                                                   removes low cost housing…The amount of homeless
Engagement activities included: Community Housing
                                                                   people therefore has increased -- most of these are
Survey, a Community Ideas Workshop and direct
                                                                   seniors -- it is a very sad situation.”
community outreach undertaken by Community Student
Ambassadors.
                                                                Major themes for housing solutions raised by residents
Several trends emerged in the data collected in Phase           included:
One. Direct quotes from survey respondents are used
                                                                Strengthen government housing oversight and
below to highlight themes for key challenges and
                                                                regulation;
solutions brought forward by participants.
                                                                   “Food, shelter and health care are human rights. City
Major themes for housing challenges raised by residents            of Burnaby needs to take every step necessary to get
included:                                                          them out of the free market and provide roofs for low
                                                                   income families.”
Not enough affordable rental housing, especially for
specific population groups;                                     Demand accountability from housing developers;

   “There are barely any rental properties available that          “Developers should not be given full sway in decision-
   we can afford. We are really worried that if these prices       making regarding size or pricing of units.”
   continue my husband and I will be homeless someday.          Convert/rezone single family units to multi-family units;
   We are seniors.”
                                                                   “No more single family zoning. Change zoning bylaws.
Lack of specific sizes and types of housing;                       Allow duplex, triplex townhouses, laneway houses and
   “There are not enough affordable housing choices for            multi-family lots throughout Burnaby.”
   renters. Families with children [are] living in apartments   Allow laneway homes;
   that don’t have enough rooms… Renters don’t want
                                                                   “Allow laneway houses. Most of the cities allow it
   luxury condos, they want safe, clean and affordable
                                                                   already and Burnaby land and size are good enough
   [homes].”
                                                                   to do that, we need to catch up and that will be the
Speculative buying and foreign capital are raising prices;         easy way to increase housing.”
   “The biggest challenges to housing in all Lower
   Mainland areas has been the evolution of housing
   as investments and not simply as homes. Houses are
   perceived as assets that should increase in value”.

                                                                                                                               4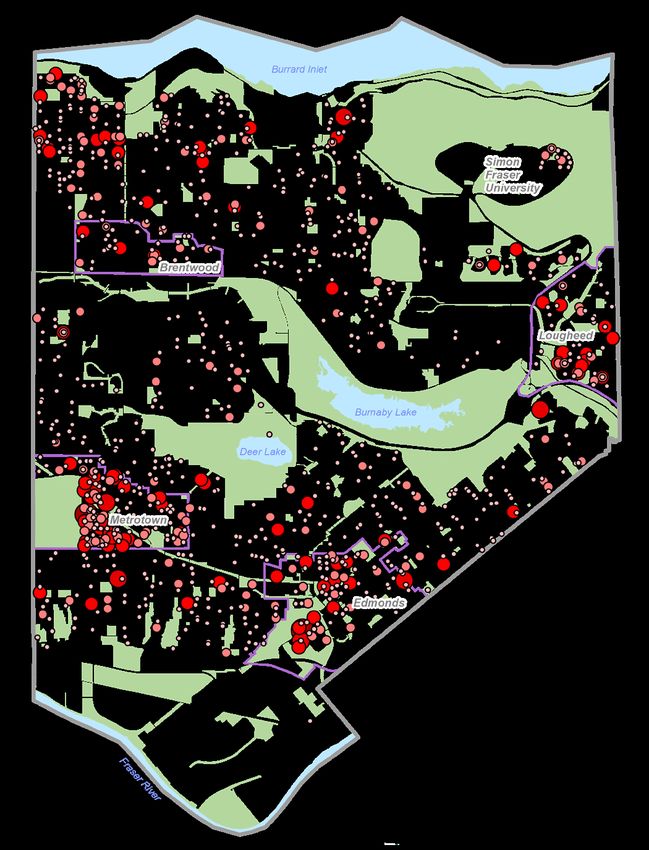
YOUR VOICE YOUR HOME: MEETING THE HOUSING NEEDS OF BURNABY RESIDENTS

Encourage densification in strategic areas; and                     Please note, the data presented in this report is compiled
    “Allow for more densification in more diverse areas.            from those who chose to participate in the engagement
    Concentrate highest density in Town Centres, but allow          process and does not represent a randomized or fully
    for more modest density along arterial outside town             representative sample.
    centers”.                                                       This report therefore cannot be used to determine
Stop demovictions.                                                  community preferences between different options
                                                                    or ideas. Instead, this report offers a cross-section
    “Freeze all pending demovictions until tenants                  of community ideas and preferences from diverse
    have access to another apartment in the same                    perspectives based on short interactions and without the
    neighbourhood for the same price.”                              benefit of a significant education process. The data will
                                                                    be used to structure learning materials and options for
                                                                    later phases of the project, and to inform the Mayor’s Task
                                                                    Force on Community Housing’s Interim Report.

Burnaby Housing Profiles
In order to visually capture the diverse housing experiences of Burnaby residents, composite housing profiles were devel-
oped based on survey and interview data. Please note that each profile represents several individuals and is framed by
overall housing trends.

                                               BURNABY HOUSING PROFILE

                                                     Name: Kim
                                                     Age: 36
                                                     Housing Type: Renter
                                                     Housing Experience: As a single mother with two young boys,
                                                     Kim finds it hard to save for the future and pay rent. The lack of
                                                     certainty surrounding her living situation causes a great deal of
                                                     stress and anxiety.
       “So many of my friends have moved             In order to provide for her family, she works two jobs, but still finds
       out of Burnaby because they couldn’t          it difficult to live in the city.
           afford it. I don’t recognize the          She would like to see more options for subsidized housing,
       neighbourhood anymore. The whole              particularly for single mothers.
        City has changed. I don’t want to be
         the last person left on the block.”

5
WHAT WE HEARD REPORT
BURNABY
HOUSING PROFILE
AISHA, 45
“Allow laneway houses. These can be excellent housing
for seniors or young couples who want the “feel” of living in
a house but don’t need the space. Many single-family homes
like mine have under-utilized backyards.”
Housing Type: Homeowner
Housing Experience: Aisha currently lives with her husband and
young children in North Burnaby. As a homeowner, she would like
the opportunity to house her elderly parents who aren’t able live
alone anymore. To make this possible, she is interested in building
a laneway home on her property, to ensure she is close to her
parents but they continue to enjoy their own space as well.
6YOUR VOICE YOUR HOME: MEETING THE HOUSING NEEDS OF BURNABY RESIDENTS
TABLE OF CONTENTS
7WHAT WE HEARD REPORT
Introduction__________________________________________________________________________________ 9
Community Ideas Workshop__________________________________________________________________ 13
Community Housing Survey___________________________________________________________________ 17
Purpose and Survey Overview______________________________________________________________________ 18
General Survey Responses_________________________________________________________________________ 18
Challenges and Solutions_________________________________________________________________________ 29
Community Student Ambassadors____________________________________________________________ 39
Next Steps__________________________________________________________________________________ 46
Appendices__________________________________________________________________________________47
1. Visioning Activity______________________________________________________________________________ 48
2. Ideas for Housing Activity_______________________________________________________________________ 48
3. Session Evaluation Results______________________________________________________________________ 52
4. Community Ideas Workshop Exit Survey Additional Groups_____________________________________________ 55
5. Average Ratings of Housing Priorities______________________________________________________________ 58
6. Housing Ideas Survey__________________________________________________________________________ 59
7. Challenges and Solutions_______________________________________________________________________ 65
BURNABY HOUSING PROFILE
Name: Sandra
Age: 45
Housing Type: Renter
Housing Experience: Sandra rents an apartment with her son
who is in a wheelchair. Finding wheelchair friendly affordable
housing in Burnaby has been very challenging.
Accessibility is a huge issue for her family and many others, and
“Landlords need to be more responsive she urges property owners to create more wheelchair accessible
to requests to ensure that a space is spaces for rent.
accessible for all.”
8YOUR VOICE YOUR HOME: MEETING THE HOUSING NEEDS OF BURNABY RESIDENTS
INTRODUCTION
9WHAT WE HEARD REPORT
Background series of public engagement opportunities for Burnaby
residents. These activities include: a second online
In February 2019 the City of Burnaby engaged the
survey to evaluate quick starts, a Discussion Guide, and a
Centre for Dialogue to independently design and
Community Recommendations Workshop. A Community
facilitate an innovative public engagement initiative to
Recommendations Report will be presented to the Mayor’s
address Burnaby’s current and future housing needs.
Task Force on Community Housing to inform its Final
Your Voice. Your Home. Meeting the Housing Needs of
Report.
Burnaby Residents (hereafter referred to as Your Voice
Your Home) provides a set of unique opportunities for
Phase Three – Action
community members to gather and share ideas, present
recommendations and engage with one another to find The final phase of the project will be action by the City
workable solutions. of Burnaby. Based on the community recommendations
presented in Phase Two, the Mayor’s Task Force on
Your Voice Your Home is divided into two distinct phases.
Community Housing will present a Final Report to Council
This report presents a detailed overview of the public
focusing on specific actions to meet Burnaby’s housing
input collected during Phase One: Generating Ideas.
needs.
Phase One – Generating Ideas For detailed information regarding Phase Two and Phase
Three, please see the Next Steps section on Page 46.
Phase One was focused on hearing from Burnaby
residents. It provided a series of engagement
opportunities for the community to share their voices, Phase One Engagement Activities
ideas, experiences as well as possible solutions. The Engagement activities for Phase One of Your Voice Your
objective was to collect as many ideas as possible from as Home included:
many residents as possible, with an emphasis on diversity.
• A Community Housing Survey with 1450 responses,
It was important to ensure that Phase One included
open between February 21st and March 10th, seeking
diverse voices and opinions, capturing the full-range of
public input on housing needs, challenges and
housing experiences in Burnaby.
solutions;
Phase One was comprised of three main activities:
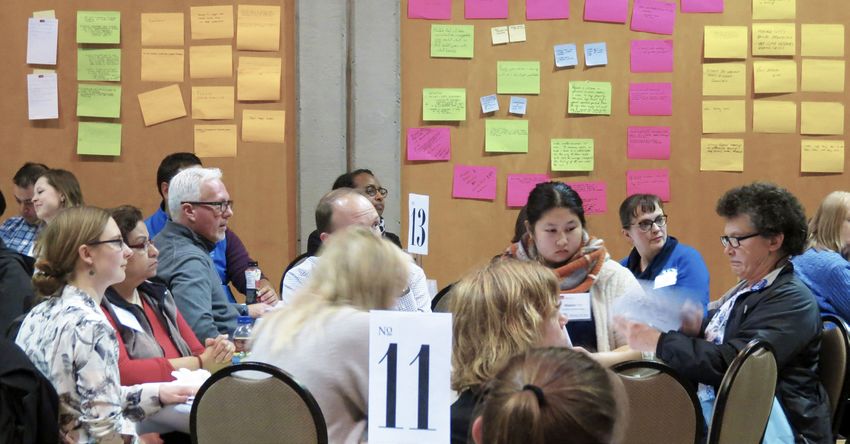
the Community Housing Survey, the Community Ideas • A three-hour Community Ideas Workshop on March
Workshop and targeted community outreach through a 6th, attended by 100 residents to collect community
team of Community Student Ambassadors, all of which are input on affordable housing;
detailed in this report. • A series of phone interviews and in–person meetings
This report will be presented to Burnaby City Council and with key community stakeholders; and
the Mayor’s Task Force on Community Housing to inform • A three-week outreach program designed to reach
the Task Force’s Interim Report, which will identify short- Burnaby residents who were unlikely or unable to
term actions and long-term objectives towards housing participate in the online survey and workshop. Ten
affordability. Community Student Ambassadors hosted informal
community meetings and discussions across Burnaby
Phase Two – Trade Offs and Solutions
to collect information on housing experiences and
Phase Two of Your Voice Your Home will build upon possible solutions.
the ideas from Phase One, consider different options
to improve housing in Burnaby and evaluate trade-
offs. Similar to Phase One, this phase will provide a
10YOUR VOICE YOUR HOME: MEETING THE HOUSING NEEDS OF BURNABY RESIDENTS
Your Voice Your Home
Project Overview
Your Voice Your Home Marketing Online Engagement
The City of Burnaby and the Centre for Dialogue promoted The City of Burnaby launched the Your Voice Your Home
Your Voice Your Home in several different ways. The webpage on February 21st, 2019, and over the span
result of this outreach was 1450 survey respondents, of one month the page received over 3,300 unique
180 registrations for the Community Ideas Workshop visitors. In addition to the survey link and registration
(with 100 participants attending after attrition), over for the Community Ideas Workshop and Community
400 resident interactions with the Community Student Recommendations Workshop, residents could also share
Ambassadors and 350 registrations for the Community input directly though: YourVoice.YourHome@burnaby.ca.
Recommendations Workshop. In total, Phase One
engaged approximately 2380 individuals. This strong Data Disclaimer
community interest, reinforces just how important and
Please note, the data presented in this report is compiled
urgent the issue of housing is for Burnaby.
from those who chose to participate in the engagement
To launch Your Voice Your Home and in order to reach as process and does not represent a randomized or fully
many Burnaby residents as possible, a postcard was sent representative sample.
to every household in the City. This postcard encouraged
This report therefore cannot be used to determine
residents to get involved and share their housing
community preferences between different options
views and experiences. In addition, the City of Burnaby
or ideas. Instead, this report offers a cross-section
promoted the project through social media and local
of community ideas and preferences from diverse
advertising.
perspectives based on short interactions and without the
benefit of a significant education process. The data will
be used to structure learning materials and options for
later phases of the project, and to inform the Mayor’s Task
Force on Community Housing’s Interim Report.
11WHAT WE HEARD REPORT
v
Be d. Get Havn e .
r Involve e ce
Hea d. Infl u
Meeting the Housing Needs
of Burnaby Residents
Your Voice. Your Home. Your Voice Your Home Postcard
BURNABY HOUSING PROFILE
Name: Jasmine
Age: 30
Housing Type: Renter
Housing Experience: Jasmine is deeply concerned about the
lack of affordable housing options, and lives in constant fear of
being evicted.
As a young professional who works downtown she doesn’t want
“I love Burnaby. But I am faced to move further away but worries she may have to.
on a daily basis with the growing
She feels the city needs to be more innovative and consider the
understanding that if I want to raise
idea of rental caps.
a family I will not be able to stay here,
despite working a full-time job.”
12YOUR VOICE YOUR HOME: MEETING THE HOUSING NEEDS OF BURNABY RESIDENTS
COMMUNITY IDEAS
WORKSHOP
13WHAT WE HEARD REPORT
Photo Source: City of Burnaby
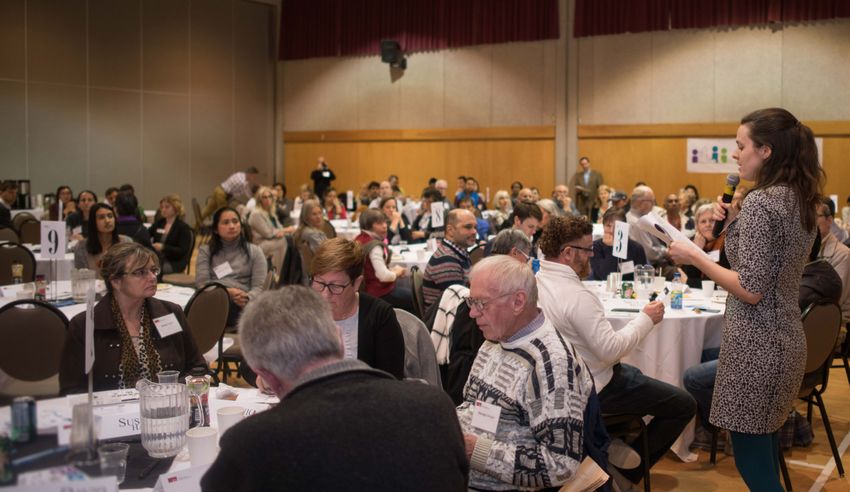
Background Ideas for Defining Success
The Community Ideas Workshop brought together Workshop participants were asked to imagine the future
100 Burnaby residents for an interactive evening of of housing in Burnaby in 2022 and more specifically, to
discussions on housing affordability. envision what housing would look like if Your Voice Your
Mayor Hurley provided opening remarks and the City of Home and the Mayor’s Task Force on Community Housing
Burnaby provided a short presentation highlighting current were successful. Ideas raised by participants for Burnaby’s
housing data. housing future included:
• Renovictions no longer exist;
Objectives • Mixed housing spaces are common;
Workshop participants had the opportunity to learn more • Speculation and empty homes are a thing of the past;
about and discuss: • Land is more efficiently used through densification;
• The current housing situation in Burnaby; and
• Factors contributing to housing unaffordability and • Green space and mountain views are maintained.
affordability; From this visioning exercise, participants also raised
• What residents value about housing; and several values about housing. Residents described a
• Concrete actions the City of Burnaby can take to future where: housing is considered a basic right, all levels
address affordable housing. of government are engaged and collaborate, increased
14YOUR VOICE YOUR HOME: MEETING THE HOUSING NEEDS OF BURNABY RESIDENTS
transparency and consultation between residents and • Increase the stock of rental units; and
governments exists, and new housing developments are • Implement a municipal speculation/vacancy tax.
designed to create more livable communities. For a full
For a full list of ideas, please visit the Appendix.
list of ideas surfaced from this activity please refer to the
Appendix.
Additional Information Requested by
Participants
Ideas for Housing
To close the workshop, participants had the opportunity
For the second activity, participants were asked to
to provide feedback on the event, as well as identify any
brainstorm concrete actions the City of Burnaby could take
additional required information through an exit survey.
to fulfil their housing visions. Participants wrote their top
idea on a sticky note and posted them to an ‘Ideas Wall’. Participants requested the following additional information:
The most common ideas included: • Inventory of empty houses/units;
• Numbers of short-term rentals;
• Convert/rezone single family units to multi-family units;
• Number of affordable units being lost;
• Increase the number of non-market and co-op housing
units; • Additional clarity on market rate housing statistics; and
• Target housing towards the needs of seniors and low- • Number and types of homes being built annually.
income populations; Specific requests included:
• Allow construction of laneway and coach houses; • Summary of how current bylaws, zoning restrictions
• Invest in building and supporting affordable housing; and other city policies affect landlords, developers,
renters and homeowners;
Photo Source: City of Burnaby
15WHAT WE HEARD REPORT
• Information on how the rezoning process takes place; • 87% felt they had ‘fair’ or ‘plenty’ of opportunities to
and express their views;
• How the City of Burnaby uses revenue generated • When asked about the likeliness that the City of
from development fees and density bonusing Burnaby can develop an action plan that meets the
housing needs of all residents, 19% were confident
Session Evaluation Results in the City’s ability, 42% felt that it was somewhat
Respondents clearly indicated a desire for transparent likely, 10% thought it would be very unlikely and the
information, no pre-determined outcomes, ongoing remaining 29% were unsure or did not know.
communication, inclusion of diverse stakeholders and • Finally, 90% somewhat or strongly agreed that the
frequent future engagement opportunities. Of those who workshop generated a wide range of ideas.
attended the March 6th workshop: Please refer to the Appendix for a full list of exit survey
• 91% felt somewhat or completely satisfied with their responses.
experience;
When asked to list any particular demographics or specific
• 98% felt they were able to learn a limited or a great organizations/groups that should be engaged in Your
amount of information about housing in Burnaby; Voice Your Home, respondents made many suggestions.
• 70% somewhat or strongly agreed the workshop Please see the Appendix for a complete list of suggested
participants reflected the full diversity of the Burnaby groups.
community;
Photo Source: City of Burnaby
16YOUR VOICE YOUR HOME: MEETING THE HOUSING NEEDS OF BURNABY RESIDENTS
COMMUNITY HOUSING
SURVEY
17WHAT WE HEARD REPORT
Purpose
The Community Housing Survey was designed to collect
information from Burnaby residents and stakeholders
regarding housing challenges, needs, potential solutions
as well as important demographic information.
Survey Overview
In just over two weeks, the online survey generated input
from 1450 individuals making it the strongest survey
response ever for a City of Burnaby public engagement
activity.
The survey asked residents how well their current housing
met their needs, their perceptions of housing affordability,
what they felt was the biggest housing challenge affecting
Burnaby and specific steps the City could take to address
affordability.
General Survey Responses Location # of People
Respondent Demographics Burnaby 1362
Coquitlam 3
Maple Ridge 2
At the time of survey completion, 96% of respondents New Westminster 9
lived in Burnaby and 27% worked in Burnaby. Pitt Meadows
Port Coquitlam
1
2
Port Moody 3
The map on the right provides a geographical illustration Squamish 1
Number of People
of survey responses, indicating a broad response from Surrey
Vancouver
4
32
across all of Burnaby’s neighbourhood areas and housing 1 5-7 Outside BC 3
2 No Postal Code 11
types: town centre, urban villages, suburban multi-family N
3-4 8-11
and single and two family.
Community Housing Survey, Respondents by Postal Code.
Source: City of Burnaby.
18YOUR VOICE YOUR HOME: MEETING THE HOUSING NEEDS OF BURNABY RESIDENTS
Fig. 3.0: Annual Household Income of Survey Respondents
Percentage of Survey Respondents
40% 37%
30% 28% 31% 29% 30% Survey Respondents
25% Burnaby Residents
20%
14%
10% 6%
0%
Under $20,000 $20,000 to $49,999 $50,000 to $99,999 $100,000 and over
Income Bracket
Fig. 3.0: Percentage of survey respondents per age range, compared to age distribution of the City of Burnaby’s population in the 2016 census.
The annual household income of survey respondents To account for this under-representation, Community
was relatively representative of the income distribution of Student Ambassadors were directed to engage with as
Burnaby residents, as compared to 2016 census data (Fig. many of these individuals as possible. For more details
3.0). on the targeted outreach conducted by the Community
However, there was a noted under-representation of Student Ambassadors, please see page 39.
respondents with a household income under $20,000 as In addition, the Phase Two Community Recommendations
well as youth (30 and under) among survey respondents Workshop will ensure a representative audience by
(Fig. 3.01).
Fig. 3.01: Age Distribution of Survey Respondents
Percentage of Survey Respondents
40%
31% 32%
30% 27% Survey Respondents
Burnaby Residents
22% 21% 22% 22%
20%
13%
10%
10%
0%
0%
Under 16 16-30 31-45 46-60 60+
Age Range
Fig. 3.0: Percentage of survey respondents per age range, compared to age distribution of the City of Burnaby’s population in the 2016 census.
19WHAT WE HEARD REPORT
identifying participants using random selection based on survey respondents was very representative of Burnaby’s
several important criteria, including: age, income, gender overall population (Fig 3.02).
and housing tenure. Youth and young adults aged 16-30 were more likely to be
renters or living with family, while adults over the age of 46
Housing Tenure were more likely to be home-owners (Fig 3.03).
59% of respondents reported being home owners, 33% Home ownership was also highly correlated with a higher
were renters, 5% lived with family (paying little to no rent), annual household income (Fig. 3.04, next page).
and 3% lived in co-op housing. The housing tenure of
Fig. 3.02: Housing Tenure of Survey Respondents
Percentage of Survey Respondents
80%
62%
60% 59% Survey Respondents
Burnaby Residents
40% 38%
33%
20%
0%
Home Owner Renter
Fig. 3.02: Percentage of survey respondents who were home owners or renters at the time of survey completion, compared to the housing tenure of the
City of Burnaby’s population in the 2016 census. 2016 census data does not report on the percentage of individuals in co-op housing or living with family.
Fig. 3.03: Housing Tenure by Age Group
Percentage of Survey Respondents
80% 74%
68% Youth (16-30)
from Each Age Group
60%
55%
51%
Adults (31-45)
42%
40%
27% Older Adults
25%
19% 22% (46-60)
20%
4% 2% 1% 1% 3% 3% 3% Seniors (60+)
0%
Home Owner Renter Live with Family Co-op Housing
(no or small financial rent)
Fig. 3.03: Percentage of survey respondents from each age group per type of housing tenure at the time of survey completion.
20YOUR VOICE YOUR HOME: MEETING THE HOUSING NEEDS OF BURNABY RESIDENTS
Fig. 3.04: Housing Tenure by Income Bracket
Less than $20,000
Percentage of Survey Respondents
80% 79%
80%
from Each Income Bracket
$20,000 to $34,999
57% 58% 57%
60%
47% $35,000 to $49,999
41%
40% 36% 37%
32%
$50,000 to $74,999
20%
11% 16%
$75,000 to $99,999
0%
Home Owner Renter Over $100,000
Fig. 3.04: Percentage of survey respondents from each income bracket who were owners or renters at the time of survey completion.
Housing Priorities • While the importance of price decreased among older
Price, safety, size (having enough space) and proximity respondents, the importance of safety increased (Fig.
to public transit were the housing characteristics that 3.05);
survey respondents reported as being most important. • Proximity to transit was of greater importance for
These priorities were generally consistent across survey renters, and respondents under 30 or over 60 (Fig.
respondents of different ages and housing tenure 3.05); and
(Appendix 6). However, closer analysis surfaced trends in • Having enough space for family was a higher priority
priorities, including: for adults aged 31-45 (Fig. 3.05).
• Price was a significantly higher priority for renters than
for home owners (Fig. 3.06);
Fig. 3.05: Housing Priorities by Age
Percentage of Survey Respondents
78%
80%
Age 16-30
from Each Age Group
62% 58%
60% 55%
53% 53% 53%
50% 45% Age 31-45
41% 42% 41%
38%
40% 34% 32%
32%
Age 46-60
20%
Age 60+
0%
Price Safety Enough space for family Proximity to
public transit
Fig. 3.05: Percentage of survey respondents from each age group who rated the given housing characteristic as “Extremely Important”.
21WHAT WE HEARD REPORT
Survey respondents were asked to identify what they liked 3. Housing Affordability: The cost of housing, either
least and most about their current housing. The top five monthly rent or mortgage, was flagged as an
responses from each question are presented below. important concern. Specific challenges included:
spending too much as a percentage of income,
What Do You Like Least About Your Home? overpaying for poor living conditions and high
1. Size of Home: Many respondents noted that their mortgage rates.
house was too small for their needs, in terms of 4. Location: Respondents identified not being in close
number of rooms or total area. A smaller portion noted proximity to amenities or transportation as a major
that they would like to downsize as they have too challenge. Living in ‘undesirable’ areas was also
much space. reported as an issue.
2. General Need for Maintenance and Renovations: 5. Home Age: Lastly, respondents identified the age of
Respondents highlighted that their homes were in their homes as another major way their housing needs
need of maintenance, renovations and upgrades. were not being met.
Fig. 3.06: Housing Priorities by Housing Tenure
79%
Percentage of Survey Respondents
80%
per Housing Tenure
60% 54% Home Owner
51% 50%
44% Renter
40% 37% 37%
34%
20%
0%
Price Safety Enough space for family Proximity to
public transit
Fig. 3.06: Percentage of renting or home-owning survey respondents who rated the given housing characteristic as “Extremely Important”.
What Do You Like Most About Your Home? 4. Neighbourhood: Neighbours and sense of community
1. Location: Proximity to amenities, services and were another aspect many respondents appreciated
transportation was the most frequently mentioned about their homes.
factor contributing to meeting housing needs. 5. Housing Affordability: Lastly, being able to afford
2. Size of Home: Respondents viewed size and number a home and access affordable housing was a major
of rooms as being two things they liked most about contributing factor to meeting housing needs.
their homes. It is important to note that in some cases what
3. Outdoor Spaces: Burnaby residents were also very respondents liked most and least about their homes was
fond of outdoor spaces, either as part of their home or the same. This illustrates how specific demographics
public spaces nearby. experience housing characteristics differently.
22YOUR VOICE YOUR HOME: MEETING THE HOUSING NEEDS OF BURNABY RESIDENTS
Fig. 3.07: Anticipated Changes in Living Space by Age and Tenure
Age 16-30
Percentage of Survey Respondents
from Each Age and Tenure Group
80%
Age 31-45
62%
60% 54%
Age 46-60
40% 39%
40%
32% 29%
Age 60+
23%
18% 16% 18% 21%
20% 18% 14%
6% 13%
4% 4% 7% Home Owner
0%
I may downsize Enough space for family I may need to create a suite in my
house for other family members Renter
Fig. 3.07: Percentage of respondents anticipating a change in their living space in the next 10 years, by age range and tenure type.
For example, if an individual’s home is not large enough, Anticipated Housing Needs
size was a major challenge. However, if another individual In addition to considering their current needs, survey
had adequate space, size was perceived as a positive respondents were asked to select ways in which they
attribute. Ultimately, this demonstrates that certain housing anticipated their housing needs changing in the next 10
characteristics are important for all residents, regardless of years (Fig. 3.07-3.09). Key trends included:
tenure, age or income.
• More than half of respondents aged 45 and under
For a full list of responses, please refer to the Appendix. anticipated needing a bigger living space, while
Fig. 3.08: Anticipated Financially-Motivated Housing Changes, by Age and Tenure
Age 16-30
Percentage of Survey Respondents
from Each Age and Tenure Group
80%
Age 31-45
64%
60%
53%
Age 46-60
40% 39%
30% Age 60+
23%
20% 17% 18% 18%
10% 7% 16% 12% 13% 12% 14%
8% 6% Home Owner
3%
0%
I may need to move in with I may need to rent space in my I may need to move due to
family for financial reasons home for financial reasons housing affordability Renter
Fig. 3.08: Percentage of respondents who may need to move in the next 10 years due to housing unaffordability, by age range and tenure type.
23WHAT WE HEARD REPORT
respondents aged 45 and over were more likely to Housing affordability was also highly correlated with
anticipate downsizing (Fig.3.07). income, becoming more affordable for survey respondents
• 53% of respondents aged 30 and under, and 64% of with an annual household income of $75,000 or more (Fig.
respondents who are renting anticipated needing to 3.12).
change their housing situation for financial reasons Housing unaffordability was also a greater concern among
(Fig. 3.08). younger generations. 57% of respondents under the age of
• Younger respondents and renters were also the most 30 stated that their housing costs were unaffordable (Fig.
likely to anticipate moving out of their neighborhood, 3.13).
out of Burnaby, or even out of Metro Vancouver (3.09) Younger respondents and renters reported significantly
for financial reasons. more difficulty finding affordable housing (Fig. 3.14),
financial strain due to current housing costs (Fig. 3.15) and
Housing Affordability housing insecurity (Fig. 3.16).
Overall, 60% of survey respondents reported that they For instance, among respondents who were renting or
find their housing costs affordable. However, the survey under the age of 30:
data indicates that income and tenure greatly contribute to • A third or more cannot find an affordable home;
respondents’ perceptions of affordability (Fig. 3.10).
• 36% are spending more than a third of their income on
While the majority of respondents who are home owners or housing;
members of co-op housing considered their housing costs
to be affordable, perceptions of affordability were much • Over 10% cannot afford necessities like food or
more divided among those who rent (Fig. 3.11). transportation because of the cost of housing;
Additionally, more than half of respondents currently living • Over 20% live in fear of being demovicted; and
with family found housing unaffordable, suggesting that • 5% are at risk of homelessness.
this is a factor impeding them from establishing their own
homes (Fig. 3.11).
Fig. 3.09: Anticipated Relocation, by Age and Tenure
Age 16-30
Percentage of Survey Respondents
from Each Age and Tenure Group
80%
Age 31-45
60% 55%
44% Age 46-60
40% 38% 36% 36%
27% 33% 30% 32%
23% 24% Age 60+
20% 22%
20% 17% 19%
14%
10% 11%
Home Owner
0%
I may move out of the I may move out of Burnaby I may move out of
neighborhood Metro Vancouver Renter
Fig. 3.09: Percentage of respondents anticipating a relocation within or beyond Burnaby in the next 10 years, by age range and tenure type.
24YOUR VOICE YOUR HOME: MEETING THE HOUSING NEEDS OF BURNABY RESIDENTS
Fig. 3.10: What Helps Make Your Housing Affordable?
I own my own place
34%
My income 25%
I have roommates and we 4%
share the cost of housing
I live with my family 4%
(I pay low or no rent)
Percentage of Survey Respondents
Fig. 3.10: Percentage of survey respondents stating that a given factor helped make their housing affordable.
Fig. 3.11: Housing Affordability by Housing Tenure
86%
Percentage of Survey Respondents
80%
65%
from Each Age Group
60% 52% 57% Affordable
48% Unaffordable
43%
40% 35%
20% 14%
0%
Co-op Home Owner Renter Live with family
(no or small financial rent)
Housing Tenure
Figure 3.11: Percentage of survey respondents from each housing type that find their current housing affordable or unaffordable.
25WHAT WE HEARD REPORT
Fig. 3.12: Housing Affordability by Annual Household Income
35%
Percentage of Survey Respondents for Each Income Bracket
30%
25%
20%
15%
10%
5%
0%
Under $20,000 $20,000 to $34,999 $35,000 to $49,999 $50,000 to $74,999 $75,000 to $99,999 $100,000 and over
Income Bracket
Affordable Unaffordable
Figure 3.12: Percentage of survey respondents from each income bracket that find their current housing affordable or unaffordable.
Fig. 3.13: Housing Affordability by Age
Percentage of Survey Respondents
80%
65% 71%
from Each Age Group
60% 57% Affordable
53%
43% 47% Unaffordable
40% 35%
29%
20%
0%
16-30 31-45 46-60 60+
Age Groups
Figure 3.13: Percentage of survey respondents from each age group that find their current housing affordable or unaffordable.
26YOUR VOICE YOUR HOME: MEETING THE HOUSING NEEDS OF BURNABY RESIDENTS
Fig. 3.14: Difficulty Finding Affordable Housing, by Age and Tenure
Age 16-30
Percentage of Survey Respondents
from Each Age and Tenure Group
80%
Age 31-45
60%
Age 46-60
43%
40% 38%
33% 30%
24% 26% Age 60+
20%
14%
9% 5% 12% 8% 5% 3% 9% Home Owner
4%
0% 1% 2% 1%
I cannot find I cannot afford to buy a home I have to live with friends or family
an affordable place to rent because I cannot afford a place Renter
of my own
Figure 3.14: Percentage of survey respondents experiencing difficulties finding an affordable home, by age range and tenure type.
Fig. 3.15: Financial Strain Due to Housing Costs, by Age and Tenure
Age 16-30
Percentage of Survey Respondents
from Each Age and Tenure Group
80%
Age 31-45
60%
Age 46-60
40% 36% 36% 37%
23% 24% Age 60+
21% 20%
20% 19% 14% 14% 17%
11% 13%
7% 9% 6% Home Owner
4%
0% 1%
I am struggling to I am spending more than 30% I cannot afford other necessities
pay my rent/mortgage of my pre-tax household income like food or transportation because Renter
on housing my housing costs are so high
Figure 3.15: Percentage of respondents experiencing financial strain due to the cost of their housing, by age range and tenure type.
27WHAT WE HEARD REPORT
Fig. 3.16: Housing Insecurity, by Age and Tenure
Age 16-30
Percentage of Survey Respondents
from Each Age and Tenure Group
80%
Age 31-45
60%
Age 46-60
40%
28% Age 60+
21%
20% 16%
9% Home Owner
5% 5% 6%
0%
2% 2% 3% 1% 0%
I am worried about having to move I am currently at risk of
(being demovicted or renovicted) becoming homeless Renter
Figure 3.16: Percentage of respondents experiencing housing insecurity, by age range and tenure type.
BURNABY HOUSING PROFILE
Name: Suneel
Age: 57
Housing Type: Home-owner
Housing Experience: Suneel lives with his wife and children in
South Burnaby. As a home-owner, he is concerned about rising
property taxes.
Looking ahead, Suneel worries about rising rent costs in Burnaby
and the impact this will have on his children. He would like to see
“We need to build neighbourhoods greater renovation credits for homeowners as currently there is
and communities where people can little incentive to upgrade.
live comfortably.”
28YOUR VOICE YOUR HOME: MEETING THE HOUSING NEEDS OF BURNABY RESIDENTS
CHALLENGES
& SOLUTIONS
29WHAT WE HEARD REPORT
Challenges and Solutions Question 12. What specific steps should the City of
Burnaby take to address community housing and
In addition to housing demographics, affordability and
housing affordability?
current and future needs, the online survey asked
respondents to reflect on housing challenges and A summary of the top challenges and solutions, based on
solutions. This section specifically reports back on two total number of responses, is presented below. These Top
open-ended survey questions: 6 Challenges and Top 6 Solutions were selected based
on popularity. Please note, the qualitative survey data for
Question 11. What do you think is the main housing
these two questions was incredibly detailed. As a result,
challenge facing Burnaby today?
direct (unedited) quotes from respondents are used to
illustrate each challenge and solution.
Top 6 Challenges Top 6 Solutions
1. Not enough affordable rental housing, especially for
specific population groups
1. Strengthen government oversight and regulation
2. Lack of specific sizes and types of housing
2. Demand accountability from developers
3. Speculative buying and foreign capital are raising
3. Allow laneway homes
prices
4. Encourage densification in strategic areas
4. Disconnect between prices and incomes versus
quality of available housing 5. Review taxation system
5. Loss of sense of community and quality of life 6. Stop demovictions
6. Risk of demovictions
Top 6 Challenges Challenge #1: Not enough affordable rental housing,
especially for specific population groups
Introduction
A large portion of survey responses highlighted an
Burnaby residents surfaced a wide range of housing- increase in housing costs across Burnaby, whether as
related challenges within the City. Many respondents renters or home owners. Residents referenced a trend
noted that the current housing supply and pricing towards “hundreds of affordable rental homes” being lost
does not meet the needs of residents, for a number of “while countless condos go up in their place”. At the core,
reasons, including: housing quality, cost and type, risk of respondents felt that what is available is not affordable. As
demovictions and foreign investment and speculation. one respondent noted:
These challenges are being felt disproportionately by
“[We need] truly affordable rentals, not some
specific demographics.
government idea that a 1-bedroom for $2300/month is
Additionally, housing unaffordability is directly impacting affordable, because it isn’t. It’s ridiculous. In Brampton,
the day-to-day lives and futures of Burnaby residents. As Ontario, I rented a 2700 square-feet 4-bedroom
a result, there is a strong sense that Burnaby is losing its detached house for $1700. That is affordable.”
character and sense of community.
30YOUR VOICE YOUR HOME: MEETING THE HOUSING NEEDS OF BURNABY RESIDENTS
According to respondents, there are specific “Choices seem to be a house or a massive tower. The
demographics that are most vulnerable to the lack of contrast is too stark. What is the problem with low-
affordable housing. These groups include: students, rise multi-unit dwellings? Some of us also like older,
young professionals, families, single seniors, low-income character, well-crafted buildings.”
individuals and those on fixed income such as pensioners, “Burnaby has a lot of large houses and small condos.
people on disability assistance and refugees. But there aren’t a lot of options for people who want to
“There are not enough affordable housing choices for live in a small house, but don’t like strata living.”
renters. Families with children [are] living in apartments Survey responses illustrated a wide range of housing
that don’t have enough rooms because that’s all they experiences, from those who are looking to enter the
can find and afford. Renters don’t want luxury condos, housing market for the first time and need for more ‘starter
they want safe, clean and affordable [homes].” homes’, to retirees who are looking to downsize and are
“There are barely any rental properties available that concerned they will not be able to afford to move.
we can afford. We are really worried that if these prices “Lack of affordable entry level housing options for first
continue my husband and I will be homeless someday. time buyers.”
We are seniors.”
“No good apartments to downsize to. High-rise living is
Respondents sensed they “will most likely be renting for not for us. Very few low rises available. North Burnaby
the rest of [their] life”, due to the lack of affordable options is a great neighbourhood but there are almost no
for first time homeowners, even those with stable or dual apartments. Only single-family homes.”
incomes. There was also a feeling that younger residents
must accept they will likely never own a home. Challenge #3: Speculative buying and foreign capital are
raising prices
“Ultimately, many - if not all - young adults are
A significant number of respondents outlined foreign
discouraged and recognize the unrealistic vision of
capital and speculative buying as two major issues
creating a life for themselves. I am in my mid 20s and
affecting housing affordability in Burnaby. Respondents
thinking ahead in terms of my first home purchase
described “people buying places as investments” with no
as well as my prospective family, both of which are
intention of living there, as causing an “artificial inflation
put on hold because that vision is simply a delusion.
of the cost of housing”. According to respondents, this
Something needs to change.”
trend has shifted housing from being a basic need to an
Furthermore, respondents noted that there are not investment or commodity.
enough resources to respond to the lack of affordable
There was also a pervasive feeling of resentment and
housing. Specifically, participants highlighted an overall
frustration expressed within the survey towards “outside
lack of social and non-market housing, as well as a lack of
investors who have bought up properties in Metro
shelters.
Vancouver as a way to invest/protect/shelter their money”,
Challenge #2: Lack of specific sizes and types of housing because these practices tend to “out-compete locals
In terms of housing type and size, survey respondents for housing”, making it “exaggeratedly unaffordable for
indicated that the current supply in Burnaby does not those who live and work here, to raise their children here,
meet the needs of residents. According to respondents, invest in their community and make their home here.”
what is available is limited to two main options: high- Some respondents expressed a strong bitterness towards
rise or single-family homes. There does not seem to be “wealthy satellite families (…) who pay minimal taxes”. A
sufficient options between either end of this spectrum, for few of the respondents went as far to recommend that
example: small rentals with bachelor suites, lofts, or 2 and “people who earn their living in other areas of the world
3+ bedroom apartments. [not be] allowed to bid on housing here”.
31WHAT WE HEARD REPORT
“The biggest challenges to housing in all Lower There were lines of people wanting a place 2X bigger
Mainland areas has been the evolution of housing than mine that was in a dark basement suite where the
as investments and not simply as homes. Houses are landlord insisted we use her old stained mattress to
perceived as assets that should increase in value and sleep on for $900/mo. I went to several others where
owning a home in a desirable location improves that people were expected to live in gross conditions”.
perceived value.” “The issue is that there are not enough places for rent,
A few respondents went even further to flag what which drives the prices of existing suites up. Not only
they refer to as “money laundering” through “casino this, but people will get desperate and rent places
capitalism”, organized crime, and tax evasion as drivers for without kitchen, places without privacy (bedroom), rent
inflating the housing market. living rooms.”
Challenge #4: Disconnect between prices and incomes “[I just want] somewhere that’s safe, clean and well
versus quality of available housing maintained. I’ve had to move 4 times because of
A large number of respondents indicated that not only problems with the rental units. No working fridge in
are housing costs prohibitive, but Burnaby wages are not two places. Leaks from the hot water heating as well
proportional to the cost of living in the Lower Mainland. as leaking pipes in the kitchen. Hot water coming out
of the cold-water taps. Front door left open by tenants
“Housing costs keep rising yet wages are not keeping
- no security…Landlords that don’t care about fixing
up with inflation, which puts the most vulnerable
major problems because they can get someone else to
citizens, such as seniors, disabled, single parent
rent their property.”
families, single income families and those living
paycheque to paycheque at risk of homelessness.” Challenge #5: Loss of sense of community and quality of life
“In order to buy in this city, people will have to spend Respondents reported that housing unaffordability is
a greater proportion of their income on mortgage/rent, also causing considerable social side effects which are
leading to no savings.” damaging to quality of life in Burnaby.
“Too much of our monthly income goes to housing A large proportion of respondents flagged that
costs which means the opportunity to save for the “infrastructure is not keeping up with the population
future is not possible.” increase” and there are “not enough support services to
cater to the influx of new residents”. Other issues raised
“No one but the filthy rich can afford to buy a family
were the lack of green and public spaces, as well as over-
home in Burnaby. Prices of homes are extremely
crowding in certain areas.
beyond what the average wage earner can afford.”
“I feel the culture and general happiness of our city
“High cost of living (especially for renters), little return
greatly suffers due to this [over-crowding].”
for cost. You spend half your income on housing that is
not maintained well, to a landlord who doesn’t answer “Children can no longer afford to live in the community
phone calls.” they grew up in leaving their aging parents to fend for
themselves (placing a greater burden on government
Moreover, there is a perceived gap between the quality of
agencies and stress on adult children). This is a recipe
available properties, especially rentals and the associated
for disaster on so many levels.”
price.
“Burnaby needs to grow in a [humane] manner that
“Some of the places for rent for a large cost are broken
allows a variety of people the ability to live, work [and
and falling down”.
play].”
“Availability for a place that is livable [is a challenge]. I
went to several open houses before finding my place.
32YOUR VOICE YOUR HOME: MEETING THE HOUSING NEEDS OF BURNABY RESIDENTS
Respondents noted that students keen to start their respondents who worried that tenants will not be able to
professional careers as well as young families cannot find alternative housing arrangements.
afford to live in Burnaby. The resulting exodus has caused “Too many demovictions -- too much development
a “brain drain” as these individuals are forced to move that removes low cost housing (e.g., Metrotown area is
further east. being completely demolished to make way for insanely
“Burnaby forgot what the original OCP was all about... expensive yet tiny apartment high rise buildings). The
which was to work and live in your own community. amount of homeless people therefore has increased --
(…) The people who are working in Burnaby NOW most of these are seniors -- it is a very sad situation.”
CANNOT afford to live here and the affordability gets “We are being demovicted and cannot afford the
pushed farther out to the Fraser Valley.” current astronomical rent prices!! There has to be
Burnaby’s sense of community and “neighbourhood feel” affordable apartments to rent. Not all of us can afford
has changed due to rapid, unchecked urban development. to buy a home, nor do we want to live in basement
“High-rise buildings being built next to single family suites.”
neighbourhoods or at locations that stand out” have Not only are there very few “alternative places to rent at
obstructed views and have “no aesthetic value”. the same price”, tenants also described being displaced
Respondents noted that in the name of densification, a “before there is a replacement to house [them]”. Some felt
significant proportion of the affordable rental stock that that residents were not being compensated properly and
was close to transit is being or has been replaced with often find themselves without a place to stay.
expensive luxury condos that current residents cannot “The demoviction of thousands of residents (including
afford. “This pushes those people further away from me) who cannot afford to buy a place, and either have
transit, shops, and community services who are most to rent or sleep on the street.”
reliant on public transit and walkability.”
Many survey respondents shared personal stories of
“Due to reliance on rental income, my neighbourhood demoviction, highlighting a serious toll on mental health
is (…) starting to lack identity and is becoming less safe. and well-being.
Specific to my area, multi families are residing in single
“Even though I currently have a place to rent, the
family dwellings, and property designated parking is
landlord is talking about demolishing the house and
not sufficient to accommodate multiple vehicles. As a
putting someone else in its place. I would like to live
result, there is an increase to street parking, and the
somewhere with some security, where I don’t have
entire neighbourhood is becoming more congested.”
to worry about being evicted. I’ve already been
Finally, respondents perceived that short-term rentals and demovicted twice since moving to the Lower Mainland
illegal rental suites tend to produce more transient and 8 years ago.”
empty neighbourhoods.
“Housing speculation and people not living in their
apartments or houses create dead zones”.
Challenge #6: Risk of demovictions
According to respondents, the current housing crisis has
translated into an increased number of demovictions as
well as renovictions (though less common). The issue
of demovictions was of widespread concern among
33WHAT WE HEARD REPORT
Top 6 Solutions “Food, shelter and health care are human rights. City
of Burnaby needs to take every step necessary to get
Introduction
them out of the free market and provide roofs for low
In response to the many housing challenges, respondents income families.”
offered a wide-range of housing solutions. What emerged
“While I realize it’s a concern, I’m not sure if it’s the City
from the survey results was a strong call to strengthen and
of Burnaby’s responsibility. I do believe in subsidized
review the various systems guiding government oversight,
housing but I think it should be under Metro Vancouver
development and taxation. More specifically, respondents
or provincial government. As a citizen and tax-payer
advocated for the respective regulating bodies to control
I believe we could assist in providing land but not
rising housing costs, curb ongoing speculation and
operating housing. This has not been successful in
provide more oversight of developers. Respondents
Vancouver and is not fiscally smart for Burnaby.”
also recommended Burnaby ease building and zoning
by-laws. They noted that while densification is excessive “Too many people want housing provided to them. We
in some areas (Brentwood, Edmonds, Lougheed and never demanded social housing as we paid our own
Metrotown were frequently cited), it could be increased way. I do not want to subsidize any one that could and
in other areas, specifically, single-family neighbourhoods. should work to pay their own way as we did. The only
However, any effort towards densification must consider persons that the governments should provide housing
diversity, walkability and community. for are the disabled, period.”
Solution #1: Strengthen government oversight and Solution #2: Demand accountability from developers
regulation
Overall, respondents noted a need for more oversight
Survey respondents offered many different solutions
over developers and, to a lesser extent, over realtors.
regarding the role of government (at all levels) in
However, as was flagged above, divergent views on this
regulating/overseeing the housing sector. While quite
topic were visible. The majority of respondents called for
broad, these solutions included:
government to oversee the development process much
• Better collaboration between all levels of government more “aggressively”, while a minority noted the benefit
to finance and build affordable housing; of “creative private public partnerships” and advised the
• Provision of City land for affordable housing government “work with the development community to
developments, including Co-ops; execute plans; don’t fight the developers, they have the
capability and capital to make great things happen, an
• Better financial support for social housing in Burnaby;
adversarial approach is a mistake.”
• Review government definition of ‘affordable’ housing;
“There should be *no* partnerships with developers.
• Stronger regulation and restrictions for foreign Developers should always be seen by the city as
housing investments; enemies, because that’s exactly what they are.
• Regulate short-term rentals; Developers are only there to line their own pockets
-- it’s a business. This has to be deeply punitive or it
• Limit the number of properties a person can buy;
won’t be effective.”
• Better regulation of construction and sales; and
“Realtors should have a cap on earnings & more
• Stronger oversight of landlords. restrictions when selling a home.”
It is important to note that there was division among the “Developers should not be given full sway in decision-
responses as to the degree of desirable and appropriate making regarding size or pricing of units.”
government intervention:
34You can also read