Situation Assessment in Villa Nueva - Prospects for an Urban Disaster Risk Reduction Program in Guatemala City's Precarious Settlements
←
→
Page content transcription
If your browser does not render page correctly, please read the page content below
Situation Assessment in Villa Nueva
Prospects for an Urban Disaster Risk Reduction
   Program in Guatemala City’s Precarious
                 Settlements

           Dr. Rebekah Green
           Dr. Scott Miles
           Walter Svekla

           Prepared for Oxfam-Great Britain
           Institute Working Paper 2009_1
           July 2009

                                               Western Washington University, 516 High Street,
                                              Bellingham WA 98225-9085 USA|+1 360.650.2707
                                                             www.wwu.edu/huxley/resilience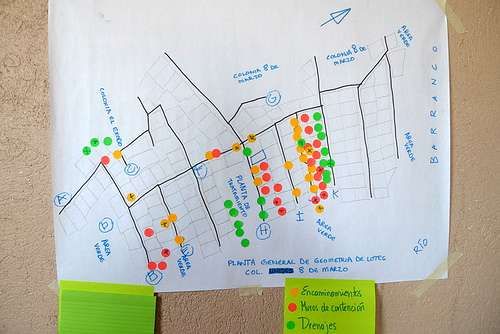
Situation Assessment -Green et al.
                                                                                                                             Working Paper 2009_1
                                                                                                                                         July 2009

                                                              TABLE OF CONTENTS
Summary .......................................................................................................................................... 3
Introduction and Background .......................................................................................................... 3
I. Household Surveys ........................................................................................................................ 6
    Response Summaries to Survey Questions.................................................................................. 9
    Synthesis and Discussion ........................................................................................................... 32
II. Household Case Studies ............................................................................................................. 35
    Young Mother at Ravine Edge ................................................................................................... 35
    Large Family ............................................................................................................................... 37
    Construction Worker and His Elderly Mother ........................................................................... 38
III. Focus Groups............................................................................................................................. 40
    Outline of Community Issues ..................................................................................................... 40
       Major Problems...................................................................................................................... 40
       Major Risks ............................................................................................................................. 41
    Community Mapping of Issues .................................................................................................. 43
       Las Brisas Community Mapping ............................................................................................. 43
       Unidos 8 de Marzo Community Mapping .............................................................................. 46
    Joint Discussion .......................................................................................................................... 49
    Interest in Additional Knowledge .............................................................................................. 49
IV. Organizational Analysis ............................................................................................................. 51
    Institutional Analysis Results ..................................................................................................... 51
    Institutional Analysis Discussion ................................................................................................ 55
V. Emerging Themes ...................................................................................................................... 57
    Flooding and Inadequate Drainage ............................................................................................ 57
    Slope Instability and Residents’ Perception of Flooding and Refuse Management .................. 58
    Conflicts between Formal and Informal Settlements ................................................................ 59
    Competing Jurisdictions and Missions ....................................................................................... 60
VI. Prospects for an Urban Disaster Risk Reduction Program........................................................ 60
Works Cited .................................................................................................................................... 61

                                                                               2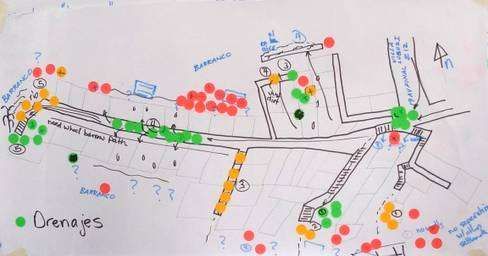
Situation Assessment -Green et al.
                                                                                      Working Paper 2009_1
                                                                                                  July 2009

                                              SUMMARY
In 2009, Oxfam-Great Britain in Guatemala asked The Resilience Institute of Western Washington
University to conduct a situation assessment of two informal communities in the outskirts of Guatemala
City, Guatemala. Oxfam sought to assess the potential for developing an urban disaster risk reduction
program within the metropolitan’s precarious settlements – informal settlements along the steep
embankments of ravines. These settlements are often rapidly constructed overnight using temporary
materials, with little possibility for considering the prevalent risk of landslides and seismic activity.
Because residents build these squatter settlements without municipal approval, the settlements are
considered illegal and often remain un-serviced for years.

The situation assessment took place in two pilot communities, located 16 kilometers south of the capital
Guatemala City in the municipality Villa Nueva. More specifically they are located in the El Mezquital
area and are called Las Brisas and Unidos 8 de Marzo. There, as elsewhere in the region, precarious
squatter settlements experience seasonal landslides, heavy rains, and reoccurring damage to their
property. The situation assessment included 65 household surveys, a physical risk assessment,
community focus group discussions, and meetings with national emergency management
representatives, local universities, research institutions, and municipal planning department. The
situation assessment formed a basis on which the Resilience Institute has worked with Oxfam-Great
Britain in Guatemala to formulate an initial disaster risk reduction framework. This framework is
applicable for many communities in Guatemala and the rest of Latin America, and is elaborated on in a
separate document.

The following section gives a brief overview of informal settlements in Guatemala, and in El Mezquital in
particular. This is followed by a detailed analysis of the household survey, a summary of the focus group
discussions, three case studies of settlement households, and a brief institutional analysis. The
document concludes with a brief synthesis of the work, through a discussion of 4 emerging themes and
a brief discussion about prospects for urban DRR in Guatemala City. Strategies for implementing a DRR
program are more fully elaborated in the companion document – Urban DRR Framework for
Guatemala’s Precarious Settlements.

                                INTRODUCTION AND BACKGROUND
Guatemala is located in Central America and is home to almost 13,000,000 people. It has high levels of
inequality throughout the country and is ranked 121 out of 179 on the United Nation’s Development
Programme’s Human Development Index (UNDP, 2008). Due to its high inequalities and poverty poorer
residents have built many informal settlements, especially in and around Guatemala City. The
metropolitan population in Guatemala City is 823,301 with 250,000 of those living in informal precarious
settlements (Diaz et al. 2000).

                                                   3
Situation Assessment -Green et al.
                                                                                       Working Paper 2009_1
                                                                                                   July 2009

Guatemala’s unstable political history is an underlying factor which has contributed to an increased level
of vulnerability for informal settlements. Years of social, economic, and political corruption and
inequality has deteriorated the local community’s trust and faith in the national level government.
Guatemalan politics lack transparency and accountability and have repeatedly failed to provide support
for its citizen’s. The main source of the law is the constitution of 1985 which was amended in 1993. It is
largely ineffectual. The lack of government influence in Guatemala has established it as one of the most
violent countries in Latin America, with almost 6,000 people murdered there last year. That is 46 victims
per 100,000 people, a rate eight times higher than in the United States (Rosenberg, 2008). The people of
Guatemala have limited political rights. A high degree of corruption exists in the country, especially in
the administrative, judiciary and corporate sectors. Efforts to promote transparency have made little
progress.

The 1976 earthquake marks the beginnings of a class struggle that has heavily influenced Guatemalan
society. The earthquake was a 7.5 magnitude centered in the Motagua Fault, about 160 km northeast of
Guatemala City. Over 22,000 people lost their lives in the quake, especially those that were living in
unsafe housing in the rural highlands and in informal squatter settlements. Those living in informal
settlements, primarily Mayan Indians, suffered the highest mortality rate. Residents of middle class
homes, which were better protected and more safely sited, experienced less destruction.
Disproportionate recovery efforts further segregated the populations. “The earthquake tore open many
holes in the social fabric which had already been stretched thin. The rich and those in power came out
richer and the poor came out poorer, and the differences and inequalities became more visible” (Davis
and Hodsen 1982, 15).

After the earthquake, years of civil war and genocide against the rural Mayan majority dominated the
political context of the country, further breaking down the governmental organization established to
ensure the livelihoods of their citizens. During this time, government soldiers herded hundreds of
thousands of Mayans into new settlements; others took refuge in remote forested mountains. These
population movements often involved marginalized people forced into marginal, precarious places.

The long civil wars and political unrest has undermined the ability of the central government to prevent
or mitigate hazard events. The Guatemalan poor have been caught up in a vicious cycle where a lack of
access to a means of social and self-protection has made them perpetually vulnerable to disaster after
disaster (Wisner 2000, 9).

Currently, there is a serious lack of affordable housing in areas that are near places of steady
employment. This political environment has established a situation that favors a migratory invasion
tactic for those who live in conditions beyond their means. Populations are driven to settle in precarious
areas susceptible to hazards. Most of the poorest housing exists in ravines and gorges which are highly
susceptible to landslides.

                                                    4
Situation Assessment -Green et al.
                                                                                        Working Paper 2009_1
                                                                                                    July 2009

The informal settlements are established by an invasion tactic often organized by a community leader.
All on the same day, a population leaves the formalized housing areas to take over a plot of land. Many
use the invasion to escape from oppressive and unaffordable conditions they experience in formal
sector rentals. Others join the invasion opportunistically. The prospect of owning or occupying land
informally is often too powerful to prevent settlements from establishing in highly vulnerable areas.

A study in 2009 of Knowledge, Attitudes and Practices of residents of informal settlements in the
Guatemala Metropolitan Area showed that community leaders know that they choose to live in an area
of high risk. They also know that they should not build houses larger than one story, and that their
building increases the environmental degradation. However, they believe that due to their economic
conditions they cannot aspire to live in a better place (KAP, 2008, 12). In most places there is no
organization in the event of a disaster and no plan to evacuate in case of an emergency (KAP, 2008, 15,
32). Many community leaders have expressed interest in developing a local Integrated Emergency Plan
(KAP, 2008, 73).

In informal settlements, houses are usually built incrementally over a number of years, with materials of
diverse origin and quality, and not always following accepted techniques. These houses rarely comply
with official safety standards and there are no controls in place to regulate safety. Standardized building
materials for housing like concrete, bricks and steel, are scarce and expensive, which makes it very
difficult for residents to properly reinforce their homes. Residents often resort to scavenging materials
like corrugated metal sheeting and other scraps or discarded resources. This results in haphazard and
unreliable construction. There are not many inflows of money into the informal settlements, thus
residents have a serious lack of capital for making significant structural improvements. Infrastructure is
limited and poorly maintained in the settlements. Residents often illegally tap electricity from more
developed neighborhoods and water is in limited supply. Formalized garbage disposal is infrequent and
often under-utilized; instead residents throw their garbage into the streets and the ravines.

The residents of El Mezquital describe the conditions of the terrain at the time of the invasion as “filthy
and stripped of vegetation” (Diaz et al. 2000). The initial invasion by thousands of families aggravated
these conditions. The lack of water, the discarded waste, the precarious dwellings, and overcrowding
resulted in a very low quality of life as well as high levels of mortality and morbidity, particularly for
children.

Since the initial invasions of El Mezquital however, there have been significant developments. After 15
years of community work, supported by external organizations, almost all the families in the settlement
of El Mezquital have access to water. COIVEES, a government agency, supplies 2,537 water meters with
clean, good quality water 365 days per year to El Mezquital, a much better service than most residential
areas receive in the rest of the city, including middle- and upper-income areas. The cost of getting
connected to the water system is 550 Quetzales for members of the Cooperative and 650 Quetzales for
non-members. The cost of water supplied by COIVEES is relatively low compared to the other providers
(Diaz et al. 2000). Ninety-five per cent of families have electricity in their homes (Diaz et al. 2000). The

                                                     5
Situation Assessment -Green et al.
                                                                                       Working Paper 2009_1
                                                                                                   July 2009

entire population of El Mezquital, some 3,500 families, has sewers and rainwater drains in their areas
(Diaz et al. 2000). Unfortunately, these drains are not properly maintained and often get clogged,
worsening flooding hazard.

Those living in the settlements discussed landslides and flooding as the most significant hazards to which
their community is susceptible. Eighty eight percent of Guatemala City is located in areas that have low
to moderate risk of landslides, while 10% is at high risk and 2% at very high risk (Diaz et al. 2000). The
winter months are a time of heightened level of vulnerability to hazards. Residents experience large
amounts of rainfall, which often flood into the streets due to clogged drains and increases soil
saturation, making the area more prone to landslides. Flooding and landslides combined repeatedly to
devastate the already dilapidated housing as water flows into homes and dislodges them.

                                       I. HOUSEHOLD SURVEYS
Western Washington University, through its Institute for Global and Community Resilience, with the
support of Oxfam, surveyed 64 households within two precarious settlements located in the
municipality of Villa Nueva during the weekend of March 22-23, 2009. Both settlements are within the El
Mezquital area of Villa Nueva, a municipality part of the Greater Metropolitan Area of Guatemala City.

The first settlement of Las Brisas, officially known as Brisas de Villa Lobos, consists of approximately 50
households spread primarily along a single path following a ridge finger. Several side paths lead down
into the ravine with a minority of households on the more modest upper slopes of the ravine. Western
Washington University researchers and three trained surveyors associated with Oxfam surveyed a total
of 27 residents on Saturday, March 22, 2009. We were welcomed into the community by three women
who were leaders in the Settlement Committee. They led us to each home and often introduced us to
the residents before we started the survey. Figure 1 is a photograph of the Las Brisas community plan.

                                                    6
Situation Assessment -Green et al.
                                                                                      Working Paper 2009_1
                                                                                                  July 2009

                                       Figure 1. Plan of Las Brisas.

The second settlement of Unidos 8 de Marzo, also known as Annexo 8 de Marzo, is a settlement along a
single wide face of a ravine. The community is made up of approximately 160 households. Multiple
pathways, some paved, others simply dirty paths, lead down the ravine face and divide the settlement
into sectors known as “manzanas”. Western Washington University researchers and the three trained
surveyors surveyed a total of 37 households on Sunday, March 23, 2009. Before beginning our survey in
Unidos 8 de Marzo, we met with three men and one woman, representatives of their Settlement
Committee, to discuss our purpose and approach. We also discussed plans for a focus group discussion
the following weekend and asked for their help recruiting five community leaders and five community
members to participate in the focus group discussion to be held the following Saturday. A member of
the Settlement Committee stayed with each survey team throughout the survey process, sometimes
staying for the interview, other times sitting nearby or leaving and returning after we had completed the
interview. Figure 2 is a photograph of the Unidos 8 de Marzo community plan.

                                                    7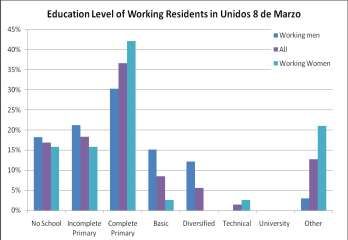
Situation Assessment -Green et al.
                                                                                        Working Paper 2009_1
                                                                                                    July 2009

                                     Figure 2. Plan of Unidos 8 de Marzo.

Table 1 is a brief summary of the people interviewed for the 64 household surveys:

                  Table 1. Number of surveys and average age of person surveyed, by sex.

                                Las Brisas                         Unidos 8 de Marzo

                                Count             Average age      Count          Average
                                                                                  age

            Men                 1                 68               12             29

            Women               26                36               25             34

            TOTAL               27                37               37             32

                                                       8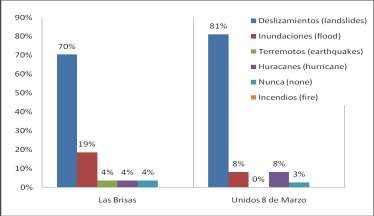
Situation Assessment -Green et al.
                                                                                        Working Paper 2009_1
                                                                                                    July 2009

Response Summaries to Survey Questions
Question 1. How many people live in your house?

The families surveyed were generally young couples with small children. Few families were made up of
older men or women, or of households that included elderly parents. The average number of children,
adults and elders per household, by sex, are described in Table 2 below.

                      Table 2. Average household size and composition, by sex and age.

                                                 Las Brisas          Unidos 8 de Marzo

                Girls (65 yrs old)      0.0                 0.1

                Boys (65 yrs old)        0.1                 0.0

                AVERAGE HOUSEHOLD SIZE           4.9                 4.8

Question 2. How many years have you lived in this settlement?

Both settlements were created by land invasions, and most lots were occupied within the first week of
the invasion. As such, most households reported having lived in the settlement for a similar length of
time, though some reported moving into the settlement to live with family or buying their lots from an
original invader. From the responses, and from older satellite images, it appears that a few household
existed in the area prior to the land invasion. Table 3 shows the median, minimum and maximum
reported length of occupancy in each settlement.

                                                       9
Situation Assessment -Green et al.
Working Paper 2009_1
July 2009
Table 3. Length of occupancy in settlement in years.
Unidos 8 de
Las Brisas
Marzo
Median 6 8
Maximum 9 9
Minimum 0.5 1
Question 3. Why did you come to live in this settlement?
Table 4 illustrates the varied reasons respondents moved into the two settlements. When asked why
they had come to live in the settlement, two thirds of the survey respondents spoke about renting
elsewhere before invading the ravine. Most noted that rent was too expensive, that rent had increased,
or that they had not paid rent and were evicted or pressured to leave. Some simply noted that they had
been renting, learned of the invasion and came. Their answers implied that renting was not desirable, in
comparison to “owning” a piece of land, even if it was not legally theirs.
About 14% of the respondents noted wanting or needing their own place to live as the primary reason
for coming to the settlement. These respondents mentioned living with family, in other formal and
informal settlements, and needing a space for a family of their own. For instance, one woman
mentioned that there were no vacant lots in the informal settlement where her extended family lived.
Some respondents mentioned that they moved to the settlement to not only eliminate rental costs, but
because landlords did not want families with children to rent their apartments.
Four respondents, representing 6% of the total, had been displaced from other communities. Three of
these had been displaced from coastal towns devastated by Hurricane Stan. With the destruction of
their homes on the coast, they had come because of familial ties to someone already living in the
settlements.
About 14% did not give a direct reason for moving to the settlement. Instead they mentioned that they
learned of the invasion, saw it as an opportunity, and took it. Some came to join other family members;
others simply saw signs of invasion or heard of it through family, neighbors, or community leaders. Two
families mentioned that they came because they were having trouble raising their children in their
previous location.
10Situation Assessment -Green et al.
Working Paper 2009_1
July 2009
Table 4. Reasons for coming to the settlement.
Las Brisas Unidos 8 de Marzo Both Settlements
Rent 15 55% 27 73% 42 66%
Need own place to live 4 25% 5 14% 9 14%
Displacement 3 22% 1 3% 4 6%
Saw opportunity 5 18% 4 10% 9 14%
TOTAL 27 100% 37 100% 64 100%
Question 4. How did you come to obtain your lot?
When asked how they obtained their property, most interviewees responded that they purchased the
land or simply obtained it through occupying the land. A few mentioned that they received the plot as a
gift from a family member or from the settlement community. This latter option most likely refers to
people who lived in the settlement previously, but lost their homes due to erosion and were resettled
on a new land plot.
While not the focus of the survey, the results of this question suggest a different strategy for invasion
between the two settlements. In Unidos 8 de Marzo, 70% the households surveyed stated they obtained
land through direct invasion and occupancy, while less than a quarter stated that they had purchased
the land. In contrast, 44% of the households surveyed in Las Brisas stated that they had purchased the
land with 52% saying they had obtained it through direct invasion. It is possible that the purchase of
land refers to the practice of community leaders organizing a land invasion and then “selling” the land to
those who desire to invade. If so, it appears that this practice was more widespread in Las Brisas than in
Unidos 8 de Marzo. Figure 3 illustrates how land acquisition varied among respondents.
11Situation Assessment -Green et al.
Working Paper 2009_1
July 2009
Figure 3. How residents obtained their lots in the precarious settlements.
None of the residents interviewed in the two communities had a legal title deed to their property. When
asked whether they were in the process of applying for a title deed, the vast majority stated that they
were applying for a title deed to the national agency UDEVIPO, the Unit for Development of Popular
Housing. Some said that they were applying to the settlement committee, which was submitting
paperwork to UDEVIPO. Using the settlement committee as an intermediary seemed to occur when
household members had limited capacity to read and fill in the application forms. Only one household in
Las Brisas and two households in Unidos 8 de Marzo had not started the process of applying for land
title.
Question 5-6. How long has it taken to build your house? Of what material is it made?
On average the households surveyed in Las Brisas have been living in the settlement for six years, as
shown above in Table 3, and have been working on the construction of their present home for the last
three years. Their homes are single story and have on average, two to three rooms. Walls are typically
constructed of cinder block or are framed with wood studs and covered with corrugated metal, a
material that offers poor insulation. Some houses have coverings of wood planks and/or other scrap
material. Floors are predominantly compacted cement, with about one third of the homes still having
earth floors. Almost all roofs are made from the same corrugated metal, and their susceptibility to being
blown off during high winds is indicated by the use of stones and broken cinder blocks to weigh them
down.
12Situation Assessment -Green et al.
Working Paper 2009_1
July 2009
Residents in Unidos 8 de Marzo reported having lived in their settlement longer than those in Las Brisas,
an average of 8 years. They also reported that they had been working on the construction of their
present home for longer than Las Brisas residents, on average, six years. However, the homes in Unidos
tended to be smaller and of less permanent material, than those of Las Brisas. Over half of the residents
surveyed in Unidos had dirt floors and nearly three-quarters of the houses were made of wood frame
and corrugated metal walls. All had corrugated metal roofs. Table 5 illustrates housing construction type
in the two settlements.
Table 5. Material composition of settlement houses.
Unidos 8 de Both
Las Brisas
Marzo Settlements
Coun Coun
% % Count %
t t
Floor Construction
Earth (tierra) 9 33% 20 54% 29 45%
Compated cement (torta de cemento) 17 63% 17 46% 34 53%
Tile (ceramica) 1 4% 0 0% 1 2%
Wall Construction
Wood plank (madera) 0 0% 0 0% 0 0%
Cinder block (block) 7 27% 0 0% 7 11%
Corrugated metal (lámina) 12 46% 27 73% 39 62%
Mixed materials (mezclado) 7 27% 10 27% 17 27%
Roof Construction
Corrugated metal (lámina) 26 96% 35 97% 61 97%
Concrete (concreto) 1 4% 1 3% 2 3%
Average number of rooms per house 2.3 1.7 2.0
Average length of construction, in years 3.0 6.0 5.0
13Situation Assessment -Green et al.
Working Paper 2009_1
July 2009
Question 7, 10, 12. Do you have sanitation, electricity, phone and television?
Over 90% of residents in both settlements reported having electricity in their home. Despite being the
newer settlement, 100% of those surveyed in Las Brisas had a toilet on their lot or in their house. A
slightly smaller percentage, 94%, or residents in Unidos 8 de Marzo had a toilet. Television and cell
phone ownership was over 80% for both settlements, though slightly lower for Unidos. Table 6
illustrates the percentage of respondents with electricity, phone and television.
Table 6. Percent households with electricity, phone and television.
Las Brisas Unidos 8 de
Marzo
Toilet 100% 94%
Electricity 93% 92%
Phone or cell phone 93% 80%
Television 89% 81%
Question 7a. Who do you pay for electricity?
While over 90% of the residents surveyed had electricity, payment for that electricity varied. Table 7
shows respondents means of electricity acquisition. The majority paid the electric company or
municipality. Because electricity was not metered at each individual lot, residents chipped in to cover
the cost of the electricity for the entire community or for section of the settlement. Some residents
reported taking electricity from a neighbor and paying them accordingly. A small percentage of
respondents reported not paying at all, though community leaders suggested that the percentage of
people in the community who did not regularly contribute to the electricity bill was actually quite high.
14Situation Assessment -Green et al.
Working Paper 2009_1
July 2009
Table 7. Electricity acquisition.
Unidos 8 de
Las Brisas Both Settlements
Marzo
Count % Count % Count %
Electric company or municipality
(Empresa de 22 88% 19 56% 41 70%
electricidad/municipio)
Neighbor
2 8% 14 41% 16 27%
(un vecino)
We do not pay
1 4% 1 3% 2 3%
(no pagamos)
TOTAL 25 100% 34 100% 59 100%
Question 8. How do you get water?
All of the Las Brisas residents had piped water into their home or outdoor kitchen area. Only 60% of the
residents surveyed in Unidos 8 de Marzo had piped water. Twenty-three percent bought water from a
neighbor who did have piped water, and another 17% bought water through other means such as
purchasing from a water truck in the legal neighborhood above or from a store, and rainwater
catchment. Table 8 shows how respondents in the two communities access water.
15Situation Assessment -Green et al.
Working Paper 2009_1
July 2009
Table 8. Water acquisition.
Unidos 8 de
Las Brisas Both Settlements
Marzo
Coun
Count % Count % %
t
Piped water system 100
27 11 30% 38 60%
(Red/tuberia) %
Buy from neighbor
0 0% 15 40% 15 23%
(se la vende el vecino)
Other
0 0% 11 30% 11 17%
(Otro)
100
TOTAL 27 37 100% 64 100%
%
Question 9. To where does your toilet drain?
All residents interviewed in Las Brisas had toilets or latrines on their property, while 94% of Unidos
residents had toilets or latrines. None of the sewage from these toilets entered the municipal sewage
treatment system. Rather, the overwhelming majority of sewage and waste water connected to an
informal settlement drainage system that emptied into the ravine just below the lower edge of the
settlement. A small fraction had sewage pits. Table 9 shows toilet and latrine access and drainage in the
two settlements.
16Situation Assessment -Green et al.
Working Paper 2009_1
July 2009
Table 9. Toilet and latrine access and drainage.
Unidos 8 de
Las Brisas Both Settlements
Marzo
Coun
Count % Count % %
t
Sewage drains to ravine
19 91% 31 83% 50 87%
( barranco)
Sewage drains to pit or septic
2 9% 4 11% 6 10%
(a flor de tierra, pozos ciegos)
No toilet or latrine/Uses
neighbors 0 0% 2 6% 2 3%
(Nada)
100
TOTAL 21 37 100% 58 100%
%
Question 11. How do you dispose of household waste?
About half of the residents of Las Brisas and about 40% of the residents of Unidos reported paying for
trash collection, at a rate of about 35 Quetzales a month. However, anecdotal evidence suggests this
may have been an over reporting. A community leader in Las Brisas and one of the respondents noted
that only 5 households out of about 50 regularly paid for trash collection. Table 10 documents the
responses regarding household waste disposal. About a quarter of respondents noted that they burned
their trash. Twelve percent of Las Brisas respondents and nearly half of Unidos respondents said that
they threw their trash into nearby trash piles, usually a pile at the edge or bottom of the ravine. It is
likely that households engage in a multiplicity of trash management strategies simultaneously, and that
throwing trash into the ravine increases when financial resources for trash collection or fuel for burning
are limited.
17Situation Assessment -Green et al.
Working Paper 2009_1
July 2009
Table 10. Disposal of household waste.
Unidos 8 de
Las Brisas Both Settlements
Marzo
Coun
Count % Count % %
t
Pay for trash collection
(cuentan servicio de 13 50% 12 32% 25 39%
recoleccion)
Burn it
10 38% 8 22% 18 29%
(la quemamos)
Throw it in a trash pile nearby
3 12% 17 46% 20 32%
(la tiramos en algun lugar cerca)
100
TOTAL 26 37 100% 63 100%
%
Question 13. In your opinion, what is the biggest problem in your settlement?
Table 11 illustrates respondents’ perceptions of problems in their community. Half of the respondents
mentioned rain and water related problems as the biggest problem in their settlement. Most
respondents saw rain as a serious problem because of ineffective and inadequate drainage. Rainwater
and overflowing sewage water regularly ran down the pathways and through homes in the winter. As
one Las Brisas women stated, “When it rains the water can clog the drains. All the water comes and
floods houses.” Others noted that rain water from the roofs and eaves of one house often poured water
onto downhill neighbors, flooding their insides, collapsing the downhill house or destroying precarious
retaining walls between lots. Many mentioned that litter clogged drains, exacerbating the drainage
problem during heavy downpours.
18Situation Assessment -Green et al.
Working Paper 2009_1
July 2009
Table 11. Respondents’ major concerns about their settlement.
Unidos 8 de
Las Brisas Both Settlements
Marzo
Coun
Count % Count % %
t
Drainage 13 48% 21 57% 34 53%
Landslides and housing collapse 12 41% 10 27% 22 33%
Other Problems 3 11% 6 16% 9 14%
100
TOTAL 27 37 100% 64 100%
%
A third, 33% of the respondents, mentioned problems related to landslides and housing collapses. When
discussing problems in their settlements, these respondents were concerned about landslides that
resulted from living on the steep slopes of the ravine. Respondents explained that these landslides
caused the regular collapse of housing and retaining walls in the settlements. Others mentioned
concerns about being near the eroding edge of the ravine, fearing the collapse or loss of land that came
with heavy winter rains. Rain was also mentioned in terms of saturation of the soil and heightening the
risk of landslides throughout the settlement, but especially at the ravine edges. As one resident of
Unidos 8 de Marzo stated, the landslides meant that at any moment they were at risk of sliding down
the ravine. “We can all go” in a landslide. Others noted that they feared landslides most because “they
had lived [them] in the flesh.” It was not a theoretical hazard, but a daily reality. Many other residents
were concerned about the effects landslides had on their land. They noted that landslides reduced their
lot sizes, especially for those at the bottom of the ravine. A few simply noted that they were scared of
living in the ravine, especially near the bottom, but did not specifically mention the issue of landslides.
Considering the two most mentioned themes of drainage problems and landslide and housing collapse
problems together, it is clear residents believed that heavy rains triggered the primary problems they
had in their settlement. Heavy rain resulted in overflowing drains and household flooding, and it, along
with vegetation clearing and higher intensity land use may contribute to slope destabilization and lead
to loss of land and housing collapse.
A small percentage of the respondents listed other problems with their community. These included
litter, garbage, lack of roads, and problems with neighbors.
19Situation Assessment -Green et al.
Working Paper 2009_1
July 2009
Question 14. In your neighborhood, there are many risks from landslides, fires, earthquakes, floods, and
hurricanes. What hazard concerns you most and why?
When asked which natural hazard affecting their community was the most serious, respondents
overwhelmingly chose landslides over fire, earthquake, flood, hurricane and none. As noted in Figure 4,
over three-quarters of the residents were most concerned about landslides. Of these, a third spoke
about landslides in connection with the weather patterns of the region. Respondents reported that
heavy rains in the winter, combined with sandy soil, resulted in unstable ground. They stated that they
felt the constant threat of landslides when it rained.
Three residents of Unidos and one Las Brisas resident did not see the threat of landslides as only a result
of heavy rains. Rather, they mentioned issues of poor drainage and trash clogging the drains. One
resident of Unidos explained that “There is a lot of trash up there [in the formal settlement] and the
drains overflow and the water falls into our homes.” Another woman noted that “when it rained, water
went everywhere.” The heavy rains overflowed the drains, ran through their homes, and soaked into the
soil. Thus, landslide risk was understood by settlement residents as linked to issues of urban planning
associated with drainage and the inadequate handling of rubbish.
Figure 4. Natural hazard about which respondents were most concerned.
A minority of respondents, 12% of all surveyed, said they were most concerned about flood events. They
reported that rain water got everywhere, causing mud, clogging drains and pooling in ways that
respondents believed resulted in health hazards. One resident also mentioned that excess water
engorged the river below the settlement. Those that mentioned hurricanes, about 6% of respondents,
noted that the heavy winds and rains pulled off corrugated tin roofs and forced the evacuation of their
families or neighbors. Others mentioned that hurricanes resulted in the flooding and landslides which
concerned other residents. Only one resident mentioned earthquakes as a major concern. He was most
concerned about this hazard because he viewed it as an act of God that no human could control.
20Situation Assessment -Green et al.
Working Paper 2009_1
July 2009
Question 14b. Is there anything that makes this hazard worse?
When asked whether any actions made risk to landslide, flood, fire, earthquake, and hurricane worse, a
little less than a quarter of the respondents did not believe that anything made these risks worse. A little
more than a quarter indicated ecological triggers such has heavy rains as making risk worse. However,
over half of the respondents, 54%, saw human action as a trigger for natural hazard risk. Most
predominantly, residents mentioned trash and litter as a significant human-induced trigger to landslide
and flood risk in particular. Residents noted that this trash fell into gutters and drainage systems,
causing them to overflow. The overflowing water then directly caused flooding in homes and settlement
paths, while they believed it also saturated the soil and increased the risk of landslide. As one woman in
Las Brisas explained, “People have no awareness about litter.” Another woman explained, “They throw
garbage on the street, it covers the drainage system and affects us all, as only 5 [households] pay for
garbage collection.” A resident of Unidos 8 de Marzo commented, “People do not cooperate, they throw
garbage on the street and that makes the water run.” Inadequate household waste disposal and
inadequate awareness of the effects of littering were, therefore, perceived as an underlying cause for
much of the natural hazard vulnerability experienced in these settlements.
Table 12. Triggers that worsen hazard of concern.
Respondents % Respondents
Did not know 12 19%
Ecological triggers 17 27%
Human-enduced triggers 34 54%
Trash and litter in gutters 15 24%
Inadequate drainage 14 22%
Other human triggers: burning, poor construction 5 8%
Total 63 100%
A slightly smaller number of residents only mentioned inadequate drainage without connecting this to
concerns about litter. Five residents mentioned other human-induced triggers of natural hazard risk.
Poor construction and ongoing poverty were mentioned; burning of firewood to deal with household
waste and to cook on open air grills was also mentioned. This last trigger may have been seen as being
related to loss of slope vegetation. Table 12 illustrates the triggers affecting respondents’ risk.
21Situation Assessment -Green et al.
Working Paper 2009_1
July 2009
Question 15. What measures have you taken to reduce risk to your house and family from the risk that
concerns you most? Have these measures been effective?
When residents were asked if they had tried any mitigation measures to reduce the risk of natural
hazards to their household, 52 responded that they had, while 12 responded that they had not. Table 13
shows the mitigation measures that respondents reported to have done. Of those who had tried
mitigation measures, the most frequently mentioned mitigation measure was some form of ground
alteration. This consisted of creating drainage troughs, clearing drains of litter and paving exposed soil
with cement caps or cement pathways to reduce erosion. Respondents also frequently mentioned
constructing retaining walls, called muros. Construction of retaining walls accounted for 29% of
mitigation measures mentioned as a strategy for reducing risk to natural hazards. Residents mentioned
constructing muros from sandbags about half the time, corrugated sheet metal in a little more than a
quarter of the instances, and an unspecified material a little less than a quarter of the time. Other
mitigation actions mentioned included planting vegetation and properly disposing of trash.
Table 13. Mitigation measures respondents took to address hazard of most concern.
Response % of % All
Count Subcategory Responses
Ground Alterations 26 100% 36%
Creating drainage troughs 11 42% 15%
Clearing drains 9 35% 13%
Cement and paths 6 23% 8%
Building Retaining Walls 21 100% 29%
Sand bags 10 48% 14%
Sheet Metal 6 29% 8%
Other or unspecified materials 5 21% 7%
Other Mitigation Actions 13 100% 17%
Planting and vegetating 6 46% 8%
Proper waste disposal 5 39% 7%
Fasten roof 1 7% 1%
22Situation Assessment -Green et al.
Working Paper 2009_1
July 2009
Awareness of conditions 1 7% 1%
Engaged in No Mitigation Actions 12 100% 17%
TOTAL MITIGATION MEASURES
72 100% 100%
DESCRIBED BY RESPONDENTS *
*Total is higher than survey count of 64 because some residents mentioned trying more than one type
of mitigation measure.
When asked if their mitigation measures had been effective, 78% of respondents who stated they had
done mitigation said that it was effective. The remaining 22% said that their efforts had not been
effective. Some of the reasons respondents thought their mitigation efforts were not effective were:
walls and drainage paths created were not strong enough and thus were washed away by the rain or
that their neighbors were not able to do the same mitigation, thereby undermining their own efforts.
Question 16. What more [mitigation] would you like to do?
Table 14 lists mitigation measures that respondents indicated they would like to perform in the future.
When asked what more they would like to do to reduce their risk, about half of the residents mentioned
wanting to build or improve their retaining walls. About a quarter wanted to improve housing
construction, including improve foundations, walls and roofing. A smaller percentage was interested in
improving drainage and troughs while only a few mentioned other mitigation measures, including trash
disposal and dealing with community communication and conflict. Two respondents claimed they could
not engage in more mitigation because they lacked time, one stated their household did not have
authorization; the remainder, 83%, said that the reason they had not engaged in these activities was
because they lacked the financial resources to do so.
23Situation Assessment -Green et al.
Working Paper 2009_1
July 2009
Table 14. Further mitigation measures respondents wanted to personally take.
Response % All
Count Responses
Re/building retaining walls 39 48%
Improve Construction 18 22%
Improve/build drainage or
17 20%
trough
Other Mitigation or
8 10%
Improvements
TOTAL 82 100%
*Total is higher than survey count of 64 because some residents mentioned trying more than one type
of mitigation measure.
Question 17. What has the municipality and / or public institutions implemented to reduce risk to your
home and neighborhood?
When asked what the municipality or public institutions had done to mitigate the settlement’s risk to
natural hazards, 31 respondents, 48%, answered that the municipality and other public institutions have
done nothing to reduce risk. The remaining 52% answered that public institutions had helped their
settlement mitigate their risks to landslides and flooding. Answers were generally evenly split between
stating that public institutions provided construction materials for walls and houses and that public
institutions improved settlement infrastructure such as drains and pathways. A small number of
respondents mentioned help with obtaining utilities such as water, electricity and public lighting.
24Situation Assessment -Green et al.
Working Paper 2009_1
July 2009
Table 15. Mitigation measures implemented by public institutions.
Response % of % All
Count Subcategory Responses
Public institutions have not 100%
31 48%
supported mitigation
Public institutions have 100%
33 52%
supported mitigation
Provide construction materials 57%*
19 29%
(walls and houses)
Improved settlement 48%*
infrastructure 16 25%
(paths and drainage)
Utilities 21%*
(water, electricity, public 7 11%
lighting)
TOTAL 64 100%
*Subcategory percentages do not total to 100% because some respondents mentioned public
institutional support for more than one category of activity.
Despite the wording of this question, it is important to note that many respondents readily distinguish
between the municipality and other institutions like UDEVIPO and DAVHI, and respondents in general
perceived differences in their relative contribution to the community. For example, a not uncommon
reply was that the municipality has done nothing but that UDEVIPO has contributed materials for the
construction of retaining walls.
For the most part, when measures have been taken they are considered to have been effective. Of the
over half of residents who responded to this question, 63% said that the measures taken by public
institutions had been effective. One resident did point out how a constructed retaining wall failed
because it did not allow for the adequate drainage of water.
25Situation Assessment -Green et al.
Working Paper 2009_1
July 2009
Question 18. What more could the municipality or other institutions be doing?
Over 50% of the responses indicated the respondents’ desire to see the municipality and other public
institutions improve settlement infrastructure like paths and alleys, drainage, and retaining
walls. Outside of these specific infrastructural improvements, over 10% of the responses articulated a
desire for assistance in obtaining construction materials; however, respondents were not specific in
saying whether these materials would be utilized for house, wall, path or drainage construction. Along
the same lines, respondents noted they would like to just receive more attention and help in general as
someone commented that "others need to come and see the danger under which we live." In stark
contrast to the majority of respondents that express a desire for direct aid for improving local living
conditions and to mitigate risks, two respondents mentioned resettlement somewhere else as a
potential mitigation measure the municipality or other public institutions could take.
Table 16. Further mitigation measures respondents wanted public institutions to take.
Response % All
Count* Responses
Improve settlement infrastructure (paths, drainage,
45 52%
walls)
Assistance in obtaining construction materials 10 11%
Attention and help 9 10%
Utilities and services (water, lights, garbage) 9 10%
Don't know 5 6%
Other 7 8%
Resettle somewhere else 2 2%
TOTAL 87 100%
*Total is higher than survey count of 64 because some residents mentioned trying more than one type
of mitigation measure.
26Situation Assessment -Green et al.
Working Paper 2009_1
July 2009
Question 19. What have community organizations done to reduce risk in your home and neighborhood?
The diversity and quantity of measures instituted by community organizations gives a strong indication
that community organizations are relatively active in the settlements and that their work does not go
unnoticed. A good deal of the responses, over 60%, indicate the dedication of efforts toward
formalizing these land occupations in terms of providing lifeline services like water and electricity (28%),
improving settlement infrastructure like walls and paths (21%), and initiating processes to secure legal
ownership of lots by their residents (15%). In these very direct ways community organizations have
worked to raise standards of living and to ease some of the discomforts of constructing homes on at the
edges and within ravines. Community organizations, according to responses and not surprisingly, also
seem to provide some managerial and technical expertise outside of construction practices. They are
seen to provide expertise for the management of supplies and materials and for negotiating politics and
policy and making solicitations on behalf of the settlements to the municipality and other entities of
interest. Community organizations mentioned include UDEVIPO, FOGUAVI, COIVIEES, and the
settlement Committees.
Table 17. Mitigation measures implemented by community organizations.
Response % All
Count* Responses
Utilities (water and electricity) 28 28%
Improve settlement infrastructure (walls and paths) 21 21%
Assist with securing land title 15 15%
Help, support, management, supplies, materials 12 12%
Make official requests on behalf of settlement 10 10%
Other
(programming for kids, community center, bolsa 9 9%
solidaria)
Don't know 5 5%
Nothing 1 1%
TOTAL 101 100%
27Situation Assessment -Green et al.
Working Paper 2009_1
July 2009
Almost all of the respondents feel that measures implemented by community organizations have been
effective.
Question 20. What else could community organizations do?
When asked what more could be done by community organizations, responses were similar to earlier
questions: respondents in the settlement wanted community organizations to support further
improvement of settlement infrastructure, solicit more aid or assistance, or assist with securing land
title. However, it is interesting to note that almost one-fifth of the responses, 19%, express a desire for
these organizations to work toward and encourage more unity and solidarity among settlement
residents. In this way, respondents do not view themselves as individuals or individual households
struggling in isolation from one another. They are aware of a settlement unity created by shared
geography and the associated exposure to hazards, as well as their legal status. This idea also
manifested itself in question 18 above when a respondent commented that the municipality and other
institutions should be assisting all residents and not just some of them.
Table 18. Further mitigation measures respondents wanted.
Response % All
Count Responses
Solicit more aid/assistance 26 36%
Assistance soliciting land title and utilities 18 25%
Foment more community
14 19%
organization/solidarity/consensus
Improve settlement infrastructure (paths, drainage,
11 15%
walls)
Don't know 4 5%
TOTAL 73 100
*Total is higher than survey count of 64 because some residents mentioned trying more than one type
of mitigation measure.
28Situation Assessment -Green et al.
Working Paper 2009_1
July 2009
Question 21. What other institutions could or should add support to prevent damage from risks to your
property?
Respondents were asked what other institutions could or should be lending support in regard to the
hazards that they and their communities face. National government and institutions topped the list at
32%. These responses included "the government" as well as more specific answers like the congress and
the first lady. National institutions with which the residents were already familiar due to past assistant –
institutions like UDEVIPO, FOGUAVI, FONAPAZ and EMPAGUA - were also mentioned. The municipality
and foreign assistance tied for second place at 18% each. The idea of the municipality is relatively
straightforward; however, some confusion arose when trying to pin down whether a particular
settlement is located within the municipality of Villa Nueva or Guatemala City. Foreign assistance
includes other countries, international organizations, and foreigners also were mentioned in 18% of the
responses. CONRED as the National Coordinator for the Reduction of Disaster was mentioned in 13% of
the responses. It should also be noted that three responses alluded to and recognized the ability of
residents to help themselves.
Table 19. Institutions respondents believe should support mitigation in settlements.
Response % All
Count Responses
National government/institutions 30 32%
Municipality 17 18%
Foreign assistance 17 18%
Don't know 13 14%
CONRED 12 13%
Help ourselves/settlement committee 3 3%
Other 3 3%
TOTAL 95 100
*Total is higher than survey count of 64 because some residents mentioned trying more than one type
of mitigation measure.
29Situation Assessment -Green et al.
Working Paper 2009_1
July 2009
Question 22. Who works in your household, in what sector, and what is their level of educational
obtainment?
About half of the working residents interviewed in Las Brisas had incomplete primary schooling or no
formal education. About half, 49% had a primary education or higher, as shown in Figure 5. The
education pattern was similar in Unidos 8 de Marzo, as shown in Figure 6. In Unidos 8 de Marzo, 35% of
the working residents surveyed reported no school or incomplete primary school. Just over half, 52%,
reported having completed primary school or higher.
In Unidos 8 de Marzo, there was sufficient gender parity in survey numbers to assess education levels by
gender. This is shown in Figure 6. While slightly more men had incomplete primary education or no
schooling, overall, men had more and higher levels of educational attainment. Very few women had
basic, diversified, or technical education.
Figure 5. Education level of working residents in Las Brisas.
30Situation Assessment -Green et al.
Working Paper 2009_1
July 2009
Figure 6. Education level of working eesidents in Unidos 8 de Marzo.
Question 26. Do you receive remittance?
When asked if the household received remittance for relatives or friends abroad, only one family in Las
Brisas replied that they did receive remittance. Two other households in Las Brisas and two households
in Unidos 8 de Marzo chose not to answer this question. While remittance is an important part of the
Guatemalan economy for many households, it appears that the vast majority of households surveyed in
these two precarious settlements do not have access to remittance as a supplement to their own
income. Since remittance is often used for large, one-time expenses such as housing construction and
infrastructure upgrading, these informal settlement residents appear to have few personal resources for
capital intensive community improvements.
Question 27. How much per month do you spend on rent or payment for the land, light and water,
transportation, school fees, and food/sustenance?
Table 15 shows the average household and per person monthly spending for respondents in both
communities. Las Brisas residents reported spending about a 15% more on rent, light, transportation,
school fees, food and water than those of Unidos 8 de Marzo. On average, residents said they spent
approximately 400 Quetzals a month per person. This is roughly equivalent to 50 USD or about $1.60 a
day on basic needs. Large, one time purchases were not considered in this calculation.
31Situation Assessment -Green et al.
Working Paper 2009_1
July 2009
Table 20. Average monthly expenses by settlement.
Average Household Monthly Average Household Monthly Expenses
Expenses per Person
Las Brisas 1,870 Quetzales 419 Quetzales (Min:132, Max:840)
Unidos 8 de Marzo 1,593 Quetzales 363 Quetzales (Min: 100, Max:733)
AVERAGE 1,707 Quetzales 386 Quetzales (Min: 100, Max:840)
Synthesis and Discussion
After compiling, organizing and analyzing the data collected from the surveys, several key themes
became apparent. These themes include how and why people came to live in these settlements,
connections between demographics and the physical site, the relationship between hazards and
mitigation efforts, and a comparison of mitigation measures taken, effectiveness and what further
measures should be taken by each social organizational level.
The majority of people living in both communities chose to live there because they did not want to or
could not afford to pay rent where they were previously living. Owning their own land and not having to
pay rent was so desirable that 44% of the households in Las Brisas informally purchased their land; 52%
simply occupied the land. . Even though a significant percentage of people bought their land in Las
Brisas, not a single household responded yes to having a land title. In Unidos 8 de Marzo, 70% obtained
their lot by occupying it and only 22% informally purchased land in the settlement. When asked what
more could be done by the community organizations to assist the community, 25% suggested that the
organization with the legislative process to obtain land titles.
On average, each household is made up of approximately five people. In Las Brisas, these five people
live in two to three bedroom homes than took on average three years to build. In Unidos 8 de Marzo,
the same average of five people live in a one room dwelling unit that took six years to build.
Landslides were selected as the as the greatest risk to the settlement by 77% of respondents from both
neighborhoods. Sixty nine percent stated that landslides are caused by ecological triggers such as steep
terrain, poor soil, and notably, rain. An even larger percentage, 54%, believed that human triggers like
trash and inadequate drainage exacerbated landslide hazards. A large percentage, 36%, had
implemented informally drainage management as a strategy for reducing household risk. Only 20%
wanted to implement future drainage management to further reduce risk. Half of the residents simply
wanted to build more retaining walls, however, the overwhelming majority of households (86%) lack the
funds to implement mitigation measures. The survey results suggest that the current insufficiency of
32You can also read