The Price of Power: Costs of Political Corruption in Indian Electricity - American ...
←
→
Page content transcription
If your browser does not render page correctly, please read the page content below
The Price of Power: Costs of Political Corruption in
                   Indian Electricity

                                          Meera Mahadevan∗

                                        December 28, 2020
                                      Click for Latest Version

                                                 Abstract

         Politicians may manipulate public provision of electricity to benefit their constituents.
         However, this may come at the cost of utility revenues and the ability to reliably supply
         electricity to the broader consumer base. Using a close-election regression discontinuity
         design, and an administrative dataset with the universe of geo-coded electricity bills
         from a large state in India, I show that billed electricity consumption is lower for
         constituencies of the winning party after an election. However, actual consumption,
         as measured by satellite nighttime lights, is higher for these same regions. I find new
         evidence to explain this discrepancy – politicians illicitly subsidize their constituents by
         systematically allowing the manipulation of billing data to reflect lower consumption.
         To measure changes in welfare, I develop a method to estimate demand elasticities
         in the presence of data manipulation, by deriving exogenous variation from policy-led
         price changes and predictive analytics. The net deadweight loss I estimate is large
         enough to power 3.7 million additional rural households over an electoral term.

       JEL: Q41, Q48, O13, O17, P48

       Keywords: Electricity, political economy, corruption, consumer welfare, India

   ∗
    University of California, Irvine, meera.m@uci.edu, meeramahadevan.com. I am grateful to Ryan Kellogg,
Dean Yang, Hoyt Bleakley and Catherine Hausman for insightful advice, and Achyuta Adhvaryu, Melissa Dell
and Catherine Wolfram for invaluable suggestions. Thanks to seminar participants at the NBER Political
Economy Fall Meeting (POL), University of Michigan, University of Southern California, Vancouver School of
Economics (UBC), Rutgers, University of Melbourne, University of California – Irvine, University of Western
Ontario, American University, National University of Singapore, University of Melbourne, and UCSD, and
participants at Development Day (U Chicago), PACDEV, AERE, NEUDC, and Occasional Workshop (UC
Santa Barbara) for useful comments. I thank the Michigan Institute for Teaching and Research in Economics
(MITRE) for research funding.

                                                      1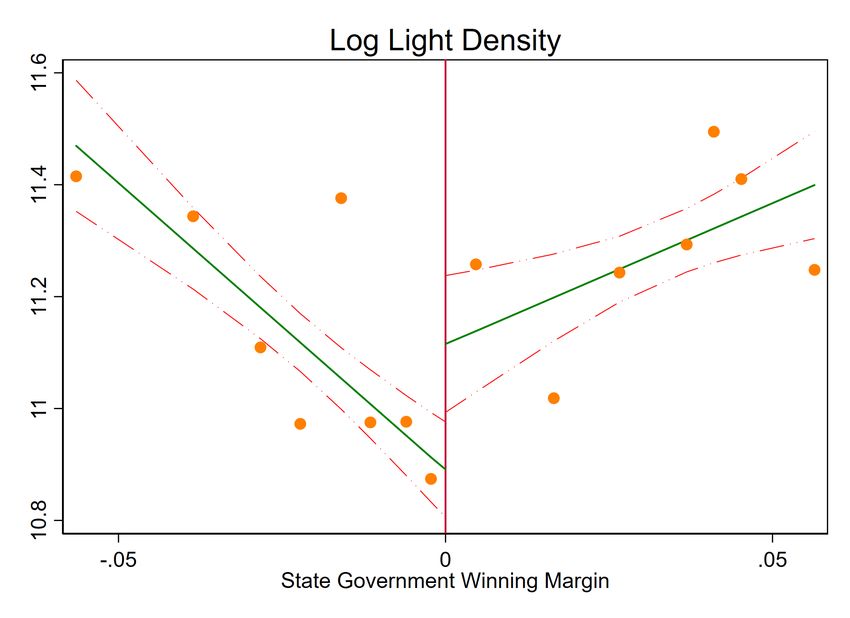
1     Introduction

Living in constituencies where the governing party is in control has several benefits. Politi-
cians from the winning party may formulate policies that are more beneficial to their con-
stituents (Asher and Novosad, 2017), and deliver on campaign promises to reward them for
votes (Cruz et al., 2020). Alternatively, politicians may redirect their efforts towards win-
ning new voters by targeting places they lost elections (Callen et al., 2020). Some of the
policies examined in the literature, however, are often directed towards subsets of the popu-
lation, and may have limited scope. What influence politicians wield over large, ubiquitous
institutions such as public utilities, which have a far wider reach, is relatively understudied.

    In developing countries, electricity and water utilities are often state owned, and therefore
open to political manipulation. Revenue losses from electricity theft in developing countries
amount to more than $33 billion annually, in addition to $8 billion in losses from corruption in
capital expenditure (Gulati and Rao, 2007). The electricity sector is particularly vulnerable
to corruption, given its natural monopoly structure consisting of several layers: generation,
transmission, distribution, and billing. There are several avenues for governments to affect
the electricity sector through energy policy, investment and procurement decisions, consumer
billing practices, and bureaucratic staffing. These decisions could have great personal and
political benefit to politicians, bureaucrats, and high electricity consumers like industrial
and urban users. However, there is little well-identified work showing the sources (Min and
Golden, 2014) and welfare consequences of corruption in large utilities such as electricity.

    It is challenging to empirically verify the anecdotal evidence and press reports on po-
litical corruption in a causal framework. Many reports show that politicians turn a blind

                                                1
eye to energy theft committed by voters or allies (The Telegraph, 2014; The Washington
Post, 2012), and tacitly support violence against officials who clamp down on energy theft
(The Times of India, 2017).1 A clear understanding of the mechanisms and magnitudes
of corruption is crucial to designing future policy in electricity provision. Yet, in order to
systematically investigate these allegations, and obtain a sense of the magnitudes involved,
we need to derive well-identified relationships from administrative data.

       I present causal evidence on how politicians may manipulate public electricity provision,
and what effects these interventions have on net welfare. First, I derive identification from
a close election Regression Discontinuity Design (RDD), a strategy commonly used in the
Indian context (George and Ponattu, 2020; Nellis et al., 2016; Prakash et al., 2019). I ex-
amine whether there are any discontinuities in reported and actual electricity consumption
between regions aligned with the governing party and those that are not. I obtain confi-
dential administrative billing records from the electricity utility of a large Indian state to
measure reported consumption, and combine it with satellite nighttime luminosity data as
an indicator of actual electricity consumption. Second, I use the billing data to investigate
how the distribution of reported consumption within electoral districts may be affected by
political alignment. Anomalies in the distribution of consumption data help to shed light
on the mechanisms through which politicians may affect electricity provision, particularly
if there are sharp differences across assemblies along political lines. Finally, I estimate the
magnitudes of the welfare consequences both for consumers and providers, after exploiting
exogenous changes in prices to estimate the elasticity of electricity demand.

       I present three key results. First, I causally infer that politicians from the governing party
at the state level favor their constituents by providing them with illicit electricity subsidies.
   1
   “Vote-hungry local politicians protect the thieves....At its worst, Indias power sector is the perfect
example of populism and patronage trumping sound economics, analysts say.” The Washington Post (2012)
Power Thieves Prosper in Indias Patronage-based Democracy.

                                                   2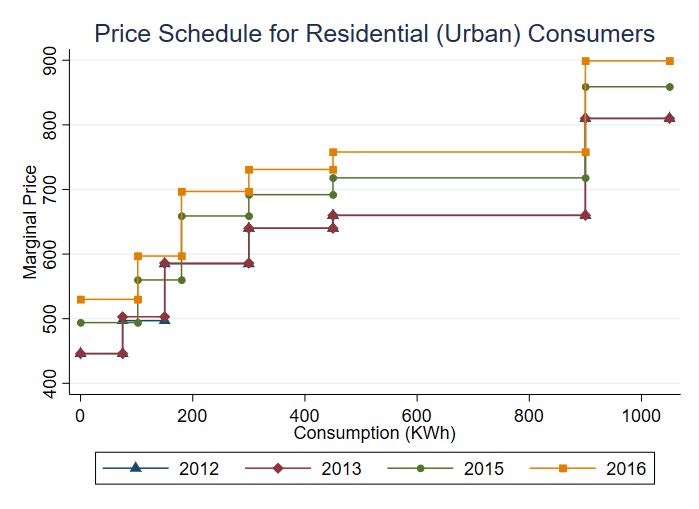
They accomplish this by under-reporting electricity consumed by their constituents. I find
that shortly after a state-level election, there is an increase in actual electricity consumption,
as measured by satellite nighttime lights data, for regions represented by the winning party.
Alone, this evidence may indicate selectively higher levels of electricity access for these
regions, possibly driven by politicians. These same regions, however, have discontinuously
lower levels of billed consumption, as reported by the electricity provider. Viewed alone, this
billing evidence would suggest that politicians instead redirect electricity to regions where
they lost elections. Together, however, the evidence from the nighttime lights and billing
data paint a different picture: Politicians appear to favor their constituencies by under-
reporting electricity consumption, even as their constituents consume higher actual amounts
of power. The magnitude of under-reporting is large, with favored account holders paying
bills that are almost 40% lower than they owe.

       Second, I highlight the mechanisms behind under-reported bills by showing evidence
that billing data is more likely to be manipulated in areas aligned with the ruling party.
These results are consistent with a hypothesis where local, incumbent politicians reward
their constituencies following elections by allowing the manipulation of actual consumption
to appear lower than what was consumed. I observe that a discontinuously higher number
of bills in the winning party’s constituencies are multiples of ten, reporting consumption
amounts such as 20, 30, 40 KWh and so on. Given that each electoral district consists of 3-4
billing centers answering to the elected representative from the winning party, these patterns
point towards a top-down approach to manipulating reported consumption in the billing
data. To further corroborate these data anomalies, I use Benford’s (1938) Law, which is
commonly used to detect data fraud in survey data collection.2 Using the entire consumption
distribution within each electoral district, I show that there is a greater divergence between
   2
    Benford’s (1938) Law predicts a frequency distribution of the first digit of naturally occurring, unma-
nipulated sets of numerical data, such as consumption data.

                                                    3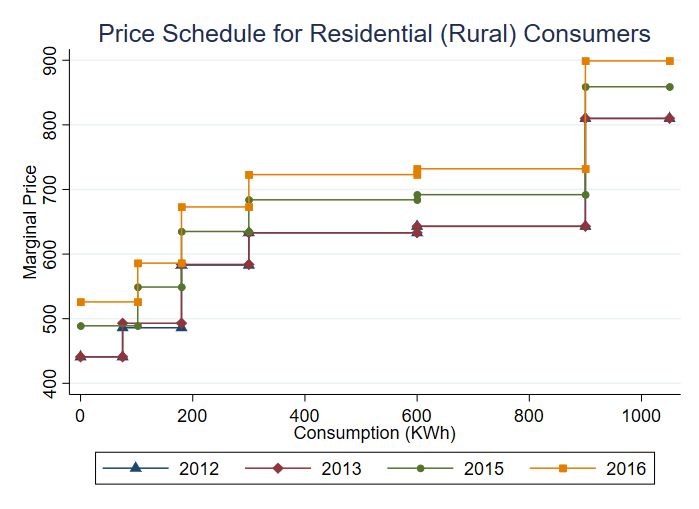
the observed distribution and the theoretically expected one under Benford’s (1938) Law in
constituencies represented by the winning party.

       Third, I identify the welfare implications of the corrupt billing practices described above.
I measure both the gains in consumer surplus from receiving subsidized electricity, and the
lost revenue to the provider due to under-reported bills. I estimate the size of the loss in
producer surplus from RD estimates of under-reported bills. The magnitude of change in
consumer surplus, however, requires computing the price elasticity of electricity demand.
The estimation of these elasticities for all consumers is challenging as there is clear evidence
of data manipulation in the bills. I, therefore, leverage policy-changes in tariffs and predic-
tive analytic techniques in order to estimate these elasticites. Using the estimated under-
reporting in consumption, and elasticities, I find that the loss to the electricity provider ($57
million) outweighs the gain in consumer surplus ($22 million). This net welfare loss of $34
million is sufficient to power 3.7 million additional rural households.3 Yet, this may not
capture the full extent of the welfare costs, as intermittent electricity supply hinders eco-
nomic development (Dinkelman, 2011; Greenstone and Jack, 2015; Lipscomb et al., 2013).4
Furthermore, underpricing electricity has significant welfare costs arising from negative en-
vironmental externalities related to overconsumption (Borenstein, 2012).

       I contribute to a large literature identifying patterns in political corruption and its welfare
consequences. In theory, democracy could play an important role in ensuring the efficient
allocation of government inputs in an effort to garner votes (Pande, 2003, 2020). Indeed,
recent evidence suggests that locally elected leaders may be important for local development
   3
     This figure represents an underestimate of the overall losses as I restrict the analysis to constituencies
within the RD bandwidth. While the RDD provides a causal claim of political patronage for constituencies
near the cutoff, it does not rule out the possibility of patronage in constituencies where the ruling party won
with a larger margin. My estimates are about 40% of the losses to the provider in 2016 as measured by the
Comptroller and Auditor General of India. (Business Standard, 2018) reports that the provider “suffered a
revenue loss of Rs 175.85 crore owing to delay in raising bills, theft of electricity and unauthorised use.”
   4
     In the context of India, poverty and development may be closely linked to access to water (Sekhri, 2014),
and electricity (Chaurey and Le, 2020).

                                                      4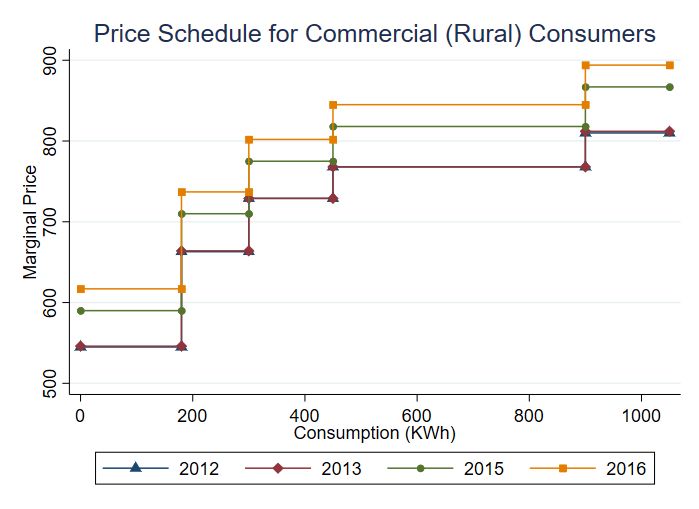
(Lowes and Montero, 2020), as democratic leaders invest in infrastructure like electricity
(Brown and Mobarak, 2009), driving productivity growth (Abeberese et al., 2020). In India,
the incentives for politicians to divert funds to local constituents stem from expected rewards
in subsequent election cycles (Fujiwara et al., 2020; George et al., 2018; Zimmermann, 2020).

   However, such diversions could also result in misallocation (Khwaja and Mian, 2005), and
preferential access (Asher and Novosad, 2017). Such politically-motivated market distortions
impose a burden on the provider and other consumer groups, simply exacerbating the already
poor quality of electricity supply in several regions. The welfare consequences of political
involvement in electricity is therefore, theoretically ambiguous. A contribution of my work
is to resolve this ambiguity by estimating the magnitude of the welfare costs and benefits. I
find that in the case of Indian electricity, the producer loss outweighs the gains in consumer
surplus by more than 2:1. Furthermore, such political favoritism and benefits to connected
constituents is not limited to India (Cruz, 2019) or the developing world (Bombardini and
Trebbi, 2011), and given its wide prevalence, it is important to understand the features that
allow it to take place, in order to design policies to counter it.

   A second contribution is to identify mechanisms behind how politicians may favor their
constituencies on a large scale, and I show how the mechanisms may themselves be corrupt,
over and above the intended goal of patronage. In this case, they manipulate billing records
to overcome their inability to affect official electricity tariffs. Prior research finds suggestive
evidence that politicians increase electricity supply before elections to sway voters (Min and
Golden, 2014), and pressure authorities to keep tariffs low (Chatterjee, 2018; Millennium
Post, 2017; The Economic Times, 2015). However, due to the unavailability of micro-level
electricity consumption data, past studies often rely on satellite lights or regional aggregates
as proxies for electricity consumption and leakages. Such macro-level aggregates, while in-
formative, conceal the underlying corrupt practices, and are limited in identifying the net

                                                5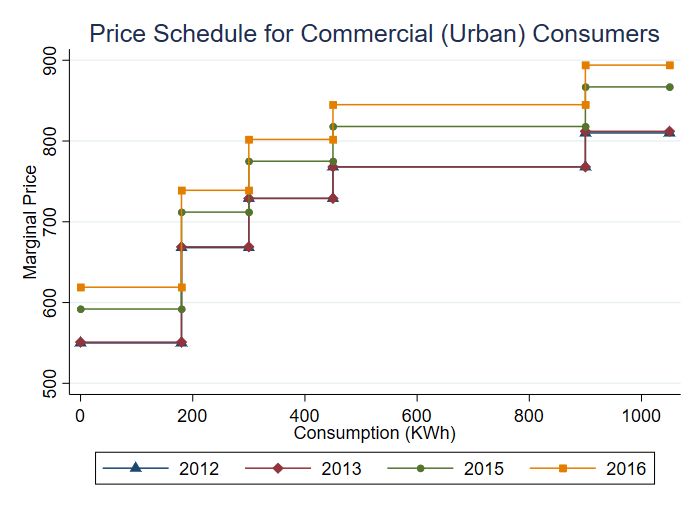
consequences of such actions. For instance, I show evidence of higher electricity consumption
in regions supporting the ruling party, based on satellite data. However, this is only half the
story. By uncovering widespread corruption in the individual-level bills, I document the per-
vasive practice across the bureaucratic hierarchy. Indeed, politicians may only have limited
bandwidth to interfere in the distribution process, but can indirectly influence lower levels
of the bureaucracy that may be involved in day-to-day transactions (Barnwal, 2019; Jeong
et al., 2020; Lowe et al., 2020; Neggers, 2018; Weaver, 2020). My findings stress the impor-
tance of having both measures of actual electricity consumption (satellite nighttime lights)
and reported electricity consumption (billing data), to reveal the method of corruption.
This type of corruption constitutes an indirect subsidy and may lead to over-consumption
of electricity.

    Finally, I contribute to the literature on consumer preferences by providing robust esti-
mates of the elasticities of demand for electricity. Such elasticities speak to the willingness-
to-pay for electricity, which reflect developmental gains from electrification (Lee et al., 2020),
and are important parameters in Environmental and Energy Economics. I take advantage of
the monthly or quarterly billing data to study corruption in a way that was not feasible in
previous work (Saha and Bhattacharya, 2018). This allows me to estimate price elasticities
after accounting for an individual’s consumption tier, and intra-year changes in tariffs. More
importantly, it allows me to estimate the entire consumption distribution at the regional
level to test for data manipulation – a feature absent from analyses that rely on aggregate
data. I therefore directly measure under-reporting and estimate the corresponding shortfall
in the producer revenues. This would not be possible with satellite data alone, and helps me
elicit the true welfare costs and benefits of political interference.

    The layout of the rest of this paper is: Section 2 provides institutional and political details
for the Indian context. Section 3 covers the empirical strategy and Section 4, describes the

                                                 6
data used. I show evidence of corruption in Section 5. Section 6 discusses the welfare
implications of political corruption, and Section 7 concludes.
2 The Electricity Sector in India
Electricity supply is a critical issue in India, where 55% of surveyed firms experienced elec-
trical outages and more than half the firms reported being required to provide a ‘gift’ in
exchange for an electricity connection (The World Bank, 2014). A third of the Indian pop-
ulation does not have access to electricity, and even those who do often experience long and
frequent blackouts (Pargal and Banerjee, 2014). Poor electricity supply is a major constraint
to manufacturing (Allcott et al., 2016), and both the price and quality remain important
election issues (Chatterjee, 2018).
In this paper, I focus on West Bengal, a large Indian state where the transmission and
distribution sectors are state-owned.5 55% of the consumers in the state (and most resi-
dential and commercial establishments) are supplied by the state-owned West Bengal State
Electricity Distribution Company Limited (WBSEDCL) covering a population of about 72
million individuals, through 17 millions accounts. In 2003, the central Electricity Act re-
forms created a state regulatory commission, responsible for setting electricity tariffs and
overseeing the functioning of the utility. This particular provision was made specifically
to separate the control of the electricity sector from increasing political influence. I ana-
lyze whether such mandates are sufficient to enforce political separation in reality, given
weak enforcement and auditing mechanisms. This institutional setup is ubiquitous across
states in India, and similar to other countries (e.g. Brazil, Bangladesh, Mexico, Sri Lanka
and Kenya), where electricity is a heavily subsidized commodity for households and small
5
With the exception of one privately owned firm which distributes only to the capital city of Kolkata.
7commercial establishments, with most state electricity utilities unable to recover their costs.
Whether political interference in electricity occurs depends on the incentives faced by
politicians, and whether such influence is feasible. There are a number of reasons why politi-
cians may want to control electricity supply. Election surveys in India find that electricity is
a key factor in election platforms (Chhibber et al., 2004). While politicians may try to win
over new voters by offering cheaper or better access to electricity, there is a well documented
pattern of patronage politics (Min, 2015) in India, with politicians exerting great effort in
consolidating existing votes.
Chatterjee (2018) presents evidence consistent with my model of politicians exerting
effort to provide cheaper electricity. Interviews with regulatory officials show pressure from
politicians in the ruling party to delay or avoid upward revisions in tariffs. Regulators
report resisting these attempts, demonstrating the difficulty faced by politicians in directly
influencing the price of electricity. This arguably leads politicians to explore other, more
indirect means of affecting electricity access and tariffs. Examples of such methods include
politicians implicitly allowing energy theft among their constituents (The Telegraph, 2014;
The Times of India, 2018; The Washington Post, 2012).6 Golden and Min (2011) demonstrate
how electricity bills are more likely to go unpaid in areas where criminals have political
affiliations. Another documented channel is through the middle-men involved in the bill
collection process. External inspectors are hired on a contract basis to conduct manual
meter readings, and Rains and Abraham (2018) highlights the often overlooked policy issue
of low revenue collection, due to poor incentives for these contractors. Finally, politicians
could selectively encourage lower enforcement of revenue collection in their constituencies,
allowing billing centers to make lower bill imputations and under-charge their constituents.
One factor helping governing parties is that while the electricity provider remains state-
6
“A [local politician] .... has said that discom officials who penalise farmers for power theft or overloading
should be tied to trees”, (The Times of India, 2018).
8owned, politicians themselves are not held accountable for its functioning. In several states,
electricity distributors have faced mounting losses for several years. This cycle of losses is
virtually systematized by the setup of a centrally managed bailout program, Ujwal Discom
Assurance Yojna (UDAY), launched in 2015 to help loss-making electricity utilities recover
financially. In practice, politicians do not pay any penalty for their state utility making such
losses, whereas checks-and-balances that would prevent them from interfering with utility
functioning are minimal. In such an environment, state politicians have an incentive to
‘informally’ provide their voters with access to cheaper and more electricity, following a long
tradition of patronage politics in India. The empirical portion of my paper shows evidence
of the mechanisms through which politicians provide informal or indirect subsidies.
2.1 Theoretical Predictions
I develop a theoretical framework in Appendix A to generate testable implications, derive
estimation equations, and motivate my welfare analysis. First, I derive a standard equation
for electricity demand given a simple quasilinear utility function, increasing in electricity
consumption with a constant elasticity for demand. Access to electricity-using infrastructure
also shifts out the demand for electricity, and these consumers vote for politicians that give
them higher utility. Second politicians exert effort and influence over utility providers to
maximize their probability of winning the next election. Exerting effort comes at a cost,
which prevents politicians from indiscriminately targeting all voters. These costs are lower
in areas where politicians are in power and aligned with the state government.
This simple set-up allows me to derive testable implications. First, politicians exert more
effort and influence in areas where local leaders are aligned with the state government. I
measure this influence by looking at evidence on systemic under-reporting of consumption.
Second, electricity subsidies and actual consumption (as measured by satellite data) are
9higher in such areas. Third, politicians target consumer bases with relatively more inelastic
demand as they stand the most to gain from informal subsidies. The model also allows me
to reproduce standard equations for estimating the price elasticity of demand for different
types of consumers, and to test whether politicians do indeed target more inelastic consumers.
Fourth, politicians target consumers with access to more electricity-using infrastructure, such
as consumers in urban areas. Last, as in standard models, the change in consumer surplus
is a simple function of the elasticity of demand. As I show in Appendix A, these predictions
motivate using, and are testable in a simple RD set up.
3 Close-election Regression Discontinuity Design
I apply a close-election Regression Discontinuity (RD) design to identify whether politicians
in West Bengal indirectly subsidize electricity. In India, parliamentary-style state elections
occur every five years. States are composed of legislative assembly constituencies (in short,
assemblies). The voting population elects constituency-level representatives or Members of
Legislative Assembly (MLAs), and the political party with the majority of MLAs forms the
government, with the party head becoming the Chief Minister of the State.
I use the winning margin percentage in assembly elections as the running variable for the
RD. I compare outcomes just above and below a zero winning margin RD cutoff to estimate
the Local Average Treatment Effect (LATE) of being in a constituency aligned with the
ruling government. The winning margin percentage is the fraction of votes by which an
MLA from the ruling party wins an assembly election. Asher and Novosad (2017); Bardhan
and Mookherjee (2010) and Nagavarapu and Sekhri (2014) use similar close election RDs
in the context of Indian elections. Constituency level elections in India are competitive,
unpredictable and several factors affect their outcomes. Therefore, despite widespread po-
10litical patronage, the probability of a constituency lying near the RD cutoff is randomly
determined in an election. Given the unpredictability of these local elections, particularly in
regions close to the RD cutoff, the close election RD is especially valid in this case (Eggers
et al., 2015).
Figure 1: A timeline of the winners of the state elections in West Bengal from 1977 to 2016
Notes: CPI(M) is the Communist Party of India (Marxist), and Trinamool is the All India Trinamool
Congress (AITC) party. These are the two rival parties in West Bengal.
An important issue in practice when using the RD is the selection of a smoothing param-
eter (Calonico et al., 2015; Imbens and Kalyanaraman, 2012; Imbens and Lemieux, 2008). I
run local regressions to estimate the discontinuity in outcomes at the cutoff. In particular,
I estimate local linear regressions conducted with a rectangular kernel and employing the
optimal data-driven procedure and bandwidth selection suggested by Calonico et al. (2015).
I present my results for multiple bandwidths to highlight the robust nature of my estimates,
varying them from below the optimal bandwidths to larger bandwidths. Varying the size of
the bandwidth and the polynomial order do not affect the results presented in my analysis.
In the 2011 state elections, the All India Trinamool Congress (AITC) defeated the in-
cumbent Communist Party of India – Marxist (CPI(M)) in a landslide election (Figure 1).
Prior to the election, the CPI(M) had been in power in West Bengal since the 1970s. I use
11state assembly election data from 2006 to 2017, covering elections in 2006, 2011 and 2016,
and discuss my data in greater detail in the next section.
Figure 2: McCrary Test – density of win- Figure 3: Balance on PCA of age, gender
ning margins at cutoff and caste
Notes: In the left panel, I test the smoothness of the density of the running variable (winning margin in
the state election (2011)) for discontinuities and find that it is smooth across the RD cutoff. In the right
panel, I test for discontinuities in demographic characteristics of assembly candidates on either side of the
cutoff and find that there are no significant discontinuities in the first principal component of age, sex and
caste of the candidates. I also show balance in terms of village characteristics across the cutoff in Appendix
F, Figures F3 and F4.
In order to test the validity of the RD design, I run two main checks to test for balance
of the running variable and other characteristics on either side of the cutoff. The McCrary
(2008) test finds no significant discontinuities in the density across the cutoff (Figure 2). Sim-
ilarly, when comparing candidate characteristics such as age, gender and caste, a measure of
the first principal component of the three does not yield any significant discontinuities across
the cutoff (Figure 2). I also check for balance across a range of village level characteristics
from the census and find no significant discontinuities (Figures F3 and F4 in Appendix F).
This help validate the assumptions underlying the RD specification.
124 Data Description and Variable Definitions
4.1 Administrative data on Electricity Consumption and Billing
I obtain confidential administrative data on the universe of electricity consumption and
billing records from the West Bengal State Electricity Distribution Corporation Limited
(WBSEDCL). This is a state-owned utility in West Bengal, serving a consumer base of ap-
proximately 17 million households, or 72 million consumers. These data include consumption
for residential and commercial users in both rural and urban areas between 2011 and 2016.
For most consumers, billing is done quarterly, with the exception of a few monthly users with
commercial accounts. WBSEDCL faces no competition from other electricity distributors
within its purview, and the only area not covered is the capital city of Kolkata.
The utility is controlled by an independent regulatory board, the West Bengal State
Electricity Regulatory Commission (WBERC). WBERC accepts proposals from WBSEDCL
requesting tariff increases to meet their rising marginal costs of providing electricity. After
reviewing these reports, WBERC sanctions a tariff revision, that can occur at any time
within a year. I compile a dataset of these tariff revisions that include changes across tiers
in the pricing structure, as well as different tariff schedules for different consumer categories.
In order to bill consumers, WBSEDCL sends meter readers to account holders’ premises
to record consumption. Electricity meters function akin to car odometers, where the number
on the meter represents the cumulative consumption of the account holder. To a large extent,
due to the absence of additional checks, reported consumption is up to the discretion of these
meter inspectors and the local Customer Care Centers (CCCs) they report to. Indeed, when
I plot the consumption distribution for residential and commercial consumers in Figure 4, I
observe a multi-modal distribution of consumption, with bunching at specific points. The
peaks in the data appear at round numbers such as 20, 30 or 40 KWh. While it is common
13for meter inspectors to not conduct readings every billing cycle and make imputations for
interim periods, the spikes observed are quite large. Using the RD, I test whether this occurs
systematically more in certain areas based on political alignment.
Figure 4: Consumption Distribution for Residential Consumers
Notes: The consumption distribution above is for residential consumers in rural areas. The range of
consumption extends from 1 KWh to more than 1000 KWh, but the bulk of distribution lies below 200 KWh
(restricted to under this level in this graph), and largely has the shape of a chi-squared distribution. The
two red lines represent the consumption levels at which the marginal price of electricity goes up. There are
several clear spikes in the distribution particularly at multiples of ten.
4.2 Measures of Data Manipulation
Based on the multi-modal consumption distribution, I define two measures to characterize
manipulation of the underlying data. The first is based on Benford’s (1938) Law, which
lays out an expected distribution for the first digit of a naturally occurring set of numbers.
I measure the normalized distance of the consumption distribution for each assembly-year
from the expected distribution. This metric, which is the same as the chi-squared goodness-
14of-fit statistic, represents the degree of manipulation in the underlying data. The second
measure I use is the fraction of consumers in an assembly, in any given year, who have a
reported consumption that is a multiple of ten. Because the consumption data would be, in
expectation, smoothly distributed, a multiple of ten should not occur discontinuously more
just above the RD cutoff.
Given that central regulations do not allow political entities any direct control over elec-
tricity tariffs, these measures would enable me to test whether they indirectly influence
electricity tariffs through the manipulation of the above measures. This may point towards
a patronage model of politicians in power wanting to reward their voters. If bills are manip-
ulated to reflect lower than actual consumption, that would amount to an indirect subsidy
to constituents.
In the consumption dataset, each account is linked to a consumer care center (CCC).
These centers are the local administrative offices for WBSEDCL, in charge of billing. I geo-
locate each of these 510 CCCs and situate them within their respective legislative assemblies,
resulting in 2-3 CCCs per assembly area. Through their CCCs, therefore, all account holders
under WBSEDCL are assigned to a particular legislative assembly. I hypothesize that if
politicians wanted to indirectly subsidize their voter base, they would do so by influencing
the local CCCs within their jurisdiction. One possible channel through which they may
operate is to selectively not enforce local contractors in charge of meter readings to record
observations regularly. Rains and Abraham (2018) identify this as a vulnerability in bill
collections due to low incentives of contractors collecting consumption meter readings. Not
having regular meter readings allows local billing centers to make their own imputations of
consumption, and could be made lower to appease the local MLA.
Table F1 in Appendix F, presents summary statistics for the main variables of interest
by whether or not the constituency was aligned with the majority party, and also by years
152012 and 2016. In the RD analysis using billing data, I make use of only the 2011 election.
All results from this analysis using billing and consumption data reveal political behavior
post-elections.
4.3 Satellite Nighttime Luminosity Data
I use nighttime light density as a measure for actual electricity consumption in grid-connected
areas, and possible new electrification. This is a non-manipulable measure of consumption,
and serves as a barometer for the reported consumption measures from the electricity bills.
Satellites from the United States’ Defense Meteorological Satellite Program (DMSP)
collect images of the earth twice a day, and they make available annual composite images
by averaging these daily data. They use 30 arc second grids, spanning -180 to 180 degrees
longitude and -65 to 75 degrees latitude and present the data using a 63-point luminosity
scale. This data has also been used as a measure economic development (Chen and Nordhaus,
2011; Donaldson and Storeygard, 2016; Henderson et al., 2012). Figure F1 in Appendix F
shows a map of West Bengal with both (state-level) assembly boundaries and (national level)
parliamentary constituencies, along with the luminosity data.
These luminosity measures are effectively used as a proxy for electrification, often cor-
roborated by actual consumption measures. Min and Gaba (2014); Min et al. (2013) use this
data to examine electrification in Vietnam, Senegal and Mali, and validate nighttime lights
as a good proxy for electrification, particularly in rural areas. Several papers have used this
data in the Indian context specifically to measure electrification rates (Burlig and Preonas,
2017; Mann et al., 2016; Min and Golden, 2014). Mann et al. (2016) apply machine learning
techniques to predict daytime electrification, and show nighttime luminosity to be a good
indicator of electricity consumption. Min and Golden (2014) and Baskaran et al. (2015)
show evidence of electoral cycles in electricity supply using the DMSP data, and Burlig and
16Preonas (2017) are able to assess the development effects of electrification using this data
as a proxy for village electrification. Given the evidence of electricity consumption data
manipulation, this data also provides an unbiased measure of electrification.
I measure the average density of lights within each legislative assembly. In the absence
of manipulation of the utility’s consumption data, it should mirror patterns observed with
the lights data.
5 Empirical Evidence of Political Patronage
I leverage the close-election RD to test for potential manipulation of electricity outcomes by
political agents. I test whether the party in power illicitly provided differentially cheaper
electricity access to its voters by comparing electricity provision across the RD cutoff, using
both administrative (reported consumption) and satellite data (actual consumption). I also
explore the mechanisms behind potential corruption by examining patterns in the within-
region distributions of electricity consumption.
5.1 Average Nighttime Lights Density
I run the following specification at assembly-level a, where the vote-margin is the net differ-
ence in the fraction of votes received by the winning party over the party with the second-
highest votes:
Log(Lights)a = β 1(vote margin > 0)a + f (vote margin)a + a f or a ∈ BW (1)
Here, f (vote margin)a controls for the vote margin running variable, and BW is the op-
timal bandwidth around the cutoff following Calonico et al. (2015). I test for discontinuities
17Figure 5: RD analysis of average nighttime lights density on either side of the RD cutoff
Notes: Comparing legislative assemblies where the party in government narrowly won to those where it
narrowly lost (2012-15), I find a discontinuously higher density of nighttime lights in winning areas. I use
the Calonico et al. (2015) method to create optimal bins for observations on either side of the cutoff and a
linear specification to fit the data.
in the average light-density around the RD cutoff, allowing for the slope of the vote margin
to vary at the cutoff. β measures the RD coefficient. Given that the RD estimates capture
the Local Average Treatment Effect (LATE), I make causal claims for the sub-sample of
assemblies close to the winning margin cutoff. This includes assemblies where the party
in power narrowly won or lost, in which, as the theory suggests in Appendix A, parties
concentrate their efforts as the expected payoff may be higher.
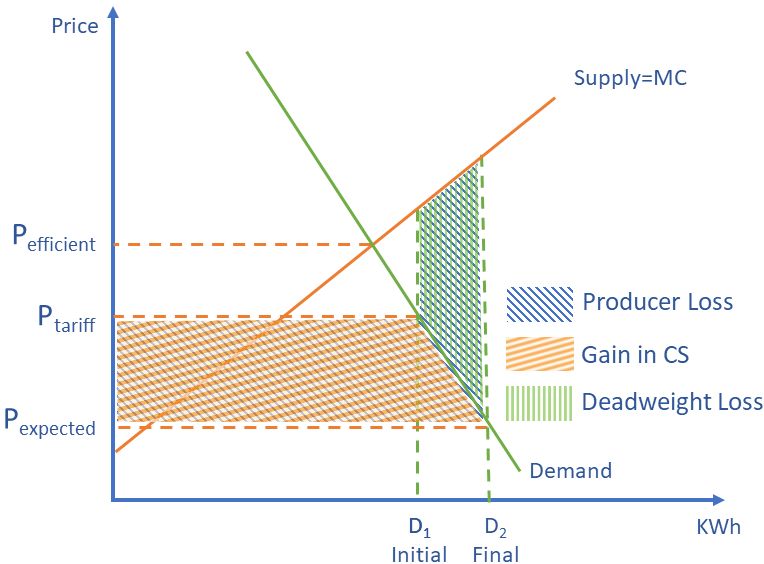
Figure 5 demonstrates that there is discontinuously higher light density for assemblies
where the chief minister’s party narrowly won. Since there was balance across the RD
cutoff on characteristics such as age, gender and caste of the candidates (Figure 3), this
discontinuity in electrification suggests differential treatment by the politicians in power.
In order to further investigate this pattern, I use nighttime light density data from 2004-
2016, spanning the state elections in 2006, 2011 and 2016. The pre-2011 years serve to check
whether there was a trend towards discontinuously higher electricity consumption. I run
18the following regression, where βt is the coefficient across years, and µd are administrative
district fixed effects.7
βt (1(vote margin > 0)a ×γt )+γt +µd +f (vote margin)a +adt f or a ∈ BW
X
Log(Lights)adt =
t
(2)
In Equation 2, I study how being above the 2011 winning margin cutoff affects light-density
both before the elections (2004-2010) and after (2012-2016). We would expect that the pre-
election years show no detectable discontinuity, as a falsification test. The coefficients after
2011 map out the post-election dynamics, as a consequence of the constituency being aligned
with the state government. This specification is a difference-in-discontinuities set up, which
includes year and district fixed effects, and restricts the sample to a bandwidth around the
cutoff.
Figure 6: Satellite Night Lights: Difference-in-discontinuities Analysis from 2004 to 2016
Notes: Restricting the sample to the optimal bandwidth described in Calonico et al. (2015), I plot the
RD coefficients, and confidence intervals of errors clustered at the assembly level. The dependent variable is
Log(light density). I plot coefficients over time and find a trend break after the 2011 election, with selectively
greater electrification in areas where the governing party narrowly won. For a figure showing the levels of
the RD coefficients over time, please refer to Figure F2 in Appendix F
7
In 2016, West Bengal had 294 assemblies spread across 23 administrative districts.
19On graphing these coefficients in Figure 6, I observe that there was no discontinuity or
differential electrification in years before the 2011 elections. Furthermore, after the 2011
elections, there is a clear trend break, and I observe an increase in differential electrification
in assemblies where the chief minister’s party narrowly won. Given the stark increases in the
RD coefficient for nighttime lights soon after 2011, it is more likely that the effects I observe
do refer to electrification outcomes, as opposed to development schemes which typically take
longer to have observable effects.
Taken in isolation, this evidence may be interpreted to imply that there is differential
access to electricity that is provided to the constituents of the winning party. However, this
alone does not paint the full picture, as I show using the administrative billing data below.
5.2 Data Manipulation in Electricity Billing Records
Administrative micro-level consumer data directly obtained from the state utility provides
a useful companion to the satellite data described above. While the satellite data indicates
actual electricity consumption, billing data documents consumption as reported by the util-
ity. Similarities or divergences between these two datasets could be useful in understanding
potential corruption by politicians. I show evidence in Figure 7 using consumption data on
all consumer classes, including households, commercial users, public works, agriculture and
irrigation.8 I run the following regression specification at the assembly level, where the left
hand side includes electricity consumption:
ya = β 1(vote margin > 0)a + f (vote margin)a + a f or a ∈ BW (3)
8
The only consumer class not present is high-tension industrial consumers of electricity (usually large
factories). Therefore, aside from factories, which do not commonly operate at night, the nighttime lights
data should closely correspond to the consumers captured in the billing dataset.
20Table 1: Discontinuity in Reported Consumption
Unit consumption in KWH
Residential (Rural)
RD Estimate -124.1*** -126.0*** -143.2*** -157.9*** -139.5***
(24.33) (20.58) (21.08) (22.57) (23.70)
Observations 7,780 10,457 10,352 10,329 10,213
Bwidth 6,000 6,000 6,000 6,000 6,000
Year 2012 2013 2014 2015 2016
Residential (Urban)
RD Estimate -311.4*** -366.2*** -382.9*** -401.8*** -433.1***
(95.28) (82.32) (77.72) (75.35) (71.69)
Observations 9,630 11,417 11,350 11,260 11,075
Bwidth 6,000 6,000 6,000 6,000 6,000
Year 2012 2013 2014 2015 2016
Commercial (Rural)
RD Estimate 124.8 51.21 81.79 -16.16 107.4
(99.62) (78.51) (70.12) (80.87) (88.63)
Observations 3,023 4,120 4,044 4,018 4,010
Bwidth 6,000 6,000 6,000 6,000 6,000
Year 2012 2013 2014 2015 2016
Commercial (Urban)
RD Estimate -473.4* -579.9** -555.3** -542.6** -582.3**
(273.20) (250.70) (234.50) (265.40) (291.80)
Observations 10,611 12,505 12,227 12,269 12,035
Bwidth 6,000 6,000 6,000 6,000 6,000
Year 2012 2013 2014 2015 2016
Notes: Using the optimal bandwidth procedure described in Calonico et al. (2015),
I report the RD coefficients across years for reported electricity consumption for each
consumer class, controlling for the size of the electorate in each assembly. These results
are robust across multiple regression specifications. The results in this table use a
bandwidth of 6,000 in terms of the the running variable, winning margin. This table
shows evidence of discontinuously lower reported consumption for residential (urban and
rural) consumers, as well as commercial (urban) users. Standard errors in parentheses
clustered at the feeder level *** pFigure 7: Lower reported consumption in regions where the majority party won (2012-15)
Notes: Using the optimal bandwidth and binning procedure described in Calonico et al. (2015), I plot
reported consumption of electricity on either side of the cutoff. The running variable for the RD is the
winning margin percentage. The left hand side panel uses 11,592 data points, for which I use a 2% sample
of the billing data for all consumer categories and present binned estimates. In the right panel, I plot the
RD coefficients between 2012 and 2016, and find results robust to other bandwidths – both lower and higher
than the optimal bandwidth (between 6000 and 12000 votes). Standard errors clustered at the feeder level.
The first variable I study is simply the reported level of consumption in assemblies with
closely fought elections. Given that there is no observable discontinuity in baseline character-
istics around the cutoff, there is no a priori reason for there to be discontinuities in reported
consumption. In Figure 7, using the consumption data reported by the electricity utility, I
observe a discontinuously lower level of average electricity consumption in assemblies that
narrowly swung in the ruling government’s favor. However, in the previous section, I observe
a discontinuously higher level of nightlights density. One possibility is that the billed con-
sumption understates actual consumption. The magnitudes of these discrepancies are large,
amounting to average discounts to constituents of about 40% of their regular bills.9
A potential concern with using satellite data is that it may primarily capture an increase
in the extensive margin of electricity consumption, which billing records may not capture.
9
These magnitudes are based on a rough calculation using the estimated effects of being in a constituency
of the ruling party and the average electricity consumption at the cutoff in assemblies aligned with the
opposition.
22Indeed, the Rajiv Gandhi Grameen Vidyutikaran Yojana (RGGVY) in India, launched in
2005, sanctioned the electrification of unelectrified villages all over the country. Looking
at the assemblies just below and above the RD cutoff, the number of villages receiving
electricity connections through the RGGVY scheme is very similar: 5944 compared to 6024
in constituencies of the ruling party.10 Given that a marginally greater number of villages in
constituencies under the ruling party received new electricity connections through RGGVY,
it is all the more striking that their reported billed consumption is discontinuously lower.
Another concern with satellite nighttime lights data is that it may capture mostly rural
electrification. If I focus on only rural consumers in the billing data, I still find evidence of
political manipulation for residential consumers (Table 1).
Next, I examine patterns in the data that may shed light on the observed underreporting
of electricity consumption. In Figure 8, I find that the measure of distance (of the consump-
tion distribution) from the expected chi-squared distribution (based on Benford’s (1938)
Law) is statistically significantly higher in winning swing assemblies. The degree of data
manipulation grows over time, and then the discontinuity falls by 2016, on the eve of the
next election. From the available data, it is not completely clear if this occurs because there
is a higher degree of data manipulation in losing assemblies as well, or that politicians direct
their efforts elsewhere in the run-up to the next election. These results are echoed when I
examine whether there are discontinuities in the probability that an account holder’s con-
sumption is a multiple of ten. I find that the likelihood of billed consumption being reported
as multiples of ten is systematically higher in constituencies represented by the governing
party. Ex-ante, there would be no reason for these areas to see an anomalously high inci-
dence of KWh that are neatly rounded off in this way. These results are presented for the
optimal bandwidth (Calonico et al., 2015) and for bandwidths both smaller and larger.
10
Author calculations from statistics by the Ministry of Power, India.
23Figure 8: RD Coefficients for Manipulation Outcomes Across Bandwidths
Notes: Using the Calonico et al. (2015) optimal bandwidths, I plot coefficients across years for measures
of data manipulation, and confidence intervals of robust standard errors clustered at the electrical-feeder
level. Specifically I study the distance of the observed distribution from the expected distribution as per
Benford’s (1938) Law and the fraction of consumers whose consumption was a multiple of ten. I find these
result robust across bandwidths. ‘BW’ indicates the bandwidth size. The three bandwidths I use in these
graphs are slightly lower and higher than the optimal bandwidth (in units of the number of votes). These
regressions control for the total size of the electorate within each assembly.
5.3 Channels of Political Influence
The discrepancy between a higher actual electricity consumption and lower reported con-
sumption, may be consistent with the patterns of data manipulation also discontinuously
observed in these constituencies, where reported consumption appears to be excessively
rounded off to multiples of ten. One plausible explanation that I provide some anecdotal
traction for is that MLAs in the governing party’s constituencies may institute a widespread
informal policy to under-report the electricity consumption of their voters in order to subsi-
dize them, in the absence of any direct control over electricity prices.
There are a few possible channels through which politicians reward their voters with
cheaper electricity. Electricity meter readings provide one of the few manipulable margins
on which to affect electricity price, as the price and total bill estimates are computerized
and harder to manipulate without detection. Among several vulnerabilities, Gulati and
24Rao (2007) identify the billing stage as susceptible to political interference, highlighting
artificially lowered bills as a specific example. An audit study carried out by an electricity
utility in Uttar Pradesh, another Indian state, identified significant political interference in
electricity distribution and billing at local levels (Goenka, 2013). The inspectors who conduct
meter readings are often external contractors, and report to a local Customer Care Center
(CCC), which enters their reported consumption figures into the digital database. This
appears a likely point where under-reporting occurs. Rains and Abraham (2018) highlight
the role of these inspectors in bill collection and how redesigning incentives for them could
lead to massive gains in utility revenue. My findings are consistent with a selective lack of
enforcement in inspector readings, in order to allow local billing centers under the purview
of the Members of Legislative Assembly (MLAs) to report billed consumption that is lower
than actual levels.
Over the course of my field work, I observed several instances of meter readers not
conducting their inspection rounds for multiple billing periods. While, the billing center
handbooks recommend a formula to impute consumption from previous readings, there is
a lot of discretion involved in the data entered. It is also widely acknowledged that MLAs
hold a great deal of sway over local government authorities, and therefore could potentially
influence local billing centers. These billing centers are dispersed all over the state, but it
is in narrowly winning assemblies that we observe statistically significantly lower levels of
reported consumption.
Another possibility is that politicians selectively discourage utility action against energy
theft, tacitly allowing it. Even though I am unable to test this directly, there is a large
amount of anecdotal evidence supporting this channel (The Telegraph, 2014; The Times
of India, 2017; The Washington Post, 2012).11 However, while this is consistent with the
11
“ “Many people known to support the ruling party are allegedly involved in hooking and tapping”, a
source said.... The chief minister had accused WBSEDCL of “callousness” and questioned the efficacy of
25empirical results showing lower reported consumption and higher actual consumption, it
cannot alone explain why we observe discontinuously higher levels of data manipulation in
constituencies controlled by the ruling party.
A centrally mandated independent regulatory authority ensures that it virtually impos-
sible to directly reduce electricity prices. They set tariffs after approving requests by the
electricity provider, in response to changing fuel prices (marginal costs of producing elec-
tricity), as well as changes to the composition of the generation stations supplying them.
Chatterjee (2017) discusses evidence from interviews with regulators where they report pres-
sure by politicians in government to delay these tariff revisions, but there is little evidence
that politicians were able to affect the setting of tariffs themselves.
An alternative explanation for the observed discontinuities is that the reported consump-
tion in swing assemblies where the majority party narrowly lost was over-stated. I cannot
eliminate this possibility, given that the RD analysis provides me with relative changes. Yet,
it is unlikely that politicians would expend effort in overcharging consumers in constituencies
where they lost elections rather than favoring their own constituents. Over-stating bills is
easier to detect and may lead to widespread discontent and protests, and hurt the chances
of the ruling party from winning further elections in swing regions.
Another possibility is that rather than manipulating data, electricity distributors provide
greater access to electricity for consumers in assemblies where the governing party loses, in
a bid to win over new voters. However, this is at odds with the evidence from the night
lights data, which shows a discontinuously lower level of actual electrification in assemblies
where the governing party narrowly lost (Figure 6 & Figure 7 ). Lastly, favoring voters in
assemblies, where the ruling party lost, is unlikely to win new votes if the beneficiaries credit
the MLAs from the losing party (that is in office in areas with better electricity access).
such [anti-theft] drives.” The Telegraph, July 31st 2014: Power Theft Test for Mamata - State Utility to
Seek CM’s nod to Relaunch Crackdown.
265.4 Falsification Tests and Robustness Checks
I test for robustness across multiple RD bandwidths. I present these figures in Section 5.2
for the RD results on reported consumption, distance from the chi-squared distribution, and
bunching at multiples of ten, all of which are consistent across different bandwidths.
Figure 9: Studying discontinuities in reported consumption using the winning and losing
constituencies from the 2006 election
Notes: Using the optimal bandwidth described in Calonico et al. (2015), I plot RD coefficients for the
reported consumption. The winning margin here is defined on the basis of legislative assemblies from the
2006 election, where the CPI(M) party won, and was in power till 2011. This provides a falsification test
using the 2011 election results. The results shown include multiple bandwidths (BW 6000 votes to 12000
votes).
Next I conduct tests where I use the winning margin and the set of winning and losing
assemblies from a previous election (the 2006 election where the CPI(M) party formed the
government). If the most likely narrative is that the current political party in power (that
ascended after the 2011 elections) induces discontinuities in the consumption and billing data,
then I should not observe such discontinuities for assemblies near the 2006 election cutoff in
the years after 2011. Yet, we may also expect to see some persistence in manipulation by
the previous party that was in power till 2011.
In Figure 9, I show the RD results analogous to those in Section 5.2. Using the 2006
27election winning margin, I do not observe any robust evidence of a discontinuity in years
after 2012. Interestingly, the figure shows a slight discontinuity in 2012 perhaps due to some
persistence in corruption and manipulation that may have been occurring between 2006-11
under the previous government. This fades out over time, such that after 2012, there is
no statistically detectable discontinuity. The periods post 2012, therefore, are similar to a
falsification test. I show falsification tests using additional outcomes in Appendix Figure B2.
The patterns observed mirror the graph above.
6 Welfare Consequences of Political Patronage
I now quantify the magnitude of welfare consequences that such widespread corruption in
the electricity sector imposes on society. I measure both the costs to the electricity sector,
and the benefits to subsidized consumers.
I rely on a simple demand and supply framework to provide an intuitive account of the
welfare implications of political patronage. I characterize the under-reporting in billing data
as providing an informal subsidy to constituents of the ruling party. This under-reporting
of bills can be approximated by an average price subsidy provided to all consumers in con-
stituencies aligned with the ruling party. Therefore, for tractability, I treat the subsidies as a
price subsidy. In Figure 10, I describe this setup with a downward sloping consumer-demand
curve and an upward sloping provider-supply curve, based on the assumption that as supply
increases the electricity provider must purchase electricity from progressively more expensive
sources. Under an efficient market, the price charged for electricity would be Pef f icient . How-
ever, in reality, most electricity providers cross-subsidize residential and smaller commercial
users by charging higher prices for industrial users. It follows that the price paid per unit of
electricity by consumers in my data is lower than Pef f icient , and I refer to this price as Ptarif f .
28You can also read