Estimating the mid-band spectrum needs in the 2025-2030 time frame - A report by Coleago Consulting Ltd
←
→
Page content transcription
If your browser does not render page correctly, please read the page content below
Estimating the mid-band
spectrum needs in the
2025-2030 time frame
Global Outlook

A report by Coleago Consulting Ltd
July 2021

Copyright © 2021 GSM Association
About Coleago Consulting Ltd

The GSMA represents the interests of mobile operators       Founded in 2001, Coleago is a specialist telecoms
worldwide, uniting more than 750 operators and nearly       management consulting firm. Our expertise has been
400 companies in the broader mobile ecosystem,              developed exclusively within the telecoms sector and
including handset and device makers, software companies,    delivers a rare combination of telecoms-related commercial,
equipment providers and internet companies, as well as      technical, and regulatory skills and experience. Since 2001
organisations in adjacent industry sectors. The GSMA also   we have worked on over 110 spectrum related projects in
produces the industry-leading MWC events held annually      developed and emerging markets. Since 2017 our spectrum
in Barcelona, Los Angeles and Shanghai, as well as the      projects included the transition to 5G, including valuing
Mobile 360 Series of regional conferences.                  spectrum most relevant for 5G such as 600 MHz, 700 MHz,
                                                            3.5 GHz, and mmWave. We advise regulators on spectrum
For more information, please visit the GSMA corporate       policy, spectrum roadmap, spectrum pricing, spectrum
website at www.gsma.com                                     auctions and capacity building on the topic best practice
                                                            in spectrum auctions. For mobile operators Coleago
Follow the GSMA on Twitter: @GSMA                           delivers regulatory advocacy and responses to consultation,
                                                            spectrum valuation, bid strategy development and live
                                                            auction support. Coleago also authored complete bid books
                                                            for spectrum licence awards by means of a beauty contest.

                                                            For further information, please visit www.coleago.com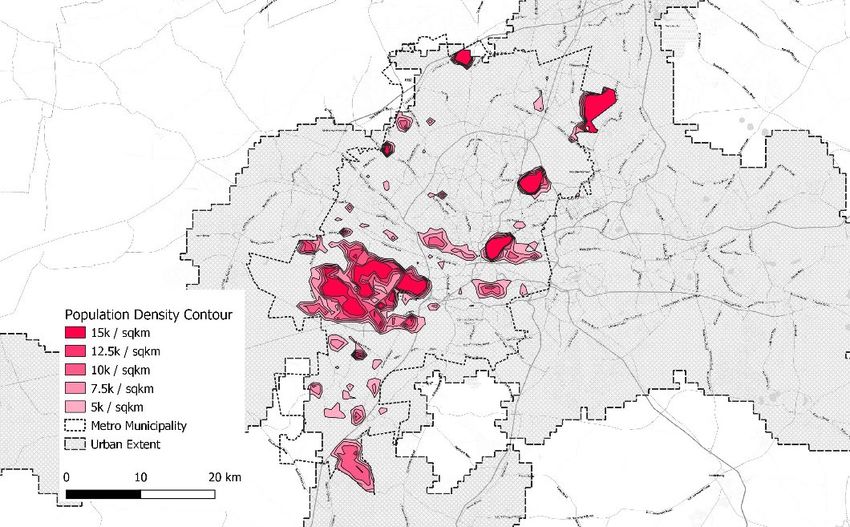
Content

1           Executive summary .............................................................................. 1

2           The requirements for 5G drive the need for IMT spectrum .................. 6
2.1         Spectrum to deliver the 5G vision ........................................................ 6
2.2         Low, mid, and high frequency bands.................................................... 7

3           Spectrum for city-wide speed coverage ............................................... 8
3.1         Estimating spectrum requirements in the context of 5G ....................... 8
3.2         ITU-R IMT-2020 user experienced data rate requirement .................... 9
3.3         Modelling upper mid-band spectrum needs ....................................... 11
3.3.1       Overview of the spectrum demand model .......................................... 11
3.3.2       The area traffic density demand side – key assumptions................... 11
3.3.3       The area traffic capacity supply side – key assumptions ................... 17
3.4         Spectrum demand model results........................................................ 21
3.4.1       Introduction ........................................................................................ 21
3.4.2       Example: Paris area ........................................................................... 22
3.4.3       Spectrum demand in sample cities .................................................... 23
3.5         Interpreting the findings...................................................................... 25
3.6         Spectrum demand in other high-density cities ................................... 27

4           Trade-off between additional spectrum and network densification ..... 28
4.1         Small cell network densification ......................................................... 28
4.2         Site numbers increase with spectrum limitations ............................... 28
4.3         Power increases with spectrum limitations ......................................... 31
4.4         Cost increases with spectrum limitations ........................................... 32

5           Mid-band spectrum for 5G fibre-like speed FWA ............................... 34
5.1         Wireless is the fastest growing fixed broadband access technology .. 34
5.2         Spectrum demand drivers for 5G FWA vs. 5G mobile ....................... 35
5.3         Leveraging existing mobile infrastructure for rural FWA..................... 36
5.4         Improving the FWA economics with additional mid-band spectrum ... 37
5.5         5G FWA in countries with an extensive FTTH coverage .................... 39
5.6         5G FWA in countries with limited FTTH coverage in cities ................. 41
5.6.1       Introduction ........................................................................................ 41
5.6.2       5G FWA to provide rural broadband connectivity ............................... 42
5.6.3       Case Study: The value of additional spectrum for rural FWA in India 44

6           Mid-band spectrum to deliver 5G along motorways outside cities ..... 47

7           The need for a wide band assignment ............................................... 49
7.1         Introduction ........................................................................................ 49
7.2         Economic benefit of 100 MHz channel bandwidth.............................. 49
7.3         Per operator contiguous assignments of more than 100 MHz ........... 50
7.4         Spectral efficiency benefit of a 100 MHz wide band allocation ........... 51
7.5         Contiguous spectrum vs. carrier aggregation ..................................... 52
7.6         Impact of awarding less than 100 MHz per operator .......................... 52
7.7         The importance of service neutral licenses ........................................ 53

Appendices ...................................................................................................... 54
Appendix A:            Frequently asked questions .................................................... 54

Appendix B:       Additional spectrum needs ...................................................... 55
Appendix C:       Population density analysis..................................................... 56
Appendix D:       ITU-R definition of the user experienced data rate ................. 65
Appendix E:       ITU-R definition of area traffic capacity ................................... 66
Appendix F:       Selected use cases requiring citywide speed coverage .......... 66
Appendix G:       Comparing the cost of FTHH and 5G FWA in Europe ............ 68
Appendix H:       Small Cell Densification Calculations ...................................... 71

Exhibits
Exhibit 1:    Total mid-band spectrum needs 2025-2030 time frame ................. 1
Exhibit 2:    Benefits of additional mid-bands for 5G.......................................... 4
Exhibit 3:    IMT 2020 requirements .................................................................. 6
Exhibit 4:    Mix of spectrum for 5G ................................................................... 8
Exhibit 5:    New use cases and applications drive 5G spectrum needs ........... 9
Exhibit 6:    Area traffic demand and capacity supply model ........................... 11
Exhibit 7:    Video quality options and impact on bandwidth demand .............. 14
Exhibit 8:    Video data volume and data rate depending on video quality ...... 15
Exhibit 9:    Offload to 5G high bands & indoor upper mid-band small cells .... 16
Exhibit 10:   Key 5G modelling assumptions for future urban environment ...... 20
Exhibit 11:   Baseline spectrum for selected cities ........................................... 21
Exhibit 12:   Area traffic demand in the Paris area ........................................... 22
Exhibit 13:   Downlink spectrum need in Paris urban area ............................... 23
Exhibit 14:   Total (incl. base line) mid-band spectrum needs (MHz) ............... 24
Exhibit 15:   Total mid-band spectrum needs 2025-2030 time frame ............... 25
Exhibit 16:   Total spectrum requirements for RATG 1 and RATG 2 in 2020 ... 26
Exhibit 17:   Likely range for the total (incl. base line) mid-band spectrum needs
              (MHz) in 2025-2030 ...................................................................... 26
Exhibit 18:   Population in cities with a density greater than 8,000 per km2 ..... 27
Exhibit 19:   Additional outdoor small cells vs. unmet DL spectrum need ........ 29
Exhibit 20:   Small cell inter-site distance vs. unmet DL spectrum need .......... 29
Exhibit 21:   Additional outdoor small cells and intersite distance .................... 30
Exhibit 22:   Power consumption dependant on mid band spectrum ................ 32
Exhibit 23:   Radio network cost depending on mid band spectrum ................. 33
Exhibit 24:   Growth of fixed broadband subscribers by technology in 2019 .... 34
Exhibit 25:   FWA connections ......................................................................... 35
Exhibit 26:   Demand drivers for upper mid-band spectrum ............................. 35
Exhibit 27:   5G FWA potential in village from existing cell towers, Germany .. 36
Exhibit 28:   Potential 5G FWA in village from existing cell tower, Benin ......... 37
Exhibit 29:   FWA homes per site depending on amount of spectrum detaile .. 38
Exhibit 30:   FWA homes per site depending on amount of spectrum .............. 39
Exhibit 31:   European broadband policy .......................................................... 40
Exhibit 32:   Cell site vs. spectrum trade off in rural population clusters........... 44
Exhibit 33:   Indian population by settlement type (%) ...................................... 45
Exhibit 34:   5G FWA in “small size” rural areas in India .................................. 46
Exhibit 35:   3GPP FR-1 bands with 100 MHz wide channel ............................ 49
Exhibit 36:   Cost per bit depending on channel bandwidth .............................. 50
Exhibit 37:   Cost per bit with per operator allocation of over 100 MHz ............ 51
Exhibit 38:   5G NR utilisation of channel bandwidth ........................................ 51
Exhibit 39:   Comparison 100 MHz contiguous vs two 50 MHz blocks ............. 52
Exhibit 40:   Additional spectrum needs (MHz) for DL and UL ......................... 55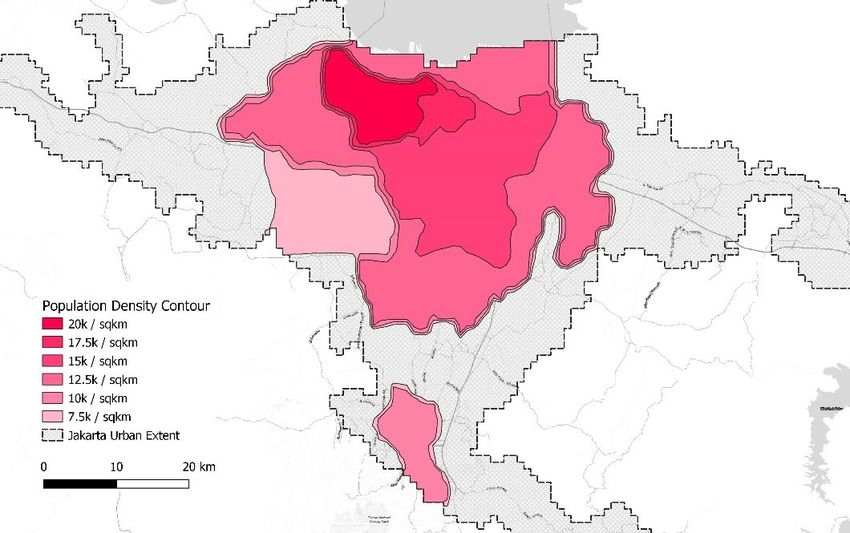
Exhibit 41: Moscow, Russia: Population density and central region(s) .......... 57
Exhibit 42: Population and areas of sample cities .......................................... 58
Exhibit 43: Population density versus urban area examples .......................... 59
Exhibit 44: Barcelona Population Distribution ................................................ 60
Exhibit 45: Jakarta Population Density ........................................................... 60
Exhibit 46: Johannesburg Population Density ................................................ 61
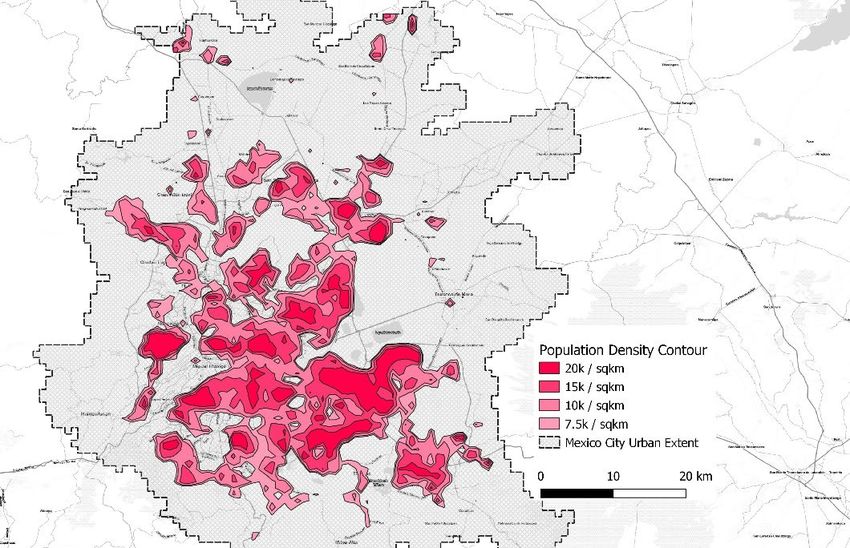
Exhibit 47: Mexico City Population Density .................................................... 61
Exhibit 48: High-density areas in sample cities .............................................. 62
Exhibit 49: Speed requirement for video ........................................................ 67
Exhibit 50: Data rates for car automation sensors.......................................... 67
Exhibit 51: Fibre cost per home passed ......................................................... 68
Exhibit 52: Fibre activation cost per home ..................................................... 68
Exhibit 53: Rural FWA cost assumptions ....................................................... 69
Exhibit 54: Cost per rural household connected using FTTH ......................... 69
Exhibit 55: Cost per rural household covered using FWA .............................. 70
Exhibit 56: FWA deployment cost saving vs. FTTH in rural areas.................. 70
Exhibit 57: Additional outdoor small cells vs. unmet DL spectrum need ........ 72
Exhibit 58: Small cell inter-site distance vs. unmet DL spectrum need .......... 72
Contact
Stefan Zehle, MBA David Tanner, MA (Hons), MSc,
CEO, MIET, CEng
Coleago Consulting Ltd Managing Consultant,
Coleago Consulting Ltd
Tel: +44 7974 356 258
stefan.zehle@coleago.com Tel: +44 7976 415250
david.tanner@coleago.com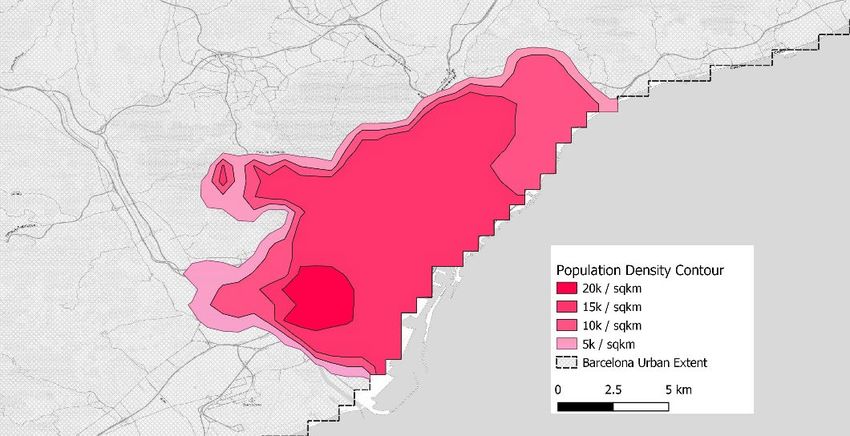
IMT Spectrum Demand

1          Executive summary
Global analysis of spectrum needs
One of the pillars in the vision for 5G is to provide ubiquitous high-speed wireless
mobile connectivity to support several use-cases: “IMT-2020 is expected to provide a
user experience matching, as far as possible, that of fixed networks” 1. The need for
IMT spectrum is driven by the requirements for 5G as set out in the ITU-R
requirements for IMT-2020 2.
5G must deliver a user experienced mobile data rate of 100 Mbit/s in the downlink and
50 Mbit/s in the uplink and accommodate 1 million connections per km2. This poses a
huge challenge in cities with a high traffic density. We have modelled the 5G mobile
area traffic demand and supply in 36 cities around the world. We focus on cities with
population densities of more than 8,000 per km2. In these cities, substantial amounts of
mid-band spectrum are found to be required to deliver the 5G vision in an economically
feasible manner, taking different national income levels into consideration.

Exhibit 1: Total mid-band spectrum needs 2025-2030 time frame

                                           Minimum estimate             Maximum estimate
    High income cities                        1,260 MHz                    3,690 MHz
    Upper middle income cities                1,020 MHz                    2,870 MHz
    Lower middle income cities                1,320 MHz                    3,260 MHz
Source:      Coleago

The range of estimates per national income category reflects the different population
densities of the cities analysed, and our view with regards to the extent of 5G take-up
and offload to high-bands in the examined countries.
The total 3 mid-band spectrum needs when averaged over all 36 examined cities
is estimated to be 2,020 MHz in the 2025-2030 time frame.
Policymakers will, therefore, need to consider making more mid-band 4 available and
prepare national spectrum roadmaps that carefully consider future 5G demand. There
is a concern in the mobile industry that regulators may not be fully aware of the scale of
the 5G traffic density challenge in urban areas. Specifically, there is a concern that
regulators may not be planning to clear and award enough licensed mid-band
spectrum for 5G between now and 2030. There is also a risk that decisions
surrounding additional unlicensed spectrum, or 5G spectrum set-asides for local use or
for vertical industries, may leave mobile operators with a lack of additional 5G
spectrum thus jeopardising their ability to deliver 5G services and a speed consistent
with the ITU-R IMT-2020 vision.
The results of the study presented in this report will help regulators to make informed
decisions by quantifying the need for additional mid-band spectrum with specific
reference to 5G NR (for simplicity also referred to as “5G”, “IMT” or “IMT-2020”) that
relies on the assignment of individual spectrum licenses to operators, which are
required to ensure the quality of service to the end users, be they people or objects.

1
  Report ITU-R M.2441-0 (11/2018), “Emerging usage of the terrestrial component of International
  Mobile Telecommunication (IMT)”
2
  Report ITU-R M.2441-0 (11/2018), “Emerging usage of the terrestrial component of International
  Mobile Telecommunication (IMT)” and Report ITU-R M.2410, “Minimum requirements related to
  technical performance for IMT-2020 radio interface(s)”
3 The total mid-band (i.e., 1500-7125 MHz) spectrum needs includes the “baseline mid-band
  spectrum” for each city (spectrum already in use by mobile operators and expected future
  assignments in the period of 2021 to 2025), as well as the spectrum that is estimated to be
  needed on top up to 2030.
4 Based on current availability and ongoing discussions, policymakers should focus on the 3300-
  7125 MHz range to fulfil the upper mid-band spectrum needs

                                                                       © copyright Coleago 2021    1
IMT Spectrum Demand
5G NR (New Radio) is the radio access technology developed by 3GPP for IMT-2020
networks and relies on the assignment of individual spectrum licenses (i.e., to
operators), which are required to ensure the quality of service to the end users,
including for enhanced mobile broadband (eMBB) and fixed wireless access (FWA),
but also verticals use cases such as Industry 4.0 and automotive communications.
Modelling spectrum need in cities
Our model focuses on the user experienced mobile data rate of 100 Mbit/s on the
downlink and 50 Mbit/s on the uplink in a city, i.e., ensuring citywide speed coverage.
The relevant metrics are: (i) area traffic density demand, and (ii) area traffic capacity
supply in terms of Gbit/s/km2. We examine the area traffic capacity requirement against
the background of increased concurrent bandwidth demand from human users and
other use cases.
On the demand side, we look at mobile area traffic demand density in cities in the
2025-2030 time frame using the following method:
We use the population density in cities as a proxy for mobile area traffic demand
density that is triggered by both human and non-human users. This is appropriate
because traffic generated by, for example, connected vehicles, cameras or video-
based sensors occurs where people are located, and is in addition to the traffic
generated by human users. Hence, tying traffic demand per capita to the 100 Mbit/s
downlink and 50 Mbit/s uplink requirements generates a realistic estimate for future
area traffic demand which takes account of all use cases.
We examine the mobile area traffic capacity requirement against the background of
increased concurrent bandwidth demand from both human users and other use
cases. This is presented in the form of an activity factor ranging from 10% to 25%.
In terms of the calculations, the value represents the proportion of the population
which demand 100 Mbit/s in the downlink and the proportion of the population
which demand 50 Mbit/s in the uplink during the busy period. Therefore, the larger
values of the activity factor are representative of greater take-up of 5G use cases in
the 2030 time frame. The activity factor is therefore a proxy for the demand by both
human users and machine-to-machine communications.
The mobile area traffic density demand is the net demand after deducting
offloading traffic to high-band sites and indoor small cells. Depending on the city,
and factors such as the amount of mid-band indoor small cells and the percentage
of traffic offloaded to high-bands, the area traffic demand varies between 300 to
500 Gbit/s/km2. This is only 3% to 5% of the ITU-R traffic capacity requirement of
10 Mbit/s/m2 that 5G networks should be capable of delivering at specific hotspots,
which is reasonable as it is based on usage across the city.
On the supply side, we begin by considering the network evolution in the 2025-2030
time frame. Aiming for a realistic estimate of spectrum needs from 2025 to 2030, we
make the following conservative assumptions with respect to area traffic capacity
supply:
The “baseline spectrum” for each city includes spectrum already in use by mobile
operators as well as expected future assignments in the period of 2021 to 2025. In
regards to future spectrum assignments, we included not only spectrum that is on
the current roadmap in different countries, but also spectrum that could be added to
the roadmap by 2025. Depending on the specific city among the 36 cities
addressed, the baseline spectrum amount varies from 725 MHz up to 1,420 MHz.
We assume that, depending on the country, within the 2025 to 2030 time frame,
mobile operators will have made the investment to use all “baseline spectrum” for
5G.
We also assume that each operator will deploy three outdoor small cells per each
of its macro sites, invest in MIMO upgrades, install indoor small cells, and deploy
high-band (mmWave) spectrum on outdoor and indoor sites.
© copyright Coleago 2021 2
IMT Spectrum Demand
Despite these investments to supply mobile area traffic capacity, the report concludes
that there will be a significant shortfall of upper mid-band spectrum. Policymakers will,
therefore, need to consider making more spectrum in mid-bands available to allow
operators to meet the IMT-2020 targets.
Additional mid-band spectrum before Our analysis concludes that in addition to the investment in densification, the total
2030 would enable mobile operators mid-band spectrum needs when averaged over all 36 examined cities is
to deliver the ITU-R IMT-2020 estimated to be 2,020 MHz in the 2025-2030 time frame. This is required to
requirements, notably the user deliver the 5G vision of user experienced mobile data rates of 100 Mbit/s on the
experienced data rates of 100 Mbit/s downlink (download speeds) and 50 Mbit/s on the uplink (upload speeds) across
and upload date rates of 50 Mbit/s in the city, i.e., citywide speed coverage, for a range of human and non-human
UL in cities and to deliver smart cities communications and to deliver smart cities in an economically feasible manner.
in an economically feasible manner.
We examined whether small-cell densification could be an alternative to more
upper mid-band spectrum. For example, in a city with a population density of
18,000 per km2 and 7.2 macro sites per km2, 177 additional outdoor small cells per
km2 are required to deliver the same capacity as an additional 1,250 MHz of mid-
band spectrum. Considering an urban area of 100 km2, 17,700 additional small
cells would be required (compared to 720 macro sites) in the absence of the
additional 1,250 MHz. These are significant numbers of outdoor small cells with
relatively small inter-site distances, particularly when it is noted that this average
spacing must be maintained across the entirety of the large city areas involved.
This approach would clearly have a negative impact on the city environment from
an aesthetics point of view and also be very costly. Such small inter-site distances,
over such large areas, may also not be practically possible from an interference
point of view. With such site densities, operators would also push against the
technical limits of network densification.
A reasonable question is whether densification could be considered through the
use of high-band (mmWave) macro/small cells rather than with mid-band small
cells. Given the different options for mmWave densification (e.g., densifying using
only mmWave small cells or adding mmWaves to the existing macro mid-bands
grid in conjunction with mmWave small cells), and considering the different sizes of
cities and their propagation environments (influenced by street design, building
characteristics, etc.), estimating the exact number of needed mmWave sites
requires a case-by-case analysis. However, all options for such a densification
would require new mmWave macro sites and/or new mmWave small cells over
large areas (i.e., not only locally). Given the relatively smaller inter-site distances
that are required by the mmWaves and the average spacing that must be
maintained across the entirety of the large city areas involved, this densification
approach would not represent a viable option, being very costly and undesirable
from an environmental perspective.
Mid-band spectrum for FWA
The benefits of making available additional upper mid-band spectrum extends beyond
cities. Additional upper mid-band spectrum provides a sustainable path to bridge the
urban-rural digital divide.
Using additional mid-band spectrum In countries that have good urban and suburban broadband infrastructure, there is
for 5G FWA would reduce the cost of often a lack of broadband in many rural small towns and villages. FWA relying on
delivering future-proof fibre-like fixed additional mid-band spectrum would make it possible to overcome the urban-rural
wireless access services to digital divide in a time frame consistent with national broadband development
households and enterprises. plans. Importantly, additional spectrum would provide sufficient bandwidth to
ensure that FWA will also be able to address the needs for fixed connectivity as a
long-term solution for rural areas.
© copyright Coleago 2021 3
IMT Spectrum Demand
In lower-income countries where affordability is key, the economic benefits
In countries where affordability is an
associated with additional mid-bands are even more apparent. There are 1.1 to 1.2
issue, the economic implications
billion households worldwide without broadband access and FWA is the fastest
associated with additional mid-bands
growing method of bringing fixed broadband to the unconnected due to the limited
are even more apparent. FWA is the
availability of copper and fibre broadband.
fastest growing method of bringing
fixed broadband to the unconnected Upper mid-band spectrum has a key role to play in providing fibre-like access via
due to the limited availability of 5G at an affordable cost. The ITU and UNESCO Broadband Commission for
copper and fibre broadband Sustainable Development 2025 Targets make this explicit: “By 2025, entry-level
broadband services should be made affordable in developing countries, at less
than 2% of monthly gross national income per capita.” 5 Using additional mid-band
spectrum for 5G would make a key contribution towards attaining the United
Nations Sustainable Development Goals and the Broadband Commission 2025
targets. Alternative solutions based on satellite or fibre typically have higher costs
and, therefore, outside the affordability of many.
Exhibit 2 summarises the benefits of using additional upper mid-band spectrum for IMT
5G NR for a) countries with good fixed wired broadband and b) countries with limited
fixed wired broadband, bringing capabilities such as the economic delivery of a
consistent 100 Mbit/s DL and 50 Mbit/s UL user experienced mobile data rate on
transport routes (highways and railways).
Exhibit 2: Benefits of additional mid-bands for 5G
Benefit of using additional upper mid- Countries with Countries with
band spectrum for IMT extensive limited wired
wired broadband
broadband
Economic delivery of a consistent 100 Mbit/s
DL and 50 Mbit/s UL user experienced
mobile data rate, citywide, urban and
suburban
Ensures that FWA broadband is a long-term
solution
Lower cost for urban FWA overcomes lack of
fibre or xDSL broadband access
Improves rural FWA broadband economics
to bridge the digital divide
Helps to deliver United Nations Sustainable
Development Goals
Economic delivery of a consistent 100 Mbit/s
DL and 50 Mbit/s UL user experienced
mobile data rate on transport routes
(highways and railways)
Contributes to reaching the ITU and
UNESCO Broadband Commission 2025
targets
Source: Coleago Consulting
5
Broadband Commission for Sustainable Development 2025 Targets: “Connecting the Other Half”
© copyright Coleago 2021 4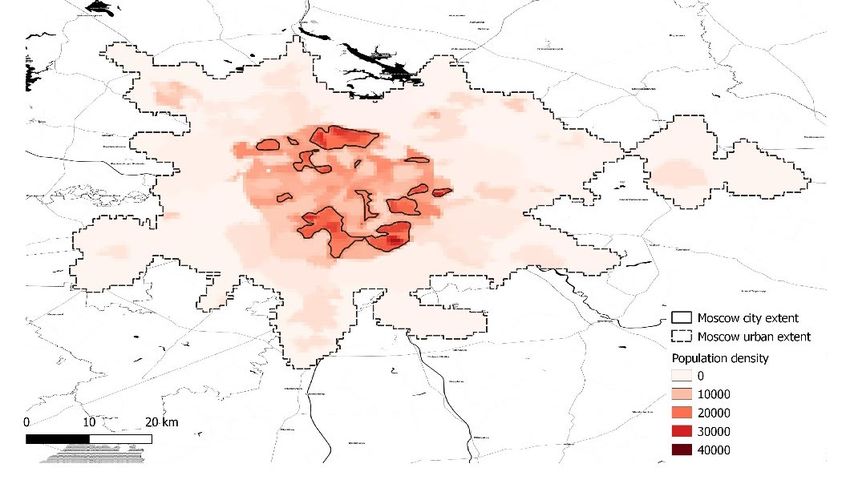
IMT Spectrum Demand
Key findings
The analysis of future needs clearly shows the importance of additional mid-band
spectrum for 5G and its evolution. The findings of our study point towards the following
conclusions:
Without additional upper mid-band spectrum, it will be impossible to economically
deliver the ITU-R IMT 2020 (5G-NR) requirement of a 100 Mbit/s downlink and 50
Mbit/s uplink near guaranteed user experienced mobile data rate across entire
urban areas, and to address smart city needs – key to mitigate climate change.
In addition to deploying additional mid-band spectrum, mobile operators need to
make substantial investments in higher order MIMO base station upgrades, small
cells, and high bands to deliver these user experienced mobile data rates.
The cities in our sample range from 8,000 to 31,000 people per km2. The UN
organisation UN Habitat defines the optimum population density for a sustainable
city as 15,000 per km2. Globally, there are 626 cities with such high-density
population clusters of at least 40 km2. 6 These cities can be found in all six ITU
Regional groups (APT, ASMG, ATU, CEPT, CITEL, RCC). Together these cities
contain an estimated 1.64 billion people. This scale illustrates why allocating
additional upper mid-band spectrum to IMT is of such a significance for a large
proportion of the world’s population.
Depending on the city from our sample of 36 countries, in areas with a population
density greater than 8,000 per km2, the mid-band spectrum needs have been
estimated in order to deliver the ITU-R IMT 2020 requirements for human and non-
human communications and for the development of smart cities.
The total mid-band spectrum needs when averaged over all 36 examined cities is
estimated to be 2,020 MHz in the 2025-2030 time frame.
In areas with a population density below 8,000 per km2, using the additional
spectrum would also deliver benefits. The benefits would either be a lower site
density or faster broadband speeds including for FWA. A lower site density
translates into a lower cost per bit which in turn will translate into lower retail prices
as well as less overall power consumption.
In countries that overwhelmingly rely on wireless for connectivity, with limited fixed
broadband infrastructure, the availability of additional mid-band spectrum would
enable operators to deliver fibre-like 5G FWA to rural towns and villages, thus
helping to achieve rural broadband connectivity targets.
In countries that have good urban and suburban broadband infrastructure, the
availability of additional mid-band spectrum would enable 5G FWA solutions
reducing the average cost of bringing 100 Mbit/s connectivity to the remaining
unconnected rural towns/villages. For example, in Europe, a 79% cost-reduction
compared to fibre to the home. It would also ensure that fibre-like speed FWA is a
long-term solution capable of supporting Very-High-Capacity Networks (VHCN) at
speeds above 100 Mbit/s.
Outside populated areas, substantial capacity is required on major transport routes
(highways and railways) to serve the connected vehicles and smart road use
cases.
6
Based on data provided in Demographia World Urban Areas, (Built Up Urban Areas or World
Agglomerations), 16th annual edition, June 2020,
© copyright Coleago 2021 5IMT Spectrum Demand
2 The requirements for 5G drive the need
for IMT spectrum
2.1 Spectrum to deliver the 5G vision
One of the pillars in the vision for 5G is to provide ubiquitous high-speed wireless
connectivity to mobile and fixed users: “IMT-2020 is expected to provide a user
experience matching, as far as possible, that of fixed networks” 7. The need for IMT
spectrum is driven by the requirements for 5G as set out in the ITU-R requirements for
IMT-2020 8.
5G requirements focus on area traffic Exhibit 3 shows the IMT-2020 (5G) requirements compared to LTE-Advanced (LTE-A).
capacity, near guaranteed data rates, The requirements are not just an incremental percentage improvement, but a multiple
low latency and reliability, and this improvement, i.e., a revolution rather than an evolution. In assessing the need for
drives the need for spectrum. additional IMT spectrum we are focusing on two of these new 5G requirements:
The user experienced data rate jumps from 10 Mbit/s to 100 Mbit/s - a factor of 10
increase (see Appendix D: for a more detailed description); and
Area traffic capacity moves from 0.1 Mbit/s/m2 to 10 Mbit/s/m2 – a 100-fold increase
(see Appendix E: for a more detailed description).
The connection density increases 10-fold to 10 million devices per km2.
Exhibit 3: IMT 2020 requirements
Source: Report ITU-R M.2441-0 (11/2018)
Radio frequencies are the key ingredient to deliver these requirements. Therefore,
there is also a step change in the need for IMT spectrum. Clearly, improved spectral
7
Report ITU-R M.2441-0 (11/2018), “Emerging usage of the terrestrial component of International
Mobile Telecommunication (IMT)”
8
Report ITU-R M.2441-0 (11/2018), “Emerging usage of the terrestrial component of International
Mobile Telecommunication (IMT)” and Report ITU-R M.2410, “Minimum requirements related to
technical performance for IMT-2020 radio interface(s)”
© copyright Coleago 2021 6IMT Spectrum Demand
efficiency associated with higher orders of MIMO, the 5G radio interface, and
densification will enable mobile operators to squeeze more capacity out of existing
spectrum resources. However, it isn’t remotely sufficient to deliver the capacity
requirements of 5G.
2.2 Low, mid, and high frequency bands
Spectrum in the range of 450 MHz to 50 GHz is used today for IMT and band plans
exist in many frequency ranges. Depending on the frequency range and the amount of
spectrum in the range, different frequency bands serve different purposes and cannot,
therefore, be used as substitutes for each other. Therefore, we need to assess the
demand for additional IMT spectrum depending on the frequency range. The large
number of frequency bands can be categorised into four groups: low-bands, lower mid-
bands, upper mid-bands, and high bands.
Low-bands (e.g., 600, 700, 800, 900 MHz) are effective at addressing very wide
area coverage and deep indoor coverage given their good propagation
characteristics. However, there is little spectrum available and hence the channel
bandwidth does not provide much capacity.
Lower mid-bands (e.g., 1500, AWS, 1800, 1900, 2100, 2300, 2600 MHz) are
already used for IMT for 2G, 3G, 4G and 5G. The lower mid-bands have been the
capacity layer for 4G data traffic and in most countries the spectrum is used in FDD
mode. China and the US are notable exceptions to this, with extensive 5G
deployments in the 2600 MHz band with a TDD band plan. The use of this band for
5G will certainly grow over time.
Upper mid-bands (e.g., 3.3-4.2 GHz, Upper mid-bands (e.g., 3.3-4.2, 4.5-5, 5.925-7.125 GHz) are newer to 5G and offer
4.5-5 GHz, 5.925-7.125 GHz) are much wider bandwidths. This is a key 5G capacity resource. As of mid-2020, upper
newer to 5G and offer a much wider mid-band spectrum used in most countries is in the range of 3300 to 3800 MHz.
bandwidth. This is a key 5G capacity Upper mid-bands offer a good combination of propagation and capacity for cities.
resource. The upper mid-bands offer 3GPP standards currently support a 100 MHz wide channel and for a maximum
a good combination of propagation bandwidth of 400 MHz in carrier aggregation mode.
and capacity for cities.
High-bands (e.g., 26, 28, 40, 50, 66 GHz, also referred to as mmWaves) are
effective at addressing areas with very high traffic density and extreme peak data
rates.
The exhibit below shows the capabilities of each spectrum range and relates to their
mix of coverage and capacity. The wider the rectangle, the higher the coverage. The
shorter the rectangle, the higher the capacity. The closer the rectangles, the more the
range is foreseen for such area, in order to guarantee the IMT-2020 requirements.
© copyright Coleago 2021 7IMT Spectrum Demand
Exhibit 4: Mix of spectrum for 5G
Low-bands (600, 700, 800, 900 MHz)
Deep indoor and rural coverage layer, legacy technology and 5G
IMT 2020
Lower mid-bands (1500, AWS, 1800, 1900, 2100, 2300, 2600 MHz)
Requirements
Basic capacity layer, legacy technology and 5G
User experienced
Upper mid-bands (3.3-4.2, 4.5-4.99, 6GHz) data rate DL 100
Citywide speed coverage layer, 5G only Mbit/s & UL 50 Mbit/s
Area traffic capacity
of 10 Mbit/s/m2
High-bands (26, 28, 40, 66
GHz), very high area traffic
density, 5G only
Dense Urban Urban Suburban Rural
Source: Coleago Consulting
3 Spectrum for city-wide speed coverage
3.1 Estimating spectrum requirements in the context of 5G
The ITU-R methodology for calculating spectrum requirements is set out in
“Recommendation ITU-R M.1768-1(04/2013), Methodology for calculation of spectrum
requirements for the terrestrial component of International Mobile
Telecommunications”. Input parameter values to be used in this methodology have
been updated from those employed in Report ITU-R M.2078 (2006) in order to reflect
the developments in mobile telecommunication markets. Report ITU-R M.2290-0
(12/2013) Future spectrum requirements - estimate for terrestrial IMT” applies this
methodology to arrive at a forecast for 2020. This methodology proved to be useful to
forecast spectrum requirements in the medium term in the context of WRC-15.
The ITU methodology was driven by traffic volume which was a reasonable approach
because LTE is essentially used for best effort smartphone connectivity. In contrast the
5G vision is for a ubiquitous high speed user experience and connectivity for a wide
range of new uses coupled with new features. Therefore, a key factor in driving the
demand for capacity is the vision that 5G should provide the 100 Mbit/s user
experienced data rate in the downlink and 50 Mbit/s in the uplink (for simplicity, we will
refer to these throughput requirements as 100/50 Mbit/s requirement in the rest of the
report) anytime, anywhere and while “on the move”. While fundamentally a particular
speed cannot be guaranteed in a mobile network, there is a quasi-guarantee which
translates into a high probability of experiencing this data rate. This means networks
will be designed to deliver a data rate (Mbit/s) rather than data volume (Gbytes/month).
As a result, as we transition to 5G, the need for capacity will grow faster than traffic
volume.
5G is not simply a continuation as we 5G also enables the Internet of Things (IoT) with Massive Machine Type
know it. The 5G vision is for a Communications (mMTC) and Ultra Reliable and Low Latency Communications
ubiquitous fibre-like speed user (uRLLC). 5G end to end features such as making available a slice of the network for
experience and connectivity for a specific use cases bring a new dimension to how wireless communications can be
wide range of new uses coupled with used.
new features.
© copyright Coleago 2021 8IMT Spectrum Demand
Exhibit 5 illustrates the 5G set of applications and use cases, all enabled by the
enhanced capabilities of 5G compared to 4G. With these capabilities 5G is an enabling
platform for what has been described as the “4th industrial revolution” 9. While
appearing futuristic today, connected vehicles, smart deliveries with drones and robots
and smart cities will generate traffic volumes far higher than todays’ smartphone driven
data usage rates.
5G envisions many use cases towards the city of the future or smart cities. These are
crucial for our environment. In these cities, industries will be able to control energy
consumption, through traffic management and transport will be able to pick the most
optimized paths
Driven by these requirements, we have based our analysis of the need for additional
upper mid-band spectrum in delivering near guaranteed user experienced data rates of
100 Mbit/s on the DL and 50 Mbit/s on the UL, anytime, anywhere in cities while “on
the move”.
Exhibit 5: New use cases and applications drive 5G spectrum needs
5G is not simply a continuation of
the mobile business as we know it
Extremely high data rates, very high traffic
Fibre like data rates, extremely high traffic
volumes, high traffic density, rapid
volumes
mobility, city wide coverage
Enhanced Mobile Broadband Fixed Wireless Access
Smartphone, 8k 250fps video, AR/VR, cloud Home, business, retail, nomadic, cameras
based gaming, venues, body cams
Very large number of devices, very low
Very low latency, very high availability and
device cost, low energy, high density,
reliability
country wide coverage
Massive Machine Type Communications Critical Machine Type Communications
Sensors, meters, tracking, fleet management Self-driving car, industrial applications,
manufacturing
Source: Coleago Consulting
3.2 ITU-R IMT-2020 user experienced data rate requirement
We have developed a concise and We have developed a concise and easily verifiable model to examine the need for
easily verifiable model to examine the upper mid-band spectrum to deliver the 100 Mbit/s user experienced data rate in the
need for mid-band spectrum in an downlink and 50 Mbit/s in the uplink ITU-R requirements for IMT-2020 (5G) city wide.
urban environment to deliver the 100 The need for spectrum is driven by traffic density measured in Gbit/s per km2.
Mbit/s user experienced data rate in Therefore, to examine future spectrum needs for IMT, we need to analyse traffic
downlink and 50 Mbit/s in the uplink demand in areas with high population densities, i.e., cities. What matters in assessing
ITU-R requirement for IMT-2020. spectrum needs is area traffic density demand vs. area traffic capacity supply.
Looking at 5G tariff plans, unlimited Our model is aligned with a change in how mobile broadband is being sold. In a 4G
data volumes are becoming common world, mobile operators sell data volumes (usually in gigabytes). Looking at 5G tariff
and instead of selling data volume, plans, unlimited data volumes are becoming common and instead of selling data
5G mobile operators sell speed volume, 5G mobile operators are increasingly selling speed (Mbit/s), i.e., the user
(Mbit/s), i.e. the user experienced experienced data rate. While this is new for mobile connectivity, selling speed rather
data rate than data volume is of course the norm for fibre, cable, or xDSL fixed broadband. As
explained above, the vision for 5G is to deliver fibre-like connectivity anytime,
9
Klaus Schwab, The Fourth Industrial Revolution, Magazine of Foreign Affairs, 12 Dec 2015
© copyright Coleago 2021 9IMT Spectrum Demand
anywhere. Hence, we need to base traffic forecasts on the user experienced data rate
and not monthly data volumes.
In the development of the ITU’s IMT-2020 requirements, the user experienced data
rate relates to human users but this will account for only part of the traffic. Connected
cars, cameras, and IoT devices will generate substantial amounts of traffic. Hence one
of the requirements of 5G is to support 10 million devices per km2. The uncertainty
over how much simultaneous capacity will be required for all of these use cases in a
given area is very large and bottom-up models of future traffic are speculative. Our
approach is to use population density in cities as a proxy for traffic density to estimate
the minimum or floor capacity requirement. This is conservative, since traffic generated
by connected vehicles and video-based sensors could be a multiple of traffic generated
by human users. Hence tying traffic demand per capita based on the ITU-R IMT-2020
requirements generates a conservative estimate for future spectrum needs.
The advantage of focusing on the 5G The advantage of focusing on the 5G requirements is that the model is easy to validate
requirements for a minimum data rate as it relies on a small number of key assumptions around typical cell sizes and average
is that the model is easy to validate spectral efficiencies that are representative of future 5G deployments.
because it relies on a small number of
For each city, we took account of the spectrum needs identified for both downlink and
key assumptions.
uplink and calculated the additional upper mid-band spectrum needs. Since the
identified additional upper mid-band spectrum is expected to have a TDD band plan, it
will be shared in the time domain between the DL and the UL, in this case assuming a
DL:UL ratio of 3:1.
There is some uncertainty over how the DL:UL ratio may change over time. For
example, some applications such as cameras will increase the need for UL capacity. In
the longer term the total DL and UL area traffic demand must be served using
additional upper mid-band spectrum and by adjusting the DL:UL split in synchronised
TDD bands proportionate to relative demand. To examine the relevance of the DL:UL
assumed demand, we tested the sensitivity of the DL:UL ratio of 3:1. Within the
spectrum scenarios considered, the 3:1 ratio gives the lower demand for additional
upper mid-band spectrum. Our modelling shows that in the longer term the uplink may
become the driver for additional spectrum needs.
The 100 Mbit/s DL and 50 Mbit/s UL data rate requirements are not the same as a
guaranteed data rate. The economics of mobile networks are driven by the fact that
radio access network resources are shared amongst users. This is the key reason why
per gigabyte retail prices for mobile data services have declined substantially and, with
the introduction of 5G, continue to decline at a fast rate. In a simultaneously multi-user
network, the user experienced data rate is dependent on the probability of
simultaneous demand from multiple users in a given cell. Providing a guaranteed data
rate for all users would not be feasible from an economic perspective. The area traffic
capacity supply is derived from an average spectral efficiency which cannot guarantee
that the user experienced data rate is delivered consistently at all times. Therefore, it
would be inappropriate to turn the ITU-R IMT 2020 user experienced data rate
requirements into a regulatory obligation.
© copyright Coleago 2021 10IMT Spectrum Demand
3.3 Modelling upper mid-band spectrum needs
3.3.1 Overview of the spectrum demand model
We have developed a methodology which allows us to compare area traffic density
demand with area traffic capacity supply in cities. The metric used is Gbit/s per square
kilometre (Gbit/s/km2). To model future area traffic density demand we used several
drivers which are explained in detail in section 3.3.2 below and we forecast relevant
variables in the 2025-2030 time frame which are examined in section 3.3.3 below. The
excess demand over supply drives the forecast of the need for additional upper mid-
band spectrum. Exhibit 6 summarises the variables in the model.
Exhibit 6: Area traffic demand and capacity supply model
Concurrent demand Concurrent demand
from human users from new use cases
ITU requirement Offload to indoor
100Mbit/s DL & 50 Population density Activity factor (%) small cells and
Mbit/s UL experience mmWave sites (%)
Traffic demand per
km2 (Gbit/s/km2)
Capacity supply per
km2 (Gbit/s/km2)
Macro site inter-site Macro site MHz of spectrum on Spectral efficiency
distance meters sectorisation macro site bit/s/Hz macro site
Number of outdoor Spectral efficiency
Outdoor small cell MHz of spectrum on
small cells relative to bit/s/Hz for outdoor
sectorisation outdoor small cell
macro sites small cell
Source: Coleago Consulting
3.3.2 The area traffic density demand side – key assumptions
To model the demand for capacity in a city with a particular population density, we
considered the following drivers:
The IMT-2020 requirement for a downlink user experienced data rate of 100 Mbit/s
and a 50 Mbit/s uplink data rate;
The population density, which varies by city and is the key driver explaining
differences in spectrum needs between cities and by implication between countries;
An assumption of concurrent demand at busy times from human users and new
use cases (the activity factor);
An assumption of how much of the traffic demand would be satisfied by high bands
(24 GHz and above) sites; and
An estimate of the percentage of traffic offloaded to indoor upper mid-band small
cells.
© copyright Coleago 2021 11IMT Spectrum Demand
The objective is to compare the traffic density demanded in a city with the capacity
delivered, depending on the amount of spectrum deployed. We describe these drivers
in more detail below.
100 Mbit/s DL and 50 Mbit/s UL user experienced data rate
The ITU-R requirement is that 5G In order to deliver 100 Mbit/s DL and 50 Mbit/s UL user experienced data rate citywide,
must deliver a DL user experienced i.e., anytime anywhere in the city, mobile operators must cater for speed coverage
data rate of 100 Mbit/s and 50 Mbit/s across the entire city area. This implies that the traffic per square kilometre over an
in UL. This is the starting point for the entire city area is a function of the population density in that city. This results in an
demand analysis. average traffic demand per square kilometre (Mbit/s/km2).
Citing an average implicitly assumes that traffic demand is evenly distributed across
the city area. In reality that is not the case but, for our approach to demand modelling,
the simplified assumption that traffic which would be carried by low-bands and lower /
upper mid-bands would be relatively evenly distributed is reasonable, considering the
following:
As explained below, data usage and the duration of usage is increasing and hence
high bandwidth demand extends over longer periods of time.
Today’s traffic distribution relates largely to traffic demand from smartphones. In a
mid-term future, traffic demand by new use cases and new applications will occur in
locations within a city where previously there may not have been a need for much
capacity, for example on urban transport routes. This tends towards a more even
demand for capacity across a city area.
There are always areas with a very high 5G area traffic density demand. Our model
takes account of this by assuming that high-bands will provide 5G capacity in those
areas. This will effectively take care of localised peaks in area traffic demand thus
leaving the demand in the remaining area more evenly distributed (i.e., offload to
high-bands as called in this model).
Population density
Our approach is to use population Our approach is to use population density in cities as a proxy for traffic density to
density in cities as a proxy for traffic estimate the minimum or floor capacity requirement. Traffic generated by connected
density to estimate the minimum or vehicles and video based sensors could be a multiple of traffic generated by human
floor capacity requirement. users and therefore tying traffic demand per capita to the user experience data rate
generates a conservative estimate for future spectrum needs.
The population density is the average in a dense area of a city. We focused on cities
that have a sizeable area with a population density of at least 8,000 per km2. In many
cases, the high-density area is not the same as the administrative area of a city or the
build-up area of a city, like in in Istanbul, where we base our analysis on what is still a
large high-density area of 698 km2 with an average population density 17,316 per km2,
while its entire administrative area is of 1,375 km2. A detailed explanation on urban
extents and population density is shown in Appendix C.
In principle, other things being equal, the higher the density, the greater the demand
per km2 and consequently the higher the population density the greater the need for
additional mid-band spectrum.
Concurrent demand for capacity – the activity factor
As regards the requirement to serve users demanding 100 Mbit/s in the downlink and
50 Mbit/s in the uplink, not all users in a particular cell would require this at the same
time. We need an assumption with regards to the concurrent or simultaneous demand
for capacity during the busy period of a cell, including human and non-human usage.
In our model, demand from human and non-human use cases is captured in the form
of an “activity factor” to represent concurrent demand for bandwidth in the busy period
of a cell, considering 100 Mbit/s DL / 50 Mbit/s UL equivalent demand per capita, then,
applying this activity to the population density. The higher the activity factor the greater
the need for additional mid-band spectrum.
© copyright Coleago 2021 12IMT Spectrum Demand
In addition to human users, 5G is designed to support massive machine type
communications and critical machine type communications such as connected cars,
sensors, and cameras. The 5G vision anticipates 10 million connections per km2.
When this becomes a reality, in dense cities with population densities of 10,000 to
30,000 people per km2, human users will only account for less than 1% of connections.
Therefore, there will be considerable bandwidth demand from diverse non-human use
cases.
To illustrate the relative scale of device density, we looked at vehicles and cameras:
In European cities there is around one vehicle per two people. Vehicles include
cars, commercial vehicles, and public transport vehicles.
The number of connected cameras is growing, adding to UL demand. For example,
in London there are an estimated one CCTV camera per 13 people. Cameras are
being added at a fast rate including, bicycle riders, body cams, LIDAR cameras for
traffic monitoring. Where previously simple sensors may have been used, camera-
based analysis using AI will become commonplace. Today most cameras do not
use cellular connectivity, but new installations are increasingly connected via
cellular. Furthermore, cameras for mobile use, such as body cams, rely on cellular
connectivity. While not all camera may require 50 Mbit/s, some stream 24/7, i.e.,
the notional activity factor for cameras which stream 24/7 is 100%, i.e., there is a
continuous traffic demand which contributes to total concurrent area traffic demand.
These non-human use cases include those that require a high bit rate at a specific time
such as cameras and assisted driving cars and those that require a lower bit rate such
as meters and simple sensors. In aggregate these devices will create significant
concurrent area traffic demand which adds to demand from human users.
The activity factor which represents concurrent 100/50 Mbit/s equivalent area traffic
demand per capita will increase over time driven by the following factors:
Increased adoption of 5G smartphones and associated data usage;
Increase in sustained video streaming downlink and uplink;
Higher bit rates demand by better device capabilities;
Application driven high bandwidth and low latency requirements; and
Increasing density of non-human connected devices.
Looking at the increase in data usage from humans, already today mobile network
usage is dominated by smartphones and is increasing rapidly. In Finland average
usage is already nearly five times higher than this: “Mobile data usage grew to 34
gigabytes per Finn per month during the first half of 2019, which is 21 per cent more
than the year before” 10. Looking specifically at 5G users in South Korea, monthly data
usage is three times 11 higher compared to 4G users. This is driven by the fact that
users opt for 5G plans which offer unlimited data usage and do not throttle speed
above a certain limit.
The key driver in the growth of mobile usage is video, including streaming content,
video calling, video gaming, and streaming from cameras. These all demand a
constant speed over longer time periods that can run into the hours rather than
minutes. The longer the period during which people and other devices stream video,
the more concurrent use there will be. This is evident from FTTH, xDSL, and cable
broadband which have a busy period lasting several hours rather than the peaky traffic
pattern associated with today’s mobile use. Long streaming times leads to a situation
where more people use their devices concurrently in the same cell. This translates into
a higher activity factor for human users.
10
Source: Traficom, Finish Transport and Communications Agency, 2.11.2019
11
Source: MITC, December 2019 traffic
© copyright Coleago 2021 13IMT Spectrum Demand
Not only is the duration of video sessions increasing, but also the bit rate. For example,
the capabilities of smartphones are advancing offering ever higher video quality and 4K
video is now available on mobile orientated streaming platforms such as YouTube.
Exhibit 7 shows the video quality settings available on an iPhone 12 (5G) and the
amount of data is created for a one-minute video. Exhibit 8 shows the relationship
between video quality and required bandwidth. Even today’s 5G smartphones have
applications that require a data rate of 59 Mbit/s. In the future we will see duplex video
calls at this data rate simultaneously in the uplink and the downlink and over the next
10 years we will see applications that require a data rate of 100 Mbit/s and above. For
example, 6 Degrees of Freedom or Free Viewpoint AR/VR video requires a data rate of
200 Mbit/s 12 and higher. Appendix G contains examples data rates required for new
applications, including AR and VR.
Exhibit 7: Video quality options and impact on bandwidth demand
Impact on data usage:
(Lowest quality on iPhone12)
1.4x the lowest quality
2.2x the lowest quality
3.3x the lowest quality
4.2x the lowest quality
9.8x the lowest quality
Source: iPhone 12 screenshot
12
“VR and AR Pushing Connectivity Limits”, Qualcomm, October 2018
© copyright Coleago 2021 14IMT Spectrum Demand
Exhibit 8: Video data volume and data rate depending on video quality
500 70
59
On minute video data volume Mbytes
450
One minute video data volume Mbytes
60
400
350 50
Data speed - Mbit/s
300
40
250
25 30
200
20
150 20
13
100 9
6 10
50
0 0
720p HD 1080p HD 1080p HD 4k @ 24 4k @ 30 4k @ 60
@ 30 fps @ 30 fps @ 60 fps fps fps fps
Mbytes Mbit/s
Source: Coleago
There is considerable uncertainty over how much of the demand for the new use cases
in a given area will be simultaneous. Traffic generated by connected vehicles,
cameras, and video-based sensors could be a multiple of traffic generated by human
users as illustrated by the following examples:
Conventional and LIDAR cameras stream data continuously, i.e., they demand
bandwidth over hours, and even 24/7. Body worn cameras worn by first responders
and other field operatives may stream continuously during several hours.
Connected cars today generate hardly any traffic. However, over a 10-year time
frame a connected car may generate about as much data as 3,000 people as
explained in Chapter 6 of this report 13. We note that only part of the data will be
streamed live.
Since today’s data usage is still dominated by 4G, one cannot use today’s usage to
extrapolate what concurrent bandwidth demand will be once 5G has been widely
adopted in the 2025-2030 time frame. While demand for area traffic capacity will clearly
increase by orders of magnitude, there is uncertainty over the speed and quantum. It
is with this in mind that we analyse the need for additional mid-band spectrum for a
range of activity factors.
In highly industrialised countries, we expect that the activity factor for mobile 5G in
cities will reach 25% within the 2030 time frame considered by this report. In countries
with lower access to wired broadband, 5G FWA may also drive concurrent demand for
the user experience data rate in cities, thus pushing up the activity factor to 20-25%
levels.
High-bands offloading factor
As of April 2021, high=bands (mmWaves) have started to be deployed. It is clear that
mmWave will be deployed by 2025-2030 more largely and thus we consider traffic
offload to this range. The higher the percentage of traffic offloaded to high-band
spectrum, the lower the demand for additional upper mid-band spectrum.
13
Brian Krzanich, CEO, Intel, 2019
© copyright Coleago 2021 15You can also read