Seismic Hazard in Queenstown Lakes District - August 2015 - Otago ...
←
→
Page content transcription
If your browser does not render page correctly, please read the page content below
Seismic Hazard in Queenstown Lakes
              District

              August 2015
Otago Regional Council
Private Bag 1954, Dunedin 9054
70 Stafford Street, Dunedin 9016
Phone 03 474 0827
Fax 03 479 0015
Freephone 0800 474 082
www.orc.govt.nz

© Copyright for this publication is held by the Otago Regional Council. This publication may
be reproduced in whole or in part, provided the source is fully and clearly acknowledged.

ISBN [get from Comms Team]

Report writer:          Ben Mackey, Natural Hazard Analyst
Reviewed by:            Michael Goldsmith, Manager, Natural Hazards

Published August 2015

Seismic Hazard in the Queenstown Lakes District                                           iii

Overview
The Otago Regional Council is assessing the seismic hazard across parts of Otago, with a
focus on the more densely populated urban areas of Wanaka, Queenstown, Alexandra, and
Dunedin. This review focuses on the seismic hazard facing the Queenstown Lakes district,
encompassing the Upper Clutha region around Wanaka, and the Wakatipu basin area
surrounding Queenstown. Previous assessments of the seismic hazard in the broader Otago
region were provided by Johnston and Heenan (1995) and Murashev and Davey (2005).

The first section of the report outlines the primary hazards associated with earthquakes,
notably fault rupture, ground shaking, and tectonic deformation. Ground shaking during
earthquakes has a range of subsequent effects, termed secondary hazards. Section 2
describes secondary hazards associated with earthquakes, which include liquefaction,
landslides and rockfall, lake tsunami and seiching, and channel aggradation. Some of these
secondary effects are not unique to earthquakes, but seismic shaking is commonly a
significant factor in their occurrence.

Sections 3 and 4 respectively assess the seismic hazards in the Upper Clutha and Wakatipu
areas. Although geographically close, the two areas have contrasting geography, patterns of
development, and are exposed to different seismic sources. In combination, these factors
determine that each area has contrasting vulnerabilities to earthquakes.

The primary seismic hazard facing the Queenstown Lakes district is an Alpine Fault
earthquake, which has a 30% probability of rupture in the next 50 years. An MW 8.1 Alpine
Fault earthquake is predicted to cause low frequency shaking for 1−2 minutes in Wanaka
and Queenstown, at a shaking intensity of MMVII (Modified Mercalli scale).

Other known active faults in the region, such as the Nevis-Cardrona Fault Zone, the
Grandview Fault and Pisa Fault are smaller and rupture much less frequently than the Alpine
Fault, but they are closer to Wanaka and Queenstown, and are capable of generating high
intensity ground shaking.

The Nevis-Cardrona Fault System crosses both the Wakatipu and Upper Clutha areas. An
earthquake on the Nevis-Cardrona Fault System will potentially cause ground deformation
along the length of the rupture. This may incorporate surface cracking, tilting, warping or
folding. Ground deformation can impact on the functionality of buildings, infrastructure and
natural or engineered drainage systems along or near the fault.

In addition to known fault structures, the 2010−2011 Canterbury earthquake sequence has
focussed attention on ‘blind’ faults with no surface expression, particularly smaller faults
close to urban areas. The 2010−2011 Canterbury earthquake sequence occurred on faults
with low recurrence intervals that had not been identified prior to their rupture. Beyond
shaking, the Christchurch earthquakes emphasise the hazard posed by secondary effects of
earthquakes, notably liquefaction, lateral spreading, and rockfall.

Property owners and infrastructure managers in the Upper Clutha and Wakatipu areas need
to be aware of the hazard posed by earthquakes. The effects of an earthquake do not end
once the shaking stops. Post-event functionality of structures and assets should be
considered, with particular attention given to the landscape response to an earthquake, and
iv                                                     Seismic Hazard in the Queenstown Lakes District

how this will impact the built environment. Earthquake-induced hazards and landscape
changes with potential to affect the Queenstown Lakes district include rapid channel
aggradation and increased susceptibility to debris flows, transient changes in groundwater
level, extensive landsliding and rockfall in the surrounding mountains, liquefaction-induced
instability along some river banks and lake margins, and impaired drainage from the outlets
of Lakes Wanaka and Wakatipu. Regional transport corridors, particularly the Haast
Highway, Crown Range Road, Kawarau Gorge, and major bridges would need to be able to
withstand the effects of earthquake shaking and related effects to remain functional after an
event.

Finally, section 5 assesses the seismic hazards in the context of what additional information
will help reduce the seismic hazard to the Queenstown Lakes district. In particular, increased
understanding relating to the susceptibility of lake silts to liquefy, local exposure to rockfall,
and the hazard posed by the Nevis Cardrona Fault System will help to better quantify the
local seismic risks.

Table of Contents
Seismic Hazard in the Queenstown Lakes District                                                                                               v

Contents
Overview     iii
1.           Primary Seismic Hazards ................................................................................................1
      1.1.   Surface Rupture ..............................................................................................................1
      1.2.   Ground Motion ................................................................................................................2
             1.2.1. Topographic amplification of seismic waves........................................................... 3
      1.3.   Tectonic Movement .........................................................................................................4
2.           Secondary Seismic Hazards............................................................................................5
      2.1.   Liquefaction and Lateral Spreading ................................................................................. 5
      2.2.   Landslides and Mass Movement...................................................................................... 7
             2.2.1. Lake Edge and River Bank Collapse ...................................................................... 7
             2.2.2. Rockfall .................................................................................................................8
             2.2.3. Rock Avalanches...................................................................................................9
             2.2.4. Deep Seated Schist Landslides ............................................................................. 9
      2.3.   Lake Tsunami ............................................................................................................... 10
      2.4.   Seismic effect on aquifers.............................................................................................. 11
      2.5.   Medium-Term Geomorphic Impact ................................................................................ 12
             2.5.1. Channel aggradation and debris flows ................................................................. 12
             2.5.2. Landslide Dams................................................................................................... 12
3.           Seismic Hazard in the Upper Clutha Area ...................................................................... 13
      3.1.   Regional Setting and Glacial History.............................................................................. 13
             3.1.1. Geology............................................................................................................... 13
             3.1.2. Glacial History ..................................................................................................... 16
             3.1.3. Active Faulting..................................................................................................... 19
      3.2.   Upper Clutha Area Seismic History................................................................................ 22
      3.3.   Primary Seismic Hazards in the Upper Clutha Area ....................................................... 25
             3.3.1. Ground Motion .................................................................................................... 25
             3.3.2. Active Faults in Wanaka Area .............................................................................. 26
             3.3.3. NW Cardrona Fault.............................................................................................. 27
             3.3.3.1.      Effect of Cardrona Fault Rupture.................................................................... 29
             3.3.4. Grandview Fault .................................................................................................. 30
             3.3.4.1.      Effect of Grandview Fault Rupture.................................................................. 30
             3.3.5. Other Local Active Faults..................................................................................... 31
             3.3.6. ‘Blind’ Faults ........................................................................................................ 31
             3.3.7. Alpine Fault Earthquake ...................................................................................... 32
             3.3.8. Active Faults beyond the Upper Clutha Area ........................................................ 32
             3.3.9. Tectonic Movement at Lake Wanaka Outlet ......................................................... 33
      3.4.   Secondary Seismic Hazards in Wanaka ........................................................................ 33
             3.4.1. Liquefaction risk in the Upper Clutha area............................................................ 33
             3.4.2. Landslides and Mass Movement.......................................................................... 36
             3.4.2.1.      Lake Edge and River Bank Collapse .............................................................. 36
             3.4.2.2.      Rockfall.......................................................................................................... 38
             3.4.2.3.      Rock Avalanches ........................................................................................... 39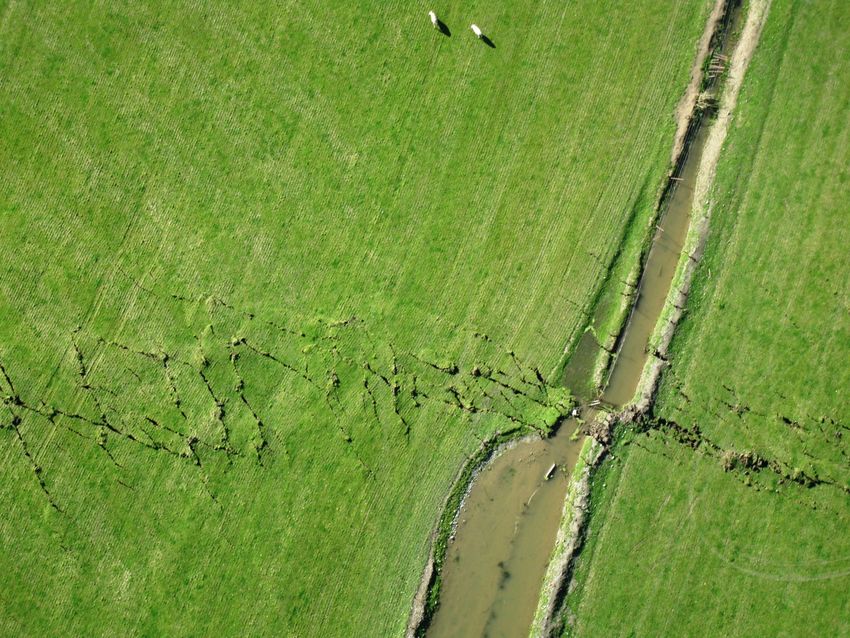
vi                                                                            Seismic Hazard in the Queenstown Lakes District

             3.4.2.4.      Deep Seated Schist Landslides...................................................................... 40
             3.4.3. Lake Tsunami...................................................................................................... 41
      3.5.   Medium-Term Geomorphic Impact ................................................................................ 42
             3.5.1. Channel aggradation and debris flows ................................................................. 42
             3.5.2. Landslide Dams................................................................................................... 43
4.           Seismic Hazard in the Wakatipu Basin .......................................................................... 45
      4.1.   Regional Setting and Glacial History.............................................................................. 47
             4.1.1. Geologic history................................................................................................... 47
             4.1.2. Active Faulting..................................................................................................... 48
             4.1.3. Glacial History ..................................................................................................... 49
             4.1.4. Seismic History.................................................................................................... 51
      4.2.   Primary Seismic Hazards .............................................................................................. 53
             4.2.1. Surface Rupture .................................................................................................. 53
             4.2.1.1.      Nevis Cardrona Fault Rupture ........................................................................ 53
             4.2.1.1.      Effect of Nevis-Cardrona Fault Rupture .......................................................... 54
             4.2.2. Other Local Active Faults..................................................................................... 55
             4.2.3. ‘Blind’ Faults ........................................................................................................ 55
             4.2.4. Ground Motion .................................................................................................... 55
             4.2.4.1.      Alpine Fault Earthquake ................................................................................. 56
             4.2.4.2.      Regional Faults.............................................................................................. 57
             4.2.5. Topographic amplification of seismic waves......................................................... 57
             4.2.6. Tectonic Movement ............................................................................................. 57
      4.3.   Secondary Seismic Hazards.......................................................................................... 58
             4.3.1. Liquefaction risk in Wakatipu Area ....................................................................... 58
             4.3.2. Landslides and Mass Movement.......................................................................... 60
             4.3.2.1.      Lake Edge and River Bank Collapse .............................................................. 60
             4.3.2.2.      Rockfall.......................................................................................................... 61
             4.3.2.3.      Rock Avalanches ........................................................................................... 63
             4.3.2.4.      Deep Seated Schist Landslides...................................................................... 64
             4.3.3. Lake Tsunami...................................................................................................... 64
      4.4.   Medium-Term Geomorphic Impact ................................................................................ 65
             4.4.1. Channel aggradation and debris flows ................................................................. 65
             4.4.2. Growth of Shotover Delta .................................................................................... 66
             4.4.3. Landslide Dams................................................................................................... 67
5.           Summary and future work.............................................................................................. 69
             5.1.1. Liquefaction ......................................................................................................... 69
             5.1.2. Site-Specific Seismic Response .......................................................................... 70
             5.1.3. Nevis-Cardrona Fault System .............................................................................. 70
             5.1.4. Earthquake Induced Tsunami .............................................................................. 70
             5.1.5. Rockfall Hazard Zonation .................................................................................... 71
             5.1.6. Benchmarks to detect tectonic change................................................................. 71
6.           Acknowledgements ....................................................................................................... 72
7.           References.................................................................................................................... 73

Table of Contents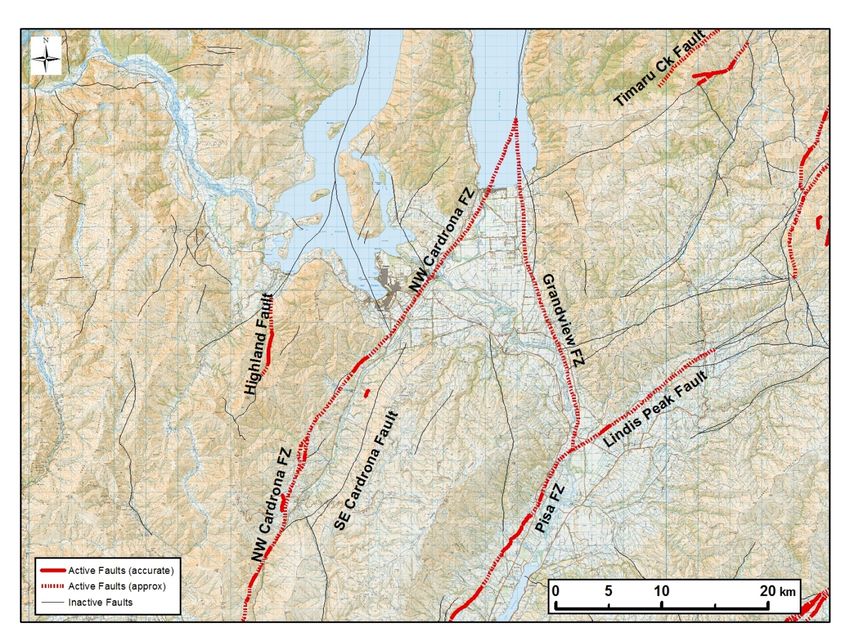
Seismic Hazard in the Queenstown Lakes District                                                                                                             vii

Appendix A – Measuring Earthquake Size and Shaking Intensity....................................................... 77
           Probabilistic Seismic Hazard Analysis ........................................................................... 78
Appendix B – Geologic History .......................................................................................................... 79
Appendix C – Upper Clutha Glacial History ....................................................................................... 81
Appendix D – Geologic Time Scale ................................................................................................... 84
Appendix E – Modified Mercalli Scale................................................................................................ 85

List of figures
Figure 1. The surface trace of the Greendale Fault rupture cut across paddocks in the Canterbury Plains in
                 September 2010. (Photo courtesy M. Quigley). The ground moved up to 5.3 m laterally, but was
                 expressed at the surface as a zone of distributed deformation up to 300 m wide, seen in the
                 network of shear structures (Quigley et al., 2012).......................................................................... 1
Figure 2. The main styles of faulting. Faults in western Otago are primarily Reverse Faults, reflecting the regional
                 compression, whereas the Alpine Fault is a predominantly a strike-slip fault (From USDA National
                 Park Service). .............................................................................................................................. 2
Figure 3. Seismographs from two Canterbury Earthquakes as recorded in Christchurch in Sept 2010 (blue line)
                 and Feb 2011 (red line). The Black line is a synthetic seismograph predicting the level and duration
                 of shaking recorded in Christchurch during a hypothetical Alpine Fault earthquake. The more
                 distant but larger Alpine Fault event has less intense ground shaking, but continues for a much
                 longer duration (Canterbury Earthquakes Royal Comission). ......................................................... 3
Figure 4. Avulsion of the Hororata River following fault movement during the September 2010 Darfield Earthquake
                 (Photo courtesy D. Barrell, GNS Science). .................................................................................... 4
Figure 5. Effects of liquefaction (from IPENZ Factsheet) ..................................................................................... 6
Figure 6. Liquefaction folloiwng the Christchurch 2011 Earthquake (Photo courtesy A. King, GNS Science) ......... 6
Figure 7. Lake edge failure along Lake Te Anau during the 2003 Fiordland earthquake (Hancox et al. 2003). This
                  failure incorporated liquefaction and lateral spreading of the lake beach area. ............................... 8
Figure 8. Rockfall damage to dwelling at Rapaki, Christchurch, during Feb 22nd 2011 earthquake. The gouge in
                  the foreground is an impact divot from a boulder, which then impacted the house (Photo courtesy
                  D. Barrell, GNS Science).............................................................................................................. 9
                                                                                           3
Figure 9. The 2003 Fiordland earthquake caused a 200,000 m rockslide into Charles Sound. The landslide
                 caused a small tsunami which ran 4-5 m up the other side of the sound, approximately 800 m away.
                 (Hancox et al., 2003). ................................................................................................................. 11
Figure 10. Upper Clutha study area and principal geographic features. The report focuses on the populated areas
                 below the outlets of Lakes Wanaka and Hawea. ......................................................................... 14
Figure 11. Geology of the Upper Clutha area. The pale blues and purples are varying metamorphic grades of
                 schist bedrock. Glacial deposits (undifferentiated) and alluvial deposits occupy most of the valleys
                 and lower hillslopes. Stippled areas represent glacial moraines. Remnants of Quaternary gravels
                 persist in the Cardrona Valley, and isolated outcrops of the Tertiary Manuherikia sediments can be
                 found southeast of Wanaka. Modified from QMAP (Turnbull, 2000). ............................................ 15
Figure 12: Active faults in west Otago and surrounding regions (From QMAP and GNS Active Fault Database).
                 Otago region is outlined. ............................................................................................................ 16
Figure 13. Depositional glacial landforms in the Upper Clutha area, and location of major active faults. Each
                 glacial advance has a moraine (stippled) and an associated outwash plain (unstippled). Older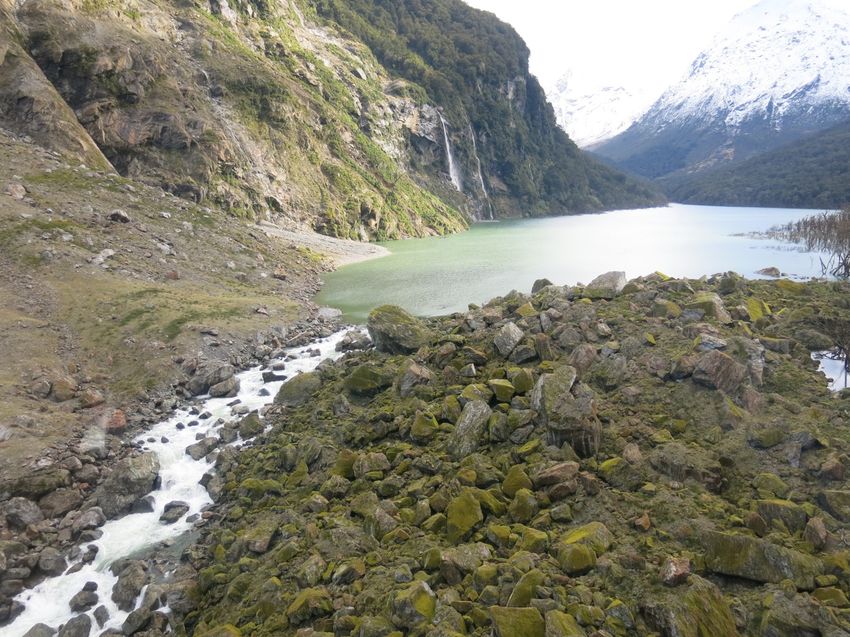
viii Seismic Hazard in the Queenstown Lakes District
glacial periods (e.g., Lindis, Lowburn) had larger glaciers which extended further down the Clutha
Valley, and are preserved higher on the valley walls, beyond the extent of the more recent glacial
advances. For age fo glacial advance, ka = thousand years. Modified from QMAP (Turnbull, 2000).
................................................................................................................................................. 18
Figure 14. Major faults and structures near Wanaka. Map from Officers (1984), overlain on elevation model. Cross
section A-A’ is shown in Figure 15 below. ................................................................................... 21
Figure 15. NW-SE oriented cross-section through the Cardrona Valley and Cromwell Basin (marked on Figure 14)
showing the orientation of major fault structures (Officers, 1984). Tertiary sediments remain
preserved along the valley floors, but have been removed by erosion at higher elevations. .......... 22
Figure 16. Seismograph record of vertical accelerations recorded at the Wanaka National Park headquarters
th
during the May 4 2015 earthquake (Figure 17). This event caused some stock to fall from shop
shelves in Wanaka, with a peak acceleration of 0.054 g (image from GNS Science.) ................... 23
Figure 17. Historic seismicity in the west Otago area, with earthquakes larger than MW 3.0 from 1942 – July 2015.
Two earthquakes larger than MW 5.5 have been recorded over that period. The highest
concentration of earthquakes occurs towards the Alpine Fault in the northwest of the mapped area.
Data from GeoNet (accessed July 2015)..................................................................................... 24
Figure 18. Map of Otago region showing MM Intensity expected to be exceeded once in 100 years (Murashev and
Davey, 2005). ............................................................................................................................ 25
Figure 19. Probabilistic seismic hazard map for New Zealand (Stirling et al. 2012). This map shows the maximum
expected peak ground acceleration (relative to gravity) expected over a 475 year period. The zone
of red down the west of the South Island follows the Alpine Fault. ............................................... 26
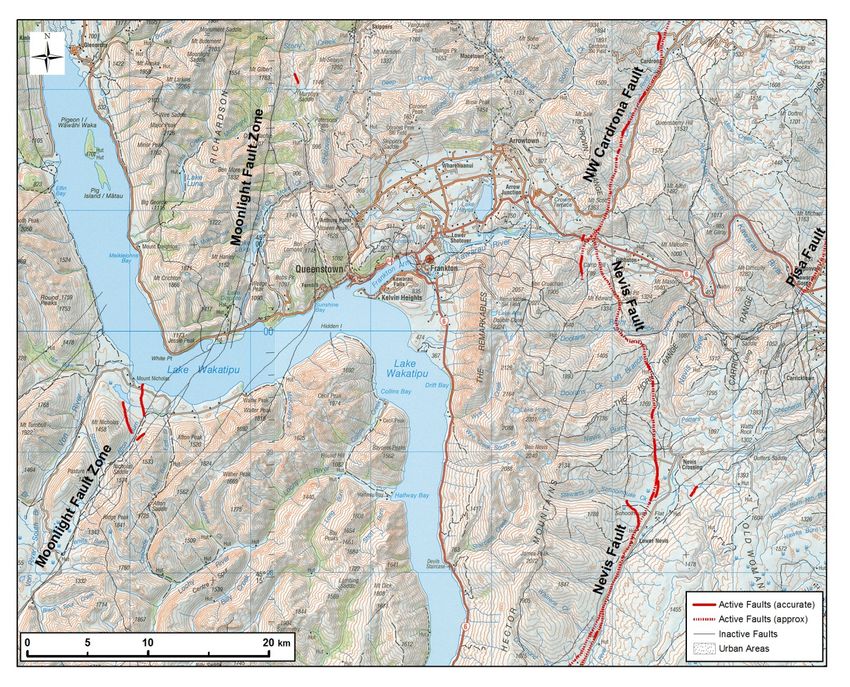
Figure 20. Active and inactive mapped faults near Wanaka. Active faults are mapped as either accurate (e.g.,
where there is a clear surface trace), or approximate. FZ = Fault Zone. From QMAP (Turnbull,
2000)......................................................................................................................................... 27
Figure 21. Diagram of a trench wall cut through active section of a splay of the Northern Cardrona Fault, just
south of MacDonalds Creek (6 km north of Cardrona village). The ~18,000 year old alluvial terrace
deposit (terrace alluvium layer) has been offset by 4 m vertically, by at least three recognised
earthquakes (from Beanland and Barrow-Hurlbert, 1988) ............................................................ 28
Figure 22. View towards the west across the Cardrona Valley. The Cardrona Skifield access road runs lower right
to upper left across the ridge. A visible, active trace of the NW Cardrona Fault is highlighted
between the two arrows (Photo April 2015). ................................................................................ 29
Figure 23. Road cut along Mt Pisa Road showing faulted alluvium and glacial till units along the Pisa Fault Zone.
The gravels, assessed as outwash deposits, are associated with the Lindis glacial advance
(~430,000 years old). ................................................................................................................. 33
Figure 24. Map of liquefaction risk in the Wanaka area assessed by Tonkin & Taylor Ltd (2012) for the
Queenstown Lakes District Council. The most susceptible layers are river courses and some lake
margin areas. The mapping is intended to guide the appropriate level of site investigation at the
development stage, rather than assess the likelihood of liquefaction at a site. .............................. 35
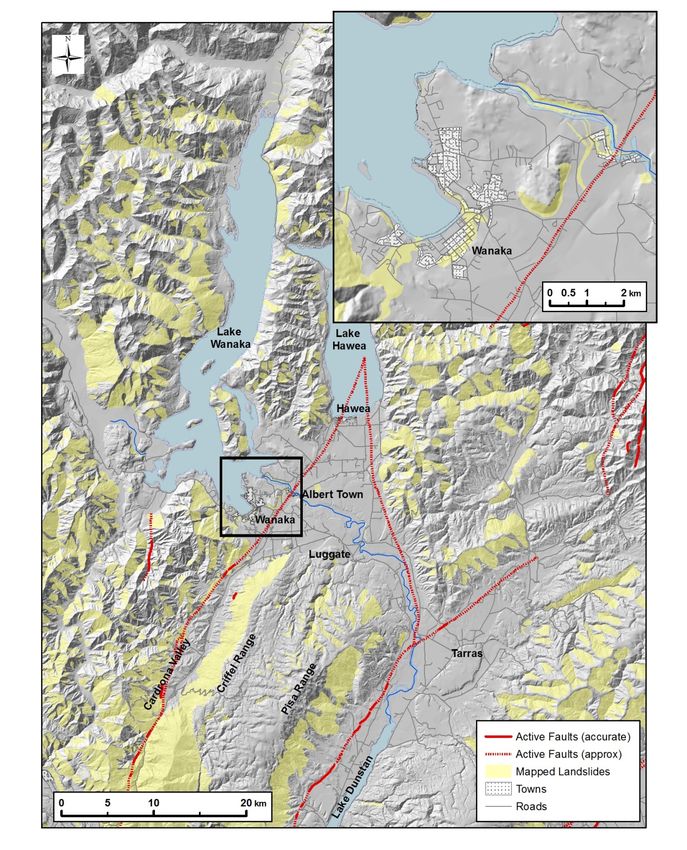
Figure 25. Mapped areas subject to mass-movement hazards in the Upper Clutha area (ORC Natural Hazard
Database). Inset shows area around Wanaka Township. ............................................................ 37
Figure 26. View of the east side of Mt Iron. Steep to subvertical schist cliffs on the eastern and southern sides of
the hill provide source areas for rockfall boulders to roll downslope (July 2015)............................ 38
Figure 27. Rock avalanche deposit south of Wanaka township (Photo courtesy of G. Halliday). Approximate
extent of rock avalanche outlined in black. .................................................................................. 40
Figure 28. Oblique view towards the north, with downtown Wanaka visible in top right of image. A large deep-
Table of Contents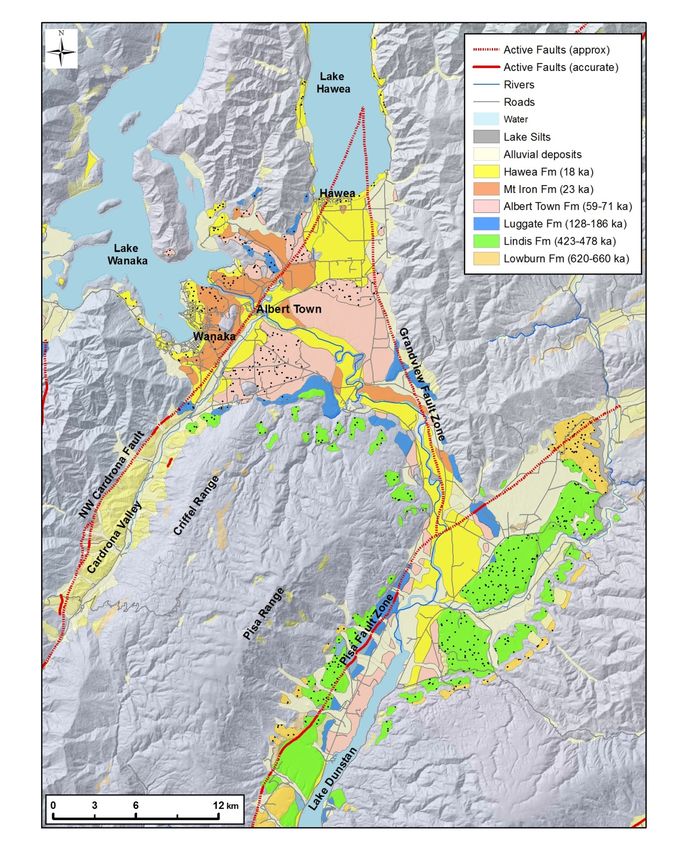
Seismic Hazard in the Queenstown Lakes District                                                                                                             ix

             seated schist landslide south of Wanaka is outlined in black. Ridgeline relaxation can be seen at
             the top of the landslide. .............................................................................................................. 41
Figure 29. Oblique view towards south of Stoney Creek and Waterfall Creek Catchments, and their associated
             alluvial fans in southern Wanaka (Modified from Woods, 2011) ................................................... 42
Figure 30. View down Pipson Creek near Makarora (May 2015). The eroding cliffs in the foreground (and other
             cliffs upstream) contribute rock and sediment to the channel, which can mobilise into debris flows
             during high rainfall. Earthquake shaking is liable to cause extensive rockfall and landsliding into the
             creek. ........................................................................................................................................ 43
Figure 31. View of the Young River Landslide Dam. A landslide in August 2007 dammed the Young River to a
             height of 70m, and formed a ~1.5 km long lake. (May 2015) ........................................................ 44
Figure 32. Wakatipu region study area and prominant geographic features. The report focuses on the populated
             areas surrounding Queenstown and Arrowtown, Bobs Cove, and the Kawarau Gorge down to the
             Gibbston Basin. ......................................................................................................................... 46
Figure 33. Geology of the Wakatipu area. The pale blues and purples are varying metamorphic grades of schist
             bedrock. Glacial depostis (undifferentiated) and alluvial deposits occupy most of the valleys and
             lower hillslopes. Lake silts were deposited during a higher lake level. Isolated outcrops of the
             Tertiary Manuherikia sediments can be found east of the Nevis Cardrona Fault zone. Modified from
             QMAP (Turnbull, 2000). ............................................................................................................. 47
Figure 34. Topographic map of Wakatipu Area showing active and inactive faults. Modified from QMAP (Turnbull
             2000)......................................................................................................................................... 48
Figure 35. Glacial deposits in the Wakatipu area. ‘Q’ denotes glacial age based on Oxygen isotope stage (See
             Appendix C). Modified from QMAP (Turnbull, 2000) .................................................................... 50
Figure 36. Historic seismicity in the Wakatipu area, with earthquakes larger than MW 3.0 from 1942 – July 2015.
             Two earthquakes larger than MW 5.5 have been recorded over that period (labeled). The highest
             concentration of earthquakes occurs towards the Alpine Fault in the northwest of the mapped area,
             80 km from downtown Queenstown. Data from GeoNet (accessed July 2015). ............................ 52
Figure 37. Oblique view of the upper Kawarau Gorge towards the Northwest. The Nevis Cardrona Fault (red) runs
             across the gorge and continues along the Cardrona Valley. The trench in Figure 38 is across the
             upstream-most strand (Kawarau Trace). The Fault runs through a large landslide complex on the
             north side of the valley. The Crown Range Road can be seen climbing up from the Crown Terrace
             and crossing the fult near the summit (Google Earth). ................................................................. 53
Figure 38. Cross section through the Kawarau Trace of the Nevis Fault on terrace above the Kawarau River.
             Evidence for three earthquakes can be seen in the deposits, which date to up to 23,000 years old
             (Beanland and Barrow Hurlbert, 1998). ....................................................................................... 54
Figure 39. Map of Otago region showing MM Intensity expected to be Exceeded once in 2500 years (Murashev
             and Davey, 2005). See also Figure 18 for 100 year exceedence map. ......................................... 56
Figure 40. Map of liquefaction risk in the Wakatipu Region assessed by Tonkin & Taylor Ltd (2012) for the
             Queenstown Lakes District Council. The most susceptible layers are river courses and lake margin
             areas, particularly areas underlain by lake silts. Inset shows downtown Queenstown area. The
             mapping is intended to guide the appropriate level of site investigation, rather than assess the
             likelihood of liquefaction at a site. ............................................................................................... 59
Figure 41. Mapped areas subject to mass movement hazards in the Wakatipu Area (ORC Natural Hazards
             Database).................................................................................................................................. 61
Figure 42. Oblique view towards the foothills of the southern Remarkables Range. SH6 runs across the lower
             view, with Lake Wakatipu lower right. Large boulders, likely from a rockfall, can be seen on the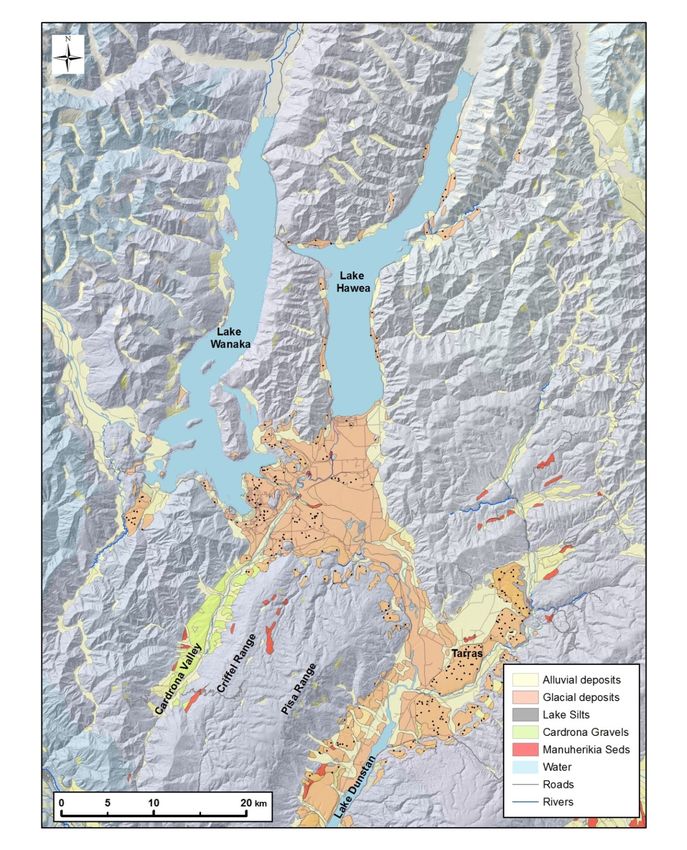
x                                                                                     Seismic Hazard in the Queenstown Lakes District

             slopes below the rocky cliffs in the middle of the view (white dots). Active alluvial fans drain the
             catchments (view from Google Earth). ........................................................................................ 63
Figure 43. Oblique view showing outline of the Coronet Peak landslide, a large deep-seated schist landslide. The
             Shotover River runs along the left side of the image. (Google Earth)............................................ 64
Figure 44. Active alluvial fan and debris deposition in February 1994 as seen from SH6 looking towards the
             Remarkables. Gravel was deposited across SH6. These fans have potential to become more active
             if the headwaters are innundated with sediment following an earthquake. Photo from Cunningham
             (1994). ...................................................................................................................................... 66
Figure 45. View of the Shotover River confluence with the Kawarau River. The Shotover River (in flood) meets the
             Kawarau River 4 km downstream of Lake Wakatipu. The training line on the left of photo is intended
             to focus the Shotover flow to the right (2013). ............................................................................. 67
Figure 46. View down the Kawarau Gorge from Chard Farm Winery. The deep narrow gorge along this section of
             the river, which drains the Wakatipu Basin, has the potential to be blocked by a large landslide from
             the side slopes. (May 2015) ....................................................................................................... 68
Figure 47. Major faults form a series of tilted blocks across the Otago region. The NW Cardrona Fault and Pisa
             fault are the western-most faults. (From Litchfield and Norris, 2000). ........................................... 80
Figure 48. Glacial advances in the Upper Clutha area. Each advance has a moraine (stippled) and an associated
             outwash plain. Modified from QMAP (Turnbull, 2000). ................................................................. 82

List of tables
Table 3.1    Major known active faults in and surrounding the Upper Clutha. SED = Single event displacement,
             Wanaka Dist = closest point of fault to Wanaka. Slip Sense: RV = reverse, SS = Strike Slip, RS =
             reverse slip. Cardrona North and Cardrona South are two segments of the NW Cardrona Fault
             (From Stirling et al., 2012). ......................................................................................................... 19
Table 4.1    Major active faults near the Wakatipu basin. SED = Single event displacement, Dist = closest point
             of fault to Queenstown. Slip Sense: RV = reverse, SS = Strike Slip, RS = reverse slip. (Stirling et
             al., 2012). Note the recurrance intervals are estimates. ............................................................... 49
Table 7.1    Recognised glacial advances in Upper Clutha Valley (as updated by Turnbull, 2000). Age
             correlation of the older units is tentative. ..................................................................................... 81

Table of Contents
Seismic Hazard in the Queenstown Lakes District 1
1. Primary Seismic Hazards
The primary hazards presented by earthquakes are rupture or deformation of the ground
surface along the trace of a fault, and the shaking caused by seismic waves generated by
movement along a fault during an earthquake.
1.1. Surface Rupture
A fault rupture at the ground surface is one of the most dramatic signs of an earthquake
(Figure 1). The ground can be displaced laterally on a strike slip fault, or vertically on a thrust
or normal fault (Figure 2).
Figure 1. The surface trace of the Greendale Fault rupture cut across paddocks in the
Canterbury Plains in September 2010. (Photo courtesy M. Quigley). The
ground moved up to 5.3 m laterally, but was expressed at the surface as a
zone of distributed deformation up to 300 m wide, seen in the network of
shear structures (Quigley et al., 2012).
Fault rupture does not always manifest at the surface as a discrete ‘faultline’, and the
deformation can be distributed across a zone tens or hundreds of meters wide. Surface2 Seismic Hazard in the Queenstown Lakes District
deformation caused by faulting can include tears in the ground surface, rents, cracks, tilting
and folds. Commonly faults can ‘splinter’ near the surface, with multiple traces connecting at
depth to the master fault.
Figure 2. The main styles of faulting. Faults in western Otago are primarily Reverse Faults,
reflecting the regional compression, whereas the Alpine Fault is a
predominantly a strike-slip fault (From USDA National Park Service).
Surface deformation can cause permanent damage to structures along the fault trace.
Damage can include tearing structures in half where they straddle the fault trace, distributed
shearing across the building footprint, or tilting of foundations.
1.2. Ground Motion
Beyond rupturing and deforming the ground surface, fault movement during an earthquake
radiates seismic waves which propagate out from the earthquake focus. The seismic waves
propagate through the ground causing a point on the surface to move or shake in responseSeismic Hazard in the Queenstown Lakes District 3
to the passing waves, the familiar shaking experienced during an earthquake. The strength
and period of shaking at a given site depends on distance and direction to the fault, the size
of the earthquake, and the local ground conditions. Shaking intensity generally declines with
increasing distance from the earthquake source. Further from the earthquake source, the
waves pass through a larger volume of rock, and energy is absorbed along the transmission
path. The strength of shaking at a point is characterised by shaking intensity, which is
governed by the amplitude, velocity and acceleration of the passing seismic waves.
Earthquake size is measured in terms of magnitude (MW ). Ground shaking intensity is
qualitatively measured using the Modified Mercalli (MM) scale, and shaking intensity can be
quantified in units of Peak Ground Acceleration (PGA) and the frequency content of the
shaking. Methods used to measure shaking intensity and quantify the size of earthquakes
are outlined in Appendix A.
Figure 3. Seismographs from two Canterbury Earthquakes as recorded in Christchurch in Sept
2010 (blue line) and Feb 2011 (red line). The Black line is a synthetic
seismograph predicting the level and duration of shaking recorded in
Christchurch during a hypothetical Alpine Fault earthquake. The more distant
but larger Alpine Fault event has less intense ground shaking, but continues
for a much longer duration (Webb et al., 2011).
1.2.1. Topographic amplification of seismic waves
As seismic waves pass through the Earth’s surface they interact with both topography and
the materials they travel through. Differing ground conditions can change the shaking
intensity experienced between nearby locations. A primary example is topographic
amplification of seismic waves on ridgelines and cliff tops, where ridge tops can shake more
than flat ground. Seismic waves can also become trapped within sedimentary basins,
reflecting off bedrock and increasing the intensity of shaking at the basin surface.4 Seismic Hazard in the Queenstown Lakes District Sites on shallow soils (
Seismic Hazard in the Queenstown Lakes District                                                5

et al., 2012). Tectonic deformation can similarly cause problems for gravity drainage
networks such as sewers and storm water. Tectonic uplift in the 2011 Christchurch
earthquake impeded the flow of the Heathcoate River in southern Christchurch and
increased local susceptibility to flooding (e.g., Hughes et al. 2015).

2. Secondary Seismic Hazards
Besides direct damage caused from fault rupture and ground shaking, many hazards from
earthquakes are secondary effects. Modern engineered structures are intended to perform
well under seismic shaking, so the suite of secondary earthquake effects can pose the
greatest and most widespread hazard to life and property.

2.1.      Liquefaction and Lateral Spreading

During seismic shaking, cyclic shearing of loose, fine grained (sand and silts) saturated
sediment can cause the soils to compact, with excess pore pressure leading to liquefaction
of the soil. During liquefaction, the soil can lose bearing capacity (the ability to support a
load), meaning any structures founded in or above a liquefiable layer can subside or settle
differentially. After liquefaction, ground settlement can occur due to the expulsion of soil from
underground.

Buried structures or services, which are lighter than liquefied soil, can become buoyant and
be lifted out of the ground. This can affect septic systems, pipes, cellars, and buried fuel
tanks.

Liquefaction is rarely a direct risk to life, but can cause extensive damage to structures and
civil infrastructure (flood banks, buried services). If sewerage networks are compromised
liquefaction ejecta can be contaminated. When liquefaction silt dries out on the surface it can
present a dust hazard.
6                                                     Seismic Hazard in the Queenstown Lakes District

Figure 5. Effects of liquefaction (from IPENZ Factsheet)

Figure 6. Liquefaction folloiwng the Christchurch 2011 Earthquake (Photo courtesy A. King,
                 GNS Science)
Seismic Hazard in the Queenstown Lakes District 7 In the presence of a suitable free face, such as a river bank, ditch, or lake edge, sections of land can move laterally during liquefaction, a process known as lateral spreading. The upper crust of land can also stretch towards the free face through a series of cracks. The net result is any structures on laterally spreading land can move sideways, and have the ground crack and stretch beneath them. Lateral spreading can cause extensive damage to any structures or services (pipes, cables, poles) in the zone of spreading. Structures and infrastructure near the free face are particularly vulnerable to lateral spreading, and include roads, slope retention systems, or bridge abutments. 2.2. Landslides and Mass Movement Landslides have a range of triggers, such as storms or river undercutting, or alternatively can occur with no apparent external factor. In seismically active areas earthquakes are a primary cause of landslides, as earthquake ground accelerations can lead to slope instability. Many landslides can be triggered across a wide area by an individual earthquake. A range of landslide types could be triggered or reactivated by earthquakes in the Queenstown Lakes district, from small slips in riverbank and road cuttings, through to rapidly moving rock avalanches incorporating millions of cubic meters of rock. 2.2.1. Lake Edge and River Bank Collapse River or lake banks composed of unconsolidated deposits are particularly susceptible to mass movement during an earthquake. The river or lake edge can effectively act as an un- buttressed free-face, allowing movement of the bank towards the water. The affected area is usually localised to the areas of movement and deposition adjacent to the bank, and the hazard can be recognised in advance of an earthquake. Increasing the risk, river banks and lake-margin sites are commonly desirable real estate, or used as routes for roads or bridges. Lake edge collapse was observed on the margins of Lake Te Anau during the 2003 MW 7.0 Fiordland earthquake (Figure 7). These failures occurred in undeveloped shorelines, but people with assets on lakeshores in Queenstown or Wanaka should be prepared for this process occurring during an earthquake.
8                                                      Seismic Hazard in the Queenstown Lakes District

Figure 7. Lake edge failure along Lake Te Anau during the 2003 Fiordland earthquake (Hancox
                 et al. 2003). This failure incorporated liquefaction and lateral spreading of the
                 lake beach area.

2.2.2.   Rockfall
Rockfall is the process by which clasts of rock detach from steep terrain, and roll, slide or
bounce downslope. On steep slopes or slopes with few obstructions (such as vegetation)
rocks can attain significant speed and momentum, and cause serious impact damage to
structures. Rocks can be dislodged by a number of causes (storms, root wedging, animals,
residual weathering), but earthquake shaking is a primary factor in seismically active areas.

Rocks are particularly susceptible to being detached and mobilised during strong local
earthquakes. Research following the 2010−2011 Christchurch earthquakes showed that
strong local earthquakes were more likely to cause rockfall than larger more distant
earthquakes, as can be generated from active faults in the Canterbury foothills and Southern
Alps (Mackey and Quigley, 2014). Seismic sources close to the Wanaka and Queenstown
urban areas, such as the NW Cardrona Fault, should be considered especially liable to
generate coseismic rockfall. If the experience from the Canterbury earthquakes is applied to
the Upper Clutha and Wakatipu areas, small local faults may be a higher rockfall generating
hazard than the residual threat posed by the Alpine Fault, despite the vast difference in
earthquake magnitude and recurrence intervals.
Seismic Hazard in the Queenstown Lakes District 9
Figure 8. Rockfall damage to dwelling at Rapaki, Christchurch, during Feb 22nd 2011
earthquake. The gouge in the foreground is an impact divot from a boulder,
which then impacted the house (Photo courtesy D. Barrell, GNS Science).
2.2.3. Rock Avalanches
Rock avalanches are a devastating type of landslide involving the rapid, flow-like motion of
rock fragments. The can initiate from rock slides or rock falls, and travel significant distances
(> several km) from the source area. A seismic trigger is commonly the cause of rock
avalanches.
2.2.4. Deep Seated Schist Landslides
Regional landslide mapping in central and west Otago has highlighted the abundance of
large schist landslides, which are an important geomorphic process operating across Otago’s
schist terrain (e.g., McSaveney et al., 1991). Approximately half the mountainous terrain in
the Queenstown Lake district is affected by large schist landslides, variably known as
sackung, or deep-seated gravitational instability features (Turnbull, 2000).
Some deep-seated schist landslides are large, and can incorporate whole mountain sides.
Instability can extend for kilometres from valley floors up to and through ridgelines. The depth
of the slides is likely to range from tens to hundreds of meters. The landslides are ultimately
driven by changes in base level, such as channel incision at the toe, and tectonic uplift.
Long-term changes in climate may also regulate movement via changing hillslope hydrology.
Movement rates are usually10 Seismic Hazard in the Queenstown Lakes District Large schist landslides were studied intensively during assessment of the Clyde Dam reservoir (Lake Dunstan), and remain some of the best studied landslides globally. These slides have long term creep rates up to 10 mm/yr (MacFarlane, 2009). Research and field observations indicate the slides are unlikely to move significantly during seismic shaking, although the landslides have yet to be observed during a large earthquake. Small landslide movements, in the order of hundreds of mm, are predicted during seismic shaking, but catastrophic failure is considered unlikely. Such movement of deep seated schist landslides is unlikely to pose a risk to life safety, but has potential to adversely affect any structures constructed on the landslides. In the Upper Clutha area the large landslide-prone slopes have to date seen little residential development, so few of these landslides pose a risk to property. Development has occurred on some deep-seated schist landslides in the Wakatipu area. In both regions, population pressure may see these slopes deemed viable for development in the future, which can increase the risk of any landslide movement. 2.3. Lake Tsunami The rapid displacement of a large volume of water can generate tsunami waves or lake seiching, which can inundate near shore areas. Tsunami can be caused by landslides falling into lakes, or by rupture of faults on the lake bed. Movement of a mass of sediment underwater, as can occur when river deltas collapse or landslides occur underwater, can also generate tsunami waves. Tsunami waves can inundate shorelines, and overtop lake outlets and send flood waves downstream.
Seismic Hazard in the Queenstown Lakes District                                         11

Figure 9. The 2003 Fiordland earthquake caused a 200,000 m3 rockslide into Charles Sound.
                 The landslide caused a small tsunami which ran 4-5 m up the other side of
                 the sound, approximately 800 m away. (Hancox et al., 2003).

2.4.      Seismic effect on aquifers

Earthquakes have a well-recognised effect on groundwater (e.g., Cooper et al., 1965).
Earthquake shaking can effectively squeeze aquifers, leading to increased groundwater
levels, spring flow, and river discharge. These effects were observed during the Canterbury
earthquake sequence (Cox et al., 2012).

Temporarily increased groundwater levels following an earthquake can increase the hazard
posed by liquefaction in subsequent earthquakes or aftershocks, as an elevated groundwater
level saturates sediment to a shallower level.

Additionally, earthquakes can affect the hydrology of large landslides. Earthquakes in the
2010-2011 Christchurch sequence were shown to affect the groundwater in the large schist
debris landslides along the Cromwell Gorge, although these changes in hydrology as a
consequence of those distant earthquakes were not considered to affect landslide stability
(O’Brien, 2014).
12 Seismic Hazard in the Queenstown Lakes District 2.5. Medium-Term Geomorphic Impact 2.5.1. Channel aggradation and debris flows The secondary effects of a large earthquake in the steep, rapidly eroding mountains of New Zealand’s South Island will be felt for decades (e.g., Robinson and Davies, 2013). Regional seismic shaking will liberate abundant hillslope material into streams through landslides, slips and rockfall, a process which has been documented following other large earthquakes (Xu et al., 2012). The increased sediment will overwhelm the transport capacity of many rivers, leading to debris flows, channel aggradation, avulsion, and increased flood risk. 2.5.2. Landslide Dams Landslides which deposit debris in valley floors can form landslide dams, particularly in narrow, steep-sided valleys. The impoundment of water behind the landslide dam presents a hazard by inundating the valley upstream (potentially to an elevation equal to the dam crest), and the dam has the potential to fail catastrophically and flood areas downstream. Failure of landslide dams is common (Costa and Schusta, 1988), due to their weak geotechnical composition. Breach of a landslide dam typically occurs during lake filling, or dam failure can occur when the water level overtops the crest and scours the downstream face of the landslide. Numerous landslide dams would be expected to form following a large earthquake in the Southern Alps and mountains of west and Central Otago, contributing to the rapid sediment influx to mountain streams and rivers.
Seismic Hazard in the Queenstown Lakes District                                               13

3. Seismic Hazard in the Upper Clutha Area
This section focusses on seismic hazards in the ‘Upper Clutha’, broadly defined as the towns
of Wanaka and Hawea, the Cardrona Valley, and the Upper Clutha Valley extending down
towards Tarras (Figure 10). The review is intended to collate and assess known information
about the seismic hazards within the Upper Clutha region, and describe the possible
consequences of various earthquake scenarios on the area, both on the landscape, and the
implications for the built environment, primarily buildings and civil infrastructure. Section 5
identifies aspects of seismic hazard where the risks could be minimised through future work.

The seismic hazard profile for the Upper Clutha is dominated by the Alpine Fault. Several
other active regional faults, such as the NW Cardrona, Grandview, Pisa, Ostler, and Dunstan
Faults, are capable of generating large earthquakes with Magnitude (MW ) 7.0–7.4.

3.1.      Regional Setting and Glacial History

3.1.1.    Geology
The Upper Clutha area is a fault-controlled, structural depression that has been extensively
modified by a sequence of Quaternary glaciations. The area is underlain by schist bedrock,
which comprises foliated Mesozoic metasedimentary rocks (Figure 11). The schist basement
rock is being actively folded, faulted and eroded in response to regional compression and
strain distributed across the mid to lower South Island. Much of the fault activity and uplift in
the area has occurred over the past 5 million years. The geology of the Upper Clutha area is
comprehensively detailed in the Wakatipu QMAP compiled by Turnbull (2000), and a
summary is provided in Appendix B.
14                                                 Seismic Hazard in the Queenstown Lakes District

Figure 10. Upper Clutha study area and principal geographic features. The report focuses on
                 the populated areas below the outlets of Lakes Wanaka and Hawea.
Seismic Hazard in the Queenstown Lakes District 15
Figure 11. Geology of the Upper Clutha area. The pale blues and purples are varying
metamorphic grades of schist bedrock. Glacial deposits (undifferentiated)
and alluvial deposits occupy most of the valleys and lower hillslopes.
Stippled areas represent glacial moraines. Remnants of Quaternary gravels
persist in the Cardrona Valley, and isolated outcrops of the Tertiary
Manuherikia sediments can be found southeast of Wanaka. Modified from
QMAP (Turnbull, 2000).16 Seismic Hazard in the Queenstown Lakes District
Figure 12: Active faults in west Otago and surrounding regions (From QMAP and GNS Active
Fault Database). Otago region is outlined.
3.1.2. Glacial History
The Upper Clutha area has an extensive glacial history (e.g., McKellar, 1960) which is shown
in Figure 13 and outlined in Appendix C. Much of the developed landscape around the Upper
Clutha is a result of erosion or deposition by various glacial processes over the past million
years. The urban areas of Wanaka and Hawea are built upon glacial deposits dating from
~23,000 years ago. The importance of this glacial history for seismic hazard assessment in
the Upper Clutha area is two-fold: a) glacial deposits provide important age control on fault
activity, and b) different glacial lithologies respond differently under seismic shaking.
a) Glacially related features (moraines, outwash plains, lake sediments) of known ages
provide an important means to assess fault activity and rates of deformation. This is
crucial in establishing long term fault movement rates, assessing fault behaviour, and
understanding how frequently a fault is likely to rupture. For example, if a fault trace
deforms a glacial outwash plain, it is known to have ruptured at least once since the
outwash plain was active. In other cases glacial processes can destroy or bury
evidence for faulting, and limit the preservation of surficial fault activity to the previousSeismic Hazard in the Queenstown Lakes District 17
glaciation. This is an in issue in west Otago where many of the faults have recurrence
intervals of tens of thousands of years, which commonly exceed the time since the
last period of glaciation (Hawea advance, ~18,000 years ago) shaped much of the
landscape in valley floor regions. There is no surface evidence for rupture of the NW
Cardrona Fault, for example, where it is projected through Hawea outwash deposits,
but it is thought to be active, as described in Section 3.3.3 below.
b) The second aspect of glacial history which influences seismic hazard is that glacial
lithologies can behave differently during seismic shaking. Glacial moraines, outwash
alluvial deposits, valley wall fans, and glacial lake sediments all have different
geotechnical characteristics. The behaviour of different glacial landforms under
seismic shaking needs to be considered during development. Glacial tills are
generally strong and make good building platforms, whereas silt-dominated lake
sediment can be loose and prone to liquefaction. The varying strength and properties
of the glacial deposits can affect the seismic risk to buildings and infrastructure.18 Seismic Hazard in the Queenstown Lakes District
Figure 13. Depositional glacial landforms in the Upper Clutha area, and location of major active
faults. Each glacial advance has a moraine (stippled) and an associated
outwash plain (unstippled). Older glacial periods (e.g., Lindis, Lowburn) had
larger glaciers which extended further down the Clutha Valley, and are
preserved higher on the valley walls, beyond the extent of the more recent
glacial advances. For age fo glacial advance, ka = thousand years. Modified
from QMAP (Turnbull, 2000).Seismic Hazard in the Queenstown Lakes District 19
3.1.3. Active Faulting
Many faults have been recognised across the Upper Clutha area, although only a few can be
deemed active (Figure 12). There are a range of definitions for what constitutes an active
fault. A recent compilation of active New Zealand faults defined ‘active’ as a rupture in the
past 125,000 years (Litchfield et al., 2014). Confirming fault displacement over this timeframe
in the New Zealand environment can be difficult, due to the rapidly evolving environment and
shortage of datable landscape features. The default approach in New Zealand is to assess a
fault as active where it has offset or deformed the ground surface or near surface deposits
(e.g., Barrell, 2015). In the Upper Clutha area, extensive glacial and fluvial deposits provide a
valuable reference surface for assessing fault activity. There are potentially un-mapped
active faults in the Upper Clutha region, particularly buried beneath glacial lakes and
deposits, and in the rapidly eroding landscape towards the Alpine Fault (Beanland and
Barrow-Hurlbert, 1989, Cox et al., 2012). Major active faults within and surrounding the
Upper Clutha area are listed in Table 3.1. The earthquake recurrence interval and related
data are from a seismic hazard model based on strain accumulation across New Zealand,
and can have significant uncertainties.
Moment SE Rec. Wanaka
Fault Length Slip Slip Rate
Fault Name Magnitude D Interval dist.
(km) Sense (mm/yr)
(M W) (m) (yrs) (km)
Alpine 411 SS 27 8.1 9.2 340 75
Cardrona
34 RS 0.38 7.0 2.4 6200 2.5
(north)
Cardrona
28 RS 0.38 6.7 2 5100 15
(south)
Grandview 32 RV 0.1 7.0 2.2 22000 12
Pisa 47 RV 0.1 7.2 3.3 31000 22
Nevis 69 RV 0.4 7.5 4.8 12000 42
Dunstan 63 RV 0.63 7.4 4.4 7000 48
Ostler 68 RV 1.43 7.4 4.7 3310 58
Table 3.1 Major known active faults in and surrounding the Upper Clutha. SED = Single
event displacement, Wanaka Dist = closest point of fault to Wanaka. Slip
Sense: RV = reverse, SS = Strike Slip, RS = reverse slip. Cardrona North and
Cardrona South are two segments of the NW Cardrona Fault (From Stirling et
al., 2012).
The long term rates of displacement on the Otago reverse faults are generally low, on the
order of ~1 mm/yr (e.g., Litchfield et al., 2014). Although seemingly slow, over 2 million
years, faults moving at this rate have been displaced sub-vertically ~2000 m and transformed
a low-relief surface into the mountainous landscape recognised today (Beanland and
Berryman, 1989). This low slip rate means the faults have long recurrence intervals;
thousands of years are required to build sufficient strain on the fault from one earthquake to
the next, a time known as the inter-seismic period. Despite their slow slip rates and long
recurrence intervals, the faults forming the Otago ‘basin and range’ topography are capable
of generating large earthquakes as described in Section 1.1 above.You can also read