PHILIPPINES ECONOMIC UPDATE: INVESTING IN THE FUTURE - April 2018 Macroeconomics, Trade and Investment Global Practice - Public Documents
←
→
Page content transcription
If your browser does not render page correctly, please read the page content below
PHILIPPINES ECONOMIC UPDATE:
INVESTING IN THE FUTURE

April 2018
Macroeconomics, Trade and Investment Global Practice
East Asia and Pacific Region
PREFACE
The Philippines Economic Update summarizes key economic and social developments, important policy
changes, and the evolution of external conditions over the past six months. It also presents findings from
recent World Bank analysis, situating them in the context of the country’s long-term development trends
and assessing their implications for the country’s medium-term economic outlook. The update covers
issues ranging from macroeconomic management and financial-market dynamics to the complex
challenges of poverty reduction and social development. It is intended to serve the needs of a wide
audience, including policymakers, business leaders, private firms and investors, and analysts and
professionals engaged in the social and economic development of the Philippines.

The Philippines Economic Update is a biannual publication of the World Bank’s Macroeconomics, Trade,
and Investment Global Practice (MTI), prepared in partnership with the Poverty & Equity, Finance,
Competitiveness & Innovation, and Social Protection & Labor Global Practices (GPs). Birgit Hansl (Lead
Economist and Program Leader) and Ndiame Diop (Practice Manager for the MTI GP) guided the
preparation of this edition. The team consisted of Kevin Chua (Economist), Kevin Cruz (Research Analyst)
and Rong Qian (Senior Economist) from the MTI GP, Isaku Endo (Senior Financial Sector Specialist) from
the Finance, Competitiveness and Innovation GP, Gabriel Demombynes (Program Leader), Xubei Luo
(Senior Economist) and Sharon Faye Alariao Piza (Economist) from the Poverty & Equity GP. Thilakaratna
Ranaweera (Consultant) provided technical support on the growth projection. The report was edited by
Oscar Parlback (Сonsultant), and the graphic designer was Robert Waiharo (Сonsultant). Peer reviewers
were Jasmin Chakeri (Program Leader, LCC1C) and Yutaka Yoshino (Lead Economist and Program Leader,
AFCE1). Logistics and publication support were provided by Maria Consuelo Sy (Program Assistant). The
Manila External Communications Team, consisting of David Llorito (Communications Officer) prepared
the media release, dissemination plan, and web-based multimedia presentation.

The team would like to thank Mara Warwick (Country Director for Brunei, Malaysia, Philippines and
Thailand) for her advice and support. The report benefited from the recommendations and feedback of
various stakeholders in the World Bank as well as from the government, the business community, labor
associations, academic institutions, and civil society. The team is very grateful for their contributions and
perspectives. The findings, interpretations, and conclusions expressed in the Philippines Economic Update
are those of the World Bank and do not necessarily reflect the views of the World Bank’s executive board
or any national government. This report went to press on April 13, 2018.

If you wish to be included in the email distribution list for the Philippines Economic Update and related
publications, please contact Maria Consuelo Sy (msy@worldbank.org). For questions and comments
regarding the content of this publication, please contact Birgit Hansl (bhansl@worldbank.org). Questions
from the media should be addressed to David Llorito (dllorito@worldbank.org).

For more information about the World Bank and its activities in the Philippines, please visit
www.worldbank.org/ph.

                                                      I
ABBREVIATIONS AND ACRONYMS

2TBA         Two-tier budgeting approach
BOP          Balance of payments
BPO          Business process outsourcing
BSP          Bangko Sentral ng Pilipinas
CALABARZON   Cavite, Laguna, Batangas, Rizal, and Quezon
CPI          Consumer price index
FDI          Foreign direct investment
GOCC         Government-owned and controlled corporation
IT           Information technology
PREXC        Program expenditure classification
TFP          Total factor productivity
TRAIN        Tax Reform for Acceleration and Inclusion
TVET         Technical and vocational education and training
UACS         Unified accounts code structure
VA           Value added

                    II
Table of Content
PREFACE ........................................................................................................................................... I
List of Figures ................................................................................................................................. III
List of Tables ................................................................................................................................... V
List of Boxes ................................................................................................................................... VI
EXECUTIVE SUMMARY .................................................................................................................. VII
Part I:       RECENT ECONOMIC AND POLICY DEVELOPMENTS ......................................................... 1
   1.1        Growth: Benefitting from the Global Recovery ............................................................... 2
   1.2 The Exchange Rate and the External Sector: Impacts from an Improving External
   Environment................................................................................................................................ 6
   1.3 Financial Markets and Monetary Policy: Keeping the Policy Rate Steady despite Rising
   Inflation ..................................................................................................................................... 10
   1.4        Fiscal Policy: Preparing for the Public Investment Increase .......................................... 12
   1.5        Employment and Poverty: A Tight Labor Market with Limited Real Wage Growth ...... 16
Part II: OUTLOOK AND RISKS...................................................................................................... 21
   2.1        Growth Outlook.............................................................................................................. 22
   2.2        Poverty and Shared Prosperity Outlook ........................................................................ 29
   2.3        Risks and Policy Challenges ............................................................................................ 30
Part III:        THE MISSING LINKS TO HIGHER SHARED PROSPERITY IN THE PHILIPPINES .............. 34
   3.1        Introduction.................................................................................................................... 35
   3.2        Drivers of Poverty Reduction ......................................................................................... 37
   3.3        The Remaining Challenge: Low-quality Jobs and Slow Real Wage Growth ................... 39
   3.4        The Importance of Education in Labor Market Participation and Wage Growth .......... 44
   3.5        Conclusion ...................................................................................................................... 49
References .................................................................................................................................... 51

                                                            List of Figures
Figure 1: Strong Exports Contributed to Growth among Regional Peers in 2017 … ...................... 2
Figure 2: … and Helped Sustain Growth in the Philippines ............................................................ 2
Figure 3: In the Philippines, Exports Drove Growth While Investment Significantly Slowed … ..... 3
Figure 4: … While Manufacturing Expanded and Agriculture Recovered ...................................... 3
Figure 5: Average capacity utilization in the manufacturing sector has reached historic highs in
early 2018. ...................................................................................................................................... 5
                                                                         III
Figure 6: In 2017, the Peso Has Depreciated in Both Nominal and Real Terms… .......................... 7
Figure 7: … Making It One of the Worst Performing Regional Currencies ..................................... 7
Figure 8: Recovery in the External Environment Supported the Growth in Exports in 2017 ... ..... 9
Figure 9: … Yet Continued Higher Import Growth Led to a Widening Current Account Deficit .... 9
Figure 10: Exports of Electronics (index, 2010 = 100) .................................................................. 10
Figure 11: Inflation Rose Sharply and Surpassed in March 2018 the Ceiling of the Central Bank’s
Target Range ................................................................................................................................. 11
Figure 12: Credit Has Sustained Its Double-digit Growth Rates ................................................... 11
Figure 13: National Government Fiscal Balance, 2013-17............................................................ 12
Figure 14: Fiscal Balance, Percent of GDP, 2000-17 ..................................................................... 13
Figure 15: Public Expenditures as a Share of Nominal GDP 2013-17 ........................................... 13
Figure 16: Public Expenditures by Economic Classification (Actual Disbursements), Percent of
Total Expenditures, 2013-17 ......................................................................................................... 14
Figure 17: Public Expenditures by Functional Classification (Obligation Basis), Percent of Total
Expenditures, 2013-17 .................................................................................................................. 14
Figure 18: Government Revenue Efforts, 2006-16 ....................................................................... 15
Figure 19: Tax Revenue Efforts, 2006-16 ...................................................................................... 15
Figure 20: The Government Financed Its Deficit through Domestic Borrowing .......................... 16
Figure 21: The Overall Debt-to-GDP Ratio Remained Unchanged from 2016 to 2017 ................ 16
Figure 22: The Unemployment Rate Remained Around 5 percent ... .......................................... 18
Figure 23: … While the Labor Force Participation Rate Remained Below the 10-year Average .. 18
Figure 24: Changes in Real Daily Wages, 2007-17 ........................................................................ 19
Figure 25: The Philippine Economy is Projected to Grow at 6.7 percent in 2018 and 2019. ....... 22
Figure 26: Global Economic Growth, 2000-20 .............................................................................. 24
Figure 27: Output Gaps, 2000-18.................................................................................................. 24
Figure 28: The Largest Share of Domestic Bank Credit is Channeled to Real Estate and
Construction.................................................................................................................................. 29
Figure 29: The Manufacturing and Finance Sectors are among the Favorite Destinations of Foreign
Direct Investment. ........................................................................................................................ 29
Figure 30: Sustained Economic Growth Makes It Likely That Poverty Reduction Will Continue . 30
Figure 31: Selected Macroeconomic Indicators ........................................................................... 32
Figure 32: National Poverty Rates and Number of Poor .............................................................. 35
Figure 33: Poverty Trends Based on National and International Poverty Lines ........................... 35

                                                                       IV
Figure 34: Prosperity Improvement in the Philippines Compared to the East Asia Pacific Region
....................................................................................................................................................... 36
Figure 35: Contribution of Income Sources to Poverty Reduction, 2006–2015........................... 38
Figure 36: Millions of Workers Transitioned out of Agriculture ................................................... 38
Figure 37: Greater Earnings in Services and Manufacturing than in Agriculture ......................... 38
Figure 38: Poverty Rate by Employment Sector of Household Heads ........................................ 40
Figure 39: Poverty Rate by Employment Status of Household Heads .......................................... 40
Figure 40: Working-age Population, Labor Force, and Employment Growth .............................. 41
Figure 41: GDP, Employment, and Real Wage Growth ................................................................ 41
Figure 42: Share of Employment of the Poor by Sector ............................................................... 42
Figure 43: Share of Employment of an Average Filipino by Sector .............................................. 42
Figure 44: Intersectoral Labor Allocation in Select East Asian Countries ..................................... 42
Figure 45: Countries Changes in the Composition of Employment Status Over Time ................. 44
Figure 46: Rate of Return for Another Year of Education ............................................................ 45
Figure 47: Rate of Return for Education by Education Level ........................................................ 45
Figure 48: Marginal Effect on the Probability of Wage Employment with an Additional Year of
Schooling by Gender and Location ............................................................................................... 46
Figure 49: Marginal Effect on the Probability of Wage Employment with an Additional Year of
Schooling by Education Level ........................................................................................................ 46
Figure 50: Youth (20–29 years old) Education Levels Across Income Groups.............................. 47
Figure 51: Educational Attainment Rate among 22–24 Year-olds by Income Quintiles, 2006-15 48
Figure 52: Educational Attainment Rate among 22–24 Year-olds by Gender, 2006-15 .............. 48
Figure 53: Reasons for Not Attending Elementary School among 6- to 11-Year-olds in the Poorest
Quintile, 2014................................................................................................................................ 48
Figure 54: Reasons for Not Attending High School among 12- to 15-Year-olds in the Poorest
Quintile, 2014................................................................................................................................ 48

                                                              List of Tables
Table 1: Balance of Payments, 2014-17.......................................................................................... 8
Table 2: Real GDP Growth Rates, 2015-2020 ............................................................................... 24
Table 3: Economic indicators for the Baseline Projection ............................................................ 28
Table 4. Poverty Rate in Selected East Asian Countries ............................................................... 36

                                                                           V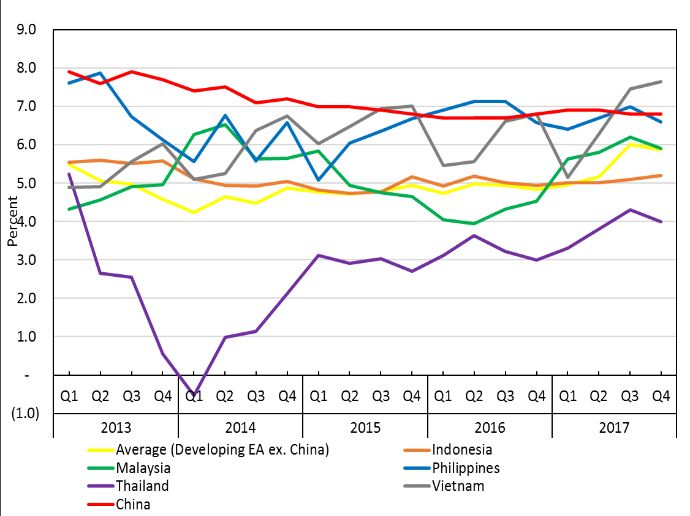
Table 5. Employment and Earnings Status, Percent ..................................................................... 43
Table 6. Employment, Unemployment, and Daily Earnings by Educational Attainment, Perent 44

                                                     List of Boxes
Box 1. The Global Economy is Experiencing a Broad-based and Maturing Cyclical Recovery ....... 5
Box 2: Electronics Export Growth in the East Asia Pacific Region .................................................. 9
Box 3: Recent Public Expenditure Profile of the Philippines ........................................................ 13
Box 4: Public Revenue in the East Asia Pacific Region .................................................................. 15
Box 5: Building Human Capital through the K-12 Basic Education Program ................................ 19
Box 6: The Global Economic Outlook............................................................................................ 23
Box 7: Initiatives to Modernize the Budgeting Process ................................................................ 26
Box 8: The Next Steps for the Government’s Tax Reform Program. ............................................ 33

                                                               VI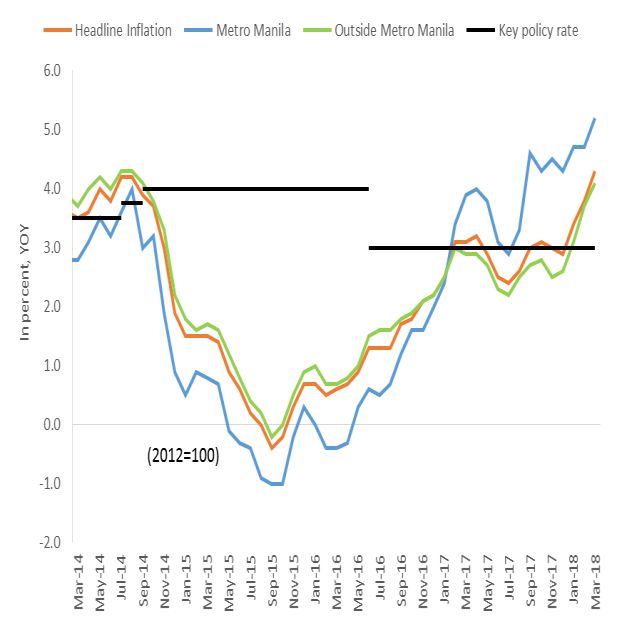
EXECUTIVE SUMMARY
In 2017, the Philippines was among the top three growth performers in the East Asia region.
Only Vietnam and China performed better. The Philippines growth performance slightly
weakened in 2017 to 6.7 percent year-on-year from 6.9 percent in 2016. Growth was anchored
in strong exports, while investment growth significantly slowed and consumption growth
moderated. The Philippines’ annual exports rose sharply in 2017 and became the main engine of
economic growth, while imports continued to grow by double-digits. Investment growth slowed
in 2017, following two consecutive years of rapid expansion, and climbing inflation slowed real
wage growth and contributed to a moderation in private consumption growth.
Monetary and fiscal policy remained accommodative. Both fiscal expenditure and revenue
increased in 2017 compared to 2016. The fiscal deficit narrowed, as the government narrowly
missed its expenditure target, despite improved budget execution. Infrastructure expenditures
exceeded their programmed target, and focused on repair and rehabilitation projects, while most
of the planned flagship investment program has not started construction yet. Revenue collection
in the Philippines is still among the lowest in the region, but as a key revenue mobilization policy,
the Philippines successfully passed its first package of tax reforms in December 2017, which is
estimated to generate an additional Php82.3 billion in public revenue in 2018. Rising inflation
started to put a strain on the Bangko Sentral ng Pilipinas’ (BSP) accommodative monetary policy
in 2017, and the inflation rate exceeded the ceiling of the inflation target range in early 2018.
Nonetheless, the BSP’s monetary board kept the policy rate fixed at 3.0 percent.

The country’s medium-term growth outlook remains positive. The Philippine economy is
projected to continue on its expansionary path and grow at an annual rate of 6.7 percent in both
2018 and 2019. In 2020, growth is expected to level at 6.6 percent. The economy is currently
growing at its potential, making productive investment in physical and human capital essential
for the economy to continue to grow along its current growth trajectory. Investment growth
hinges on the government’s ability to effectively and timely implement its ambitious public
investment program.

Domestic risks are becoming more prominent. Inflationary pressure is expected to intensify in
2018 due to both domestic and external factors. The Philippine economy is also at risk of
overheating. The implementation of the public infrastructure program is vital to the country’s
growth outlook, as private investment is expected to weaken. Prudent fiscal management and
the implementation of the government’s tax reform agenda could help secure the country’s fiscal
sustainability. External risks remain present, especially a faster-than-expected policy
normalization in advanced economies that could trigger financial volatility and increase capital
outflows from the Philippines. Renewed protectionist sentiments in several advanced economies
will also elevate policy uncertainty, which may disrupt trade and investments.

High-quality jobs and faster growth of real wages are essential to achieve shared prosperity
and inclusive growth. In recent years, the Philippine economy has made great strides in
delivering inclusive growth, evidenced by the declining poverty rates and a falling Gini coefficient.
Unemployment has reached historic low rates, but underemployment remains high, near its 18-
                                                 VII
20 percent decade-long average. More importantly, unlike its high-performing East Asian
neighbors with booming manufacturing sectors that provide large numbers of labor-intensive
jobs, a majority of Filipino workers that transition out of agriculture generally end up in low-end
service jobs. Thus, while employment increased between 2006 and 2015, mean wages remained
stagnant, with only a four percent increase in real terms over the same period. High-quality jobs
and faster growth of real wages are the missing links to higher shared prosperity.

More can be done to create high-quality jobs in the Philippines. Delivering inclusive economic
growth through better-paying jobs remains the country’s most pressing challenge. The
government needs to affirm its commitment to structural reforms that promote competition,
secure property rights, lessen regulatory complexities, and improve the country’s investment
climate. Investing in the future means prioritizing investment in both physical infrastructure and
human capital, such as in education, skills, and health, as this will create better employment
opportunities, especially among the poor.

                                               VIII
Part I:        RECENT ECONOMIC AND POLICY DEVELOPMENTS

The Philippines’ growth performance slightly weakened in 2017 to 6.7 percent year-on-year from
6.9 percent year-on-year in 2016. The country’s main growth driver was stronger external
demand due to the ongoing global recovery. Philippine exports expanded by 19.2 percent year-
on-year in 2017 - the highest rate since 2010 - and nearly doubled its 10.7 percent year-on-year
growth in 2016. Consumption growth remained strong, close to its seven-year average, but
moderated because of higher inflation in 2017. Investment growth slowed significantly in 2017,
with fixed capital formation growing at 10.3 percent year-on-year in 2017 compared to 25.2
percent year-on-year in 2016. Monetary policy remained accommodative, as the key policy rate
has been maintained at 3.0 percent since June 2016, while the reserve requirement ratio was
lowered by one percentage point in March 2018. Fiscal policy remained consistent with the
government’s policy to increase human capital and infrastructure investments. However, a faster-
than-expected normalization of global policy rates and concerns over a growing current-account
deficit in the Philippines diminished investors’ appetite for Philippine assets, leading to capital
outflows and a continued weakness in the exchange rate. Nevertheless, sustained economic
growth in recent years made it likely that poverty continued to decline, but recent inflation trends
might adversely impact the poor.

                                                 1
1.1 Growth: Benefitting from the Global Recovery
In 2017, the Philippines was among the top three growth performers in the region, with an annual
GDP growth rate of 6.7 percent. The country’s economic growth was anchored in strong exports,
while investment growth significantly slowed and consumption growth moderated.
1. The ongoing global economic recovery has raised the demand for Philippine exports,
which constituted the country’s main driver of economic growth in 2017. A maturing, broad-
based cyclical recovery in advanced economies and a long-awaited rebound in global investment,
trade, and manufacturing (Box 1) resulted in favorable external demand conditions that led to
more vibrant export activities in the region. As with regional peers such as China, Vietnam, and
Malaysia (Figure 1), the Philippines experienced a surge in exports, which partly compensated for
the significant fall in domestic demand, especially for investment. As a result, its annual GDP
growth rate fell slightly from 6.9 percent in 2016 to 6.7 percent in 2017. Despite a continued
inflow of remittances, private consumption growth moderated as inflation continued to climb,
limiting real wage growth. Compared to 2016, the Philippines fell by two ranks in the regional
growth table in 2017, with China and Vietnam taking over the top ranks (Figure 2).
Figure 1: Strong Exports Contributed to Growth Figure 2: … and Helped Sustain Growth in the
among Regional Peers in 2017 … Philippines
Source: World Bank staff calculations, Haver Analytics, Source: World Bank staff calculations.
2015-2017 data. Note: Countries in developing East Asia, excluding China, are
the Philippines, Indonesia, Malaysia, Thailand, and Vietnam.
2. The Philippines’ annual exports rose sharply in 2017 and became the main engine of
economic growth, while imports continued to grow by double-digits. The export growth rate
nearly doubled from 10.7 percent year-on-year in 2016 to 19.2 percent year-on-year in 2017 -
the highest level since 2010 when exports rose by 21.0 percent year-on-year (Figure 3).1 The
country’s strong export performance was fueled by a rebound in the exports of electronics
1
The discussion of net exports in this section assesses values at constant 2000 prices. This differs from the discussion
in the balance of payments section, where net exports are assessed based on values at current prices.
2components – its main export commodities, which grew by 27.5 percent year-on-year, more than
three times the growth rate in 2016.2 In particular, the growth in the exports of semiconductor
components accelerated from 25.8 percent year-on-year in 2016 to 41.8 percent year-on-year in
2017. The export of electronics components also drove the import of intermediary electronics
goods, which grew from 34.0 percent year-on-year in 2016 to 35.2 percent year-on-year in 2017.
Overall, the annual import growth rate of 17.6 percent in 2017 remained close to the 2016 level
of 18.5 percent.
Figure 3: In the Philippines, Exports Drove Growth Figure 4: … While Manufacturing Expanded and
While Investment Significantly Slowed … Agriculture Recovered
Source: PSA. Source: PSA.
Note: Other industries are mining and quarrying, construction,
electricity, gas, and water.
3. Consumption growth, the country’s second engine of economic growth, moderated in
2017. The annual consumption growth rate decelerated from 7.1 percent in 2016 to 6.0 percent
in 2017 - close to its seven-year average of 5.8 percent. It was supported by a sustained credit
expansion, which benefitted from a continued accommodative monetary policy stance by the
Bangko Sentral ng Pilipinas (BSP).3 Private consumption was also supported by a robust growth
in remittances from overseas Filipinos from 4.9 percent year-on-year in 2016 to 5.3 percent year-
on-year in 2017, totaling US$31.3 billion, or 10.3 percent of GDP in 2017. However, a rising
inflation rate gradually weakened consumer sentiment, and a slightly higher unemployment rate
likely contributed to a slowdown in private consumption growth in 2017. The annual public
consumption growth rate also fell from 8.4 percent in 2016 to 7.3 percent in 2017.4
2
The growth of agricultural exports, driven by the exports of coconut and sugar products, rose from 1.8 percent
year-on-year in 2016 to 9.3 percent year-on-year in 2017, as the agriculture sector recovered in 2016.
3
The BSP kept the policy rate unchanged at 3.0 percent in 2017, which maintained low interest rates and contributed
to a double-digit expansion in consumer loans in 2017.
4
Domestic spending in 2016 was supported by election-related government spending.
34. Investment growth moderated in 2017, following two consecutive years of rapid
expansion. Fixed capital formation decelerated from growing by 25.2 percent year-on-year in
2016 to 10.3 percent year-on-year in 2017, as investment growth in durable equipment and
construction declined sharply. Investment in durable equipment expanded by 12.2 percent year-
on-year in 2017, significantly less than the 34.5 percent year-on-year in 2016, while construction
investment growth slowed from 15.1 percent year-on-year in 2016 to 5.7 percent year-on-year
in 2017. The annual public construction growth rate fell from 28.0 percent in 2016 to 13.5 percent
in 2017, which was likely partly the result of a base effect from the increase in public capital
spending during the pre-election period in 2016. Moreover, private construction, which account
for nearly three-fourths of all investments in the construction sector, expanded at a much slower
pace in 2017 (3.3 percent year-on-year) compared to 2016 (11.5 percent year-on-year).
5. The manufacturing sector grew for a second consecutive year, surpassing the growth
performance of the services sector. While growth in the industry sector was robust, it moderated
from 8.4 percent year-on-year in 2016 to 7.2 percent year-on-year in 2017 (Figure 4). The
manufacturing sector, specifically communication equipment production, food manufacturing,
and chemical production, continued to fuel output growth and grew from 7.0 percent year-on-
year in 2016 to 8.6 percent year-on-year in 2017.5 While manufacturing output growth (i.e. the
volume of production index) was negative in the latter half of 2017, it expanded rapidly in January
and February of 2018 (Figure 5). Together with increasing capacity utilization levels, this raises
the risk of overheating in the economy (see Part II. Outlook and Risks). 6 The services sector
constituted another strong growth performer in 2017 and expanded by 6.7 percent year-on-year
in 2017, down from 7.4 percent year-on-year in 2016. In the services sector, financial services
exhibited the strongest growth and expanded slightly from 7.6 percent year-on-year in 2016 to
7.7 percent year-on-year in 2017.7
6. Following a contraction in 2016, the agriculture sector recovered in 2017 due to
favorable weather conditions. The country’s agriculture sector grew by 3.9 percent year-on-year
in 2017, reversing a contraction of 1.3 percent year-on-year in 2016. The recovery was primarily
the result of a low base in 2016 and more favorable weather conditions for farm output.8 Despite
the sector’s recent recovery, it remains vulnerable to weather-related shocks that continue to
cause volatility and reduce farm output. For example, damages from typhoon Urduja, which
struck the country in December 2017, reached an estimated Php1.0 billion, affecting the
5
However, the mining, construction, and utilities sectors registered lower growth in 2017.
6
Manufacturing output growth in early 2018 was mainly driven by the production of food, petroleum product, and
electrical machinery, the last of which, could lead to the expansion of productive capacity.
7
Similarly, wholesale and retail trade, government services subsectors, and real estate all supported the growth in
services, with each expanding by more than 7 percent year-on-year in 2017. Wholesale and retail trade grew from
7.2 percent year-on-year in 2016 to 7.1 percent year-on-year in 2017; government services grew from 7.2 percent
year-on-year in 2016 to 7.6 percent year-on-year in 2017; and the real estate sector grew at an annual rate of 7.5
percent in 2017, down from 8.9 percent in 2016.
8
The fisheries subsector contracted in 2017 because of supply disruptions, attributed to the limited fishing
operations in Zamboanga peninsula in the third quarter, a fishing ban in the Visayas sea that allowed for fish
spawning in November and December, and weather disturbances from May to September. The livestock subsector
grew at a weaker rate of 1.1 percent year-on-year in 2017, down from 4.6 percent year-on-year in 2016.
4livelihood of 38,466 farmers and damaging 23,829 metric tons of farm output. 9 A positive
development in the agriculture sector is the continued diversification of farm produce into high
value export crops such as coconut, coffee, and cacao, which is reflected in growing agricultural
exports.
Figure 5: Average capacity utilization in the
manufacturing sector has reached historic highs in
early 2018.
Source: PSA.
Box 1. The Global Economy is Experiencing a Broad-based and Maturing Cyclical Recovery
The recovery in the global economy went hand in hand with a rebound in investment, manufacturing, and
trade. This economic recovery came against the backdrop of benign global financing conditions, generally
accommodative public policies, rising confidence, and firming commodity prices. The global GDP growth rate
increased from 2.4 percent in 2016 to 3.1 percent in 2017, above the June forecast of 2.7 percent. The economic
upturn is broad-based, with growth increasing in more than half of the world’s economies. In particular, the
rebound in global investment growth—which accounted for three quarters of the acceleration in global GDP
growth from 2016 to 2017—was supported by favorable financing costs, rising profits, and improved business
sentiment across both advanced and emerging market and developing economies. This synchronous, investment-
led recovery provided a substantial boost to global exports and imports.
In 2017, the GDP growth rate in advanced economies rebounded to an estimated average of 2.2 percent year-
on-year, driven by a pickup in capital spending, a turnaround in inventories, and strengthening external
demand. The pickup in investment reflected increased capacity utilization, favorable financing conditions, and
rising profits and business sentiment. Confidence was supported by the fact that policy uncertainty, albeit still
elevated, diminished during the year. While growth accelerated in all major economies, the improvement was
markedly stronger than expected in the Euro Area.
9
Geronimo, J. (2017).
5The average GDP growth rate among emerging market and developing economies accelerated to an estimated
4.4 percent year-on-year in 2017, reflecting firming activity in commodity exporters and continued solid growth
in commodity importers. Most emerging market and developing regions benefited from a recovery in exports, as
commodity exporters benefited from key economies—such as Brazil and the Russian Federation—emerging from
a recession, a rise in commodity prices, improved confidence, diminishing drag from earlier policy tightening
measures, and a bottoming out of investment growth after a prolonged period of slow growth. Nonetheless,
growth among commodity exporters, estimated at an average of 1.8 percent year-on-year in 2017, was still
subdued and insufficient to improve average per capita income, which continued to stagnate after two
consecutive years of contraction
Global goods trade volumes have gathered significant momentum since mid-2016, following two years of
pronounced weakness. A cyclical rebound in investment contributed to a strong growth in the trade of
machinery, electronics, and semiconductors. Global trade growth is estimated to have reached a stronger-than-
expected 4.5 percent year-on-year in 2017, as import demand recovered in both advanced economies and
emerging market and developing economies. The recovery in global trade has been closely linked to the cyclical
upturn in global manufacturing, which in turn was encouraged by an increase in capital spending.
Source: World Bank (2018a), World Bank (2018c), and World Bank (2018d).
1.2 The Exchange Rate and the External Sector: Impacts from an Improving External
Environment
A favorable external environment supported export growth but also prompted interest rate hikes
in advanced economies in 2017. A faster-than-expected global policy rate normalization and
concerns over a growing current-account deficit in the Philippines diminished investors’ appetite
for Philippine assets, leading to capital outflows and continued weakness in the exchange rate.
7. The peso experienced heightened volatility in 2017, weakening for most of the year,
except in the second quarter and the end of the year when remittances increased. Robust
import demand for raw materials and intermediate goods contributed to a rise in demand for US
dollars. Increasing capital outflows weakened the exchange rate as a faster-than-expected global
policy rate normalization and concerns over a growing current-account deficit in the Philippines
diminished investors’ appetite for Philippine assets. As a result, the Philippine peso depreciated
in nominal terms by 6.1 percent year-on-year, from an average of Php/US$ 47.51 in 2016 to an
average of Php/US$ 50.40 in 2017 (Figure 6). In February 2018, the peso reached its weakest
point in twelve years, breaching the Php/US$ 52.00 level, after having ended 2017 just below the
Php/US$ 50.00 mark. The real effective exchange rate depreciated by an average of 4.1 percent
year-on-year in 2017, more than the average 3.6 percent year-on-year depreciation in 2016.10
This made the peso, along with the Indonesian rupiah, the weakest currency among regional
peers (Figure 7), although it may have supported the price-competitiveness of Philippine exports.
10
In real terms, the peso depreciated from 4.1 year-on-year in March 2017 to 6.3 percent year-on-year in March
2018, weakening the real effective exchange rate to Php/US$ 81.34.
6Figure 6: In 2017, the Peso Has Depreciated in Both Figure 7: … Making It One of the Worst Performing
Nominal and Real Terms… Regional Currencies
Source: BSP. Source: World Bank staff calculations.
Note: Decrease denotes depreciation.
8. The current account ran a higher deficit in 2017 than in 2016, as stronger services
exports and remittance receipts could not offset a widening trade deficit (Table 1). The current-
account deficit deteriorated from US$1.2 billion (0.4 percent of GDP) in 2016 to US$2.5 billion
(0.8 percent of GDP) in 2017, as the merchandise trade deficit widened from 11.7 percent of GDP
in 2016 to 13.1 percent in 2017 (Figure 8). 11 In 2017, annual import growth of 14.2 percent
outstripped healthy export growth of 12.8 percent. However, the growth of imports was higher
in 2016 (17.7 percent year-on-year),12 while export growth rebounded from a contraction of 1.1
percent in 2016.13 The weakening trade balance was also not offset by stronger net services
exports, which grew at 34.8 percent year-on-year in 2017, supported by strong receipts from the
tourism and information technology-business process outsourcing (IT-BPO) industries.14 The flow
of personal remittances from overseas Filipinos totaled US31.3 billion in 2017 and grew from 4.9
11
The discussion of net exports in this section assesses values at current prices. This differs from the discussion of
net exports in the growth section, where net exports assess values at constant 2000 prices.
12
The import of raw materials and intermediate goods grew from an annual rate of 5.2 percent in 2016 to 11.3
percent in 2017, as intermediate inputs are re-processed and exported abroad. Nonetheless, softer domestic
demand significantly moderated the growth of imported capital goods from an annual rate of 46.6 percent in 2016
to 4.2 percent in 2017, and consumer goods from 30.1 percent in 2016 to 8.4 percent in 2017. The country’s
international reserves declined, and import coverage shrank from an average of 9.7 months in 2016 to 8.4 months
in 2017. In 2017, ASEAN, China, Japan, South Korea, and the United States were the Philippines’ major import
partners, while ASEAN, Japan, the United States, Hong Kong, and China were the country’s major export partners.
13
The recovering external demand from advanced economies raised the country’s electronic exports, which
accounted for more than half of the export bill and contributed to about two-thirds of export growth (Box 2).
14
Data from the Department of Tourism showed that total visitors to the country increased by almost 11.0 percent
to 6.6 million in 2017, which exceeded the administration’s 6.5 million target under its National Tourism
Development Plan for 2016-2022. In 2017, earnings from BPO services amounted to US$22.1 billion,they grew by
9.6 percent year-on-year.
7percent year-on-year in 2016 to 5.3 percent year-on-year in 2017, despite political uncertainties
in the Middle East15 - the country’s second largest source of remittances after the United States.
Table 1: Balance of Payments, 2014-17
In millions US$ / in percentage of GDP
2014 2015 2016 2017
Current account 10,756 3.8 7,266 2.5 (1,199) (0.4) (2,518) (0.8)
Goods (17,330) (6.1) (23,309) (8.0) (35,549) (11.7) (41,191) (13.1)
Services 4,576 1.6 5,455 1.9 7,043 2.3 9,496 3.0
Primary Income 727 0.3 1,857 0.6 2,579 0.8 3,094 1.0
Secondary Income 22,782 8.0 23,263 7.9 24,728 8.1 26,083 8.3
Capital and Financial accounts (9,523) (3.3) (2,216) (0.8) (113) (0.0) 2,265 0.7
Capital account 108 0.0 84 0.0 62 0.0 57 0.0
Financial account 9,631 3.4 2,301 0.8 175 0.1 (2,208) (0.7)
Direct investment 1,014 0.4 (100) (0.0) (5,883) (1.9) (8,110) (2.6)
Net acquisition of financial assets 6,754 2.4 5,540 1.9 2,397 0.8 1,939 0.6
Net incurrence of liabilities 1/ 5,740 2.0 5,639 1.9 8,280 2.7 10,049 3.2
Portfolio investment 2,708 1.0 5,471 1.9 1,480 0.5 3,889 1.2
Financial derivatives 4 0.0 6 0.0 (32) (0.0) (51) (0.0)
Other investments 5,905 2.1 (3,076) (1.1) 4,610 1.5 2,064 0.7
2/
Net unclassified items (4,091) (1.4) (2,433) (0.8) 892 0.3 (610) (0.2)
Overall BOP position (2,858) (1.0) 2,616 0.9 (420) (0.1) (863) (0.3)
Memo:
Basic Balance 9,742 3.4 7,365 2.5 4,684 1.5 5,593 1.8
1/
Net incurrence of liabilities refers to net foreign direct investment to the Philippines.
2/
The term "Net unclassified items" is a balancing figure. There are two methods of computing the BOP position: the first approach uses the change in net international
reserves due to transactions, while the second approach computes the sum balances of the current account, capital account less financial account. The two measures
do not necessarily tally. The BSP uses the first approach to determine the overall BOP position.
Note: Following the BSP presentation, the BOP balance = Current Account Balance + Capital Account Balance - Financial Account Balance + Net Unclassified Items.
9. Spurred by net portfolio and other investment outflows, the annual balance of
payments (BOP) deficit more than doubled in 2017 (Figure 9). The country’s overall BOP deficit
widened from US$0.4 billion (0.1 percent of GDP) in 2016 to US$0.9 billion (0.3 percent of GDP)
in 2017. While portfolio and other investment net capital outflows amounted to US$3.9 billion
and US$2.0 billion, respectively, foreign direct investment (FDI) increased by 21.4 percent year-
on-year and totaled US$10.0 billion in 2017. This was the highest level of net FDI ever recorded
in the Philippines, which was driven by strong investments in domestic equity and debt
instruments. Compared with neighboring countries in 2017, the Philippines’ net FDI as a share of
GDP (3.2 percent) surpassed that of Malaysia (2.9 percent), Indonesia (2.2 percent), and Thailand
(1.8 percent).
15
These political uncertainties arose from the continuing conflict in Syria and the diplomatic crisis between Qatar
and its neighboring Arab states that started in June 2017. In February 2018, the Philippines issued a ban on deploying
overseas Filipino workers in Kuwait, following a series of deaths and injury reports of Filipino workers in the Gulf
state. However, the two countries are finalizing a bilateral agreement meant to lift the current ban.
8Figure 8: Recovery in the External Environment Figure 9: … Yet Continued Higher Import Growth Led
Supported the Growth in Exports in 2017 ... to a Widening Current Account Deficit
Source: PSA. Source: BSP.
Box 2: Electronics Export Growth in the East Asia Pacific Region
An investment-led global recovery has provided a substantial boost to global and regional manufacturing and
trade. In 2017, global trade growth benefitted from an acceleration of the global GDP growth rate to around 3.0
percent year-on-year, reflecting investment-led growth in advanced economies and a cyclical recovery in
commodity-exporting emerging market and developing economies. As a result, global trade growth is estimated
to have reached a stronger-than-expected 4.5 percent year-on-year in 2017, following two years of slow growth.
In the East Asia Pacific region, this was driven by a combination of a rise in commodity prices and the bottoming
out of the global technology inventory cycle.
The global technological cycle increased exports of machinery, electronics, and integrated circuits. The rise in
industrial production and the re-stocking of technology inventory (including mobile phones) were among the
most significant determinants of export growth in 2017. 16 China (including Hong Kong), Malaysia, and the
Philippines were among the top ten exporters of integrated circuits (with 38.0, 6.4, and 3.4 percent of total
exports in 2016, respectively) and semiconductor devices (with 41.0, 8.5, 2.5 percent of total exports in 2016,
respectively) in 2016. While their share in global markets is relatively low, exports of broadcasting equipment,
computers, and other final electronic products represent more than 10 percent of total exports in Vietnam,
Thailand, the Philippines, and Malaysia. These countries benefitted disproportionately from the recovery in the
global trade cycle due to their competitiveness and established capacity.
As a result, electronics exports accelerated rapidly in the East Asia Pacific region in 2017, following a muted
performance in 2016. The Philippines’ electronics export revenue growth accelerated from 1.0 percent in 2016
to 20.5 percent in 2017 due to a rise in the international demand for integrated circuits, computers, and other
electronics, which represent more than half of the country’s merchandise export basket. Similarly, other countries
in the EAP region recorded double-digit growth in electronics export revenue in 2017, such as Vietnam (19.5
percent), Thailand (18.4 percent), Malaysia (14.5 percent), and China (10.8 percent) (Figure 10).
16
Meanwhile, the inventory of technology goods in major export destinations accumulated during the recession
years and finally reached its trough during the second half of 2015 and the first half of 2016. This start of the
technology re-stocking cycle, partly fueled by the pickup in business investment in advanced economies and the
anticipated launch of new mobile devices in the second half of 2017, helped boost Asia’s technology exports,
including semiconductors and other mobile equipment components. Source: IMF (2017).
9Figure 10: Exports of Electronics (index, 2010 = 100)
350
300
250
200
150
100
50
0
2010 2011 2012 2013 2014 2015 2016 2017
China Vietnam Thailand Malaysia Philippines
Source: World Bank; IMF WEO, and World Bank staff estimates.
Source: International Monetary Fund (2017), World Bank (2018d).
1.3 Financial Markets and Monetary Policy: Keeping the Policy Rate Steady despite
Rising Inflation
In 2017, rising inflation started to put a strain on the BSP’s accommodative monetary policy, and
the inflation rate surpassed in early 2018 the 4 percent ceiling of the inflation target range. Credit
continued its rapid expansion in 2017 but eased in the fourth quarter.
10. Pressure from the rising inflation rate increased in 2017 while the key policy rate
remained unchanged. Despite a newly rebased consumer price index (CPI) series,17 the headline
inflation rate climbed from an average of 1.3 percent in 2016 to 2.9 percent in 2017, before
reaching 4.3 percent in March 2018, which was beyond the ceiling of the BSP’ inflation target
range (Figure 11). Food inflation drove almost half of the CPI inflation increase in 2017 because
of higher prices of fish, meat, and fruit products. Energy prices rose in tandem with the global
increase in crude oil prices and adjustments in local electricity prices. Excluding the volatile food
and energy items, core inflation also rose sharply, partly due to the pass-through effect of a
weaker peso. It could also indicate increasing demand side pressure due to the economy
operating at its potential, which could be an early sign of the economy overheating. Despite rising
domestic inflationary pressure and the three upward adjustments of the U.S. Federal Funds rate
in 2017, the BSP monetary board kept the policy rate fixed at 3.0 percent throughout the year,
while it lowered the reserve requirement ratio by one percentage point as of March 2, 2018.18
17
In March 2018, the Philippine Statistics Authority rebased the CPI series from 2006 as the base year to the new
base year of 2012, changed the weights of the market basket with expenditure data from the 2012 Family Income
and Expenditure Survey, and adopted the chain method in the 2012-based CPI series.
18
The BSP maintains that the 1 percentage-point reduction in the reserve requirement ratio was an operational
adjustment to support its shift toward a more market-based implementation of monetary policy. The monetary
board reaffirmed the BSP’s commitment to gradually reduce its reliance on reserve requirements for managing
1011. Credit growth remained strong in 2017. Total credit growth accelerated from an annual
average of 14.3 percent in 2016 to 17.8 percent in 2017, mirrored largely by a domestic liquidity
(M3) increase from an average of 12.5 percent year-on-year in 2016 to an average of 13.2 percent
year-on-year in 2017. Moreover, credit to firms grew from 13.5 percent year-on-year in 2016 to
17.4 percent year-on-year in 2017, while the growth in household loans was sustained at an
annual rate of 20.3 percent in 2017, which was slightly lower than the 20.5 percent increase in
2016 (Figure 12). The sectoral composition of firms’ loan portfolios has remained broadly
unchanged, as credit growth continued to favor the real estate and wholesale and retail trade
sectors. Among consumption loans, the largest credit increase in 2017 was for motor vehicle
loans, which grew at an annual rate of 24.6 percent (51.0 percent of total consumption loans),
followed by a 19.1 percent (20.5 percent) annual increase in credit for salary-based loans and
16.5 percent (24.9 percent) for credit card debt.19 The credit-to-GDP ratio continued to steadily
rise from an average of 61.0 percent in 2016 to an average of 64.6 percent in 2017.
12. The Philippines’ financial system remains stable and resilient. The share of non-
performing loans declined from an average of 2.2 percent of total loans in 2016 to 1.9 percent in
2017. Philippine banks are well capitalized, with a total capital adequacy ratio at 15.3 in
September 2017, well above the 10 percent regulatory minimum. In addition, banks’ return on
equity slightly decreased from an average of 10.0 percent in 2016 to 9.9 percent in 2017. Also,
the share of interest income to total operating income increased from an average of 73.1 percent
in 2016 to 74.7 percent in 2017, while net interest margins remained unchanged at an average
of 3.3 percent.
Figure 11: Inflation Rose Sharply and Surpassed in Figure 12: Credit Has Sustained Its Double-digit
March 2018 the Ceiling of the Central Bank’s Target Growth Rates
Range
Source: PSA, BSP. Source: BSP.
liquidity in the financial system, and observed that the BSP has ample scope to mitigate the potential liquidity impact
of a phased reduction in the reserve requirement via offsetting auction-based monetary operations.
19
Banking industry data reveal that some firms may have started to overleverage in the current environment of fast
credit growth and low interest rates. The IMF article IV notes that non-financial corporate leverage has risen but is
still moderate compared to peers.
111.4 Fiscal Policy: Preparing for the Public Investment Increase
The fiscal deficit narrowed in 2017, as the government missed its expenditure target, despite
improved budget execution, and exceeded its revenue target.
13. The government continued to improve budget execution in 2017. Public expenditure
increased from 17.6 percent of GDP in 2016 to 17.9 percent in 2017 (Figure 13). Nevertheless,
the government’s budget execution fell short of programmed public spending by 2.9 percent in
2017, which was only a slight improvement from the 3.6 percent in 2016.20 Underspending was
primarily the result of lower-than-expected recurrent spending on personnel expenditures and
maintenance and other operating expenditures. 21 Meanwhile, infrastructure expenditures
exceeded their programmed target and increased slightly from 3.4 percent of GDP in 2016 to 3.6
percent in 2017. Infrastructure outlays were directed towards the implementation of various
road infrastructure, flood control, and dike and river basin repair projects as well as the repair
and rehabilitation of school facilities and the purchase of military equipment under the Armed
Forces of the Philippines’ modernization program (Box 3). However, the government has not yet
started construction on its large planned flagship infrastructure projects.
Figure 13: National Government Fiscal Balance, 2013-17
20.0 Revenues Expenditure
17.6 17.9
16.3 16.7
15.8
14.9 15.115.7 15.2 15.7
15.0
Percent of GDP
10.0
5.0
0.0
-0.6 -0.9
-1.4
-2.4 -2.2
-5.0
2013 2014 2015 2016 2017
Source: Bureau of the Treasury.
20
The government attributes improved budget execution to reforms to shorten the approval process of plans and
programs and stricter implementation of project planning, monitoring, and scheduling. Source:
https://www.dbm.gov.ph/wp-content/uploads/DBCC/2017/Highlights-of-NG-Disbursements_as-of-December-
2017_for-posting.pdf.
21
In 2017, spending on personnel services was 8.4 percent below the programmed budget, while maintenance and
other operating expenses was 1.9 percent below their programmed budgets.
12Box 3: Recent Public Expenditure Profile of the Philippines
Public expenditure has consistently surpassed public revenue in the Philippines. The fiscal balance has been in
deficit since 2000, reaching a high of 5.0 percent of nominal GDP in 2002 and a low of 0.2 percent of GDP in 2007
(Figure 14). Public expenditure averaged 16.8 percent between 2013 and 2017, which was similar to the average
in the preceding five years but lower compared to the regional peer average of 23.9 percent in the same period
(Figure 15). Among its peers, China’s public expenditure as a share of GDP was the largest at 37.5 percent,
followed by Vietnam (29.6 percent) and Malaysia (22 percent). Nonetheless, public spending in the Philippines is
programmed to substantially rise as the administration rolls out its flagship infrastructure and social investment
programs. In 2018, budget disbursement is expected to increase to Php3.3 trillion, a 17.3 percent increase from
the Php2.8 trillion actual disbursement in 2017.
Figure 14: Fiscal Balance, Percent of GDP, 2000-17 Figure 15: Public Expenditures as a Share of Nominal
GDP 2013-17
Source: DBM. Source: World Bank staff calculations.
Public spending on productive expenditure items has increased over the past five years. The central government
and local government units received about two-thirds and one fifth of the total public budget, respectively, and
the rest was shared between government-owned and controlled corporations (GOCCs) and creditors. Personnel
services (including payments for salaries, wages, and other compensation) and maintenance and other operating
expenses (including expenses for operations of government agencies) have dominated the Philippines’ public
expenditures and remained roughly constant as a share of total expenditures between 2013 and 2017 (Figure 16).
However, the share of interest payments declined significantly from 17.2 percent of total public spending in 2013
to 11.9 percent in 2017, freeing up funds that were increasingly directed to finance expenditures for infrastructure
and other capital outlays.22 Public spending on infrastructure and other capital outlays and subsidies rose from
an annual rate of 14.0 percent and 3.4 percent, respectively, in 2013 to 20.1 percent and 4.6 percent, respectively,
in 2017.
22
The share of interest payments to total expenditures declined in recent years despite the depreciation of the
Philippine peso, partly as a result of the government increasingly relying on domestic financing, and partly due to
nominal GDP growth outpacing the expansion of interest payments.
13Since 2013, most public spending has been directed to education, health, and infrastructure in order to increase
human and physical capital investment. The bulk of programmed social spending has historically been in the
areas of education, culture, and manpower development, which constituted 21.2 percent of total public
expenditures, or 4.5 percent of GDP in 2017 (Figure 17). In recent years, more budget resources have been
allotted to social protection, specifically for housing and social security, welfare, and employment, increasing from
0.6 percent of GDP in 2010 to 1.9 percent in 2017. In 2017, most public spending in the economic services sector23
was directed to communications and road and transportation, accounting for 3.0 percent of GDP, or nearly half
of total spending in the sector. Debt services, particularly interest payments, dropped significantly as the
government benefitted from a low interest rate environment and strategic debt restructuring.
Figure 16: Public Expenditures by Economic Figure 17: Public Expenditures by Functional
Classification (Actual Disbursements), Percent of Classification (Obligation Basis), Percent of Total
Total Expenditures, 2013-17 Expenditures, 2013-17
Source: DBM, World Bank staff calculations. Source: DBM, World Bank staff calculations.
Note: Other expenses are tax expenditure funds, corporate
equity and capital transfers to local government units.
14. Although total public revenue increased from 15.2 percent of GDP in 2016 to 15.7
percent in 2017, revenue collection in the Philippines is among the lowest in the region (Box
4). The level of revenue generated in 2017 was slightly lower than in 2015 (15.8 percent of GDP),
and it only exceeded the government’s programmed target by 1.9 percent. Tax revenue, which
reached 14.2 percent of GDP in 2017, is the biggest source of public revenue in the Philippines.
Although the Bureau of Internal Revenue and the Bureau of Customs improved their revenue
collection, they missed their programmed revenue targets by 0.6 percent and 0.3 percent,
respectively.
23
Spending on economic services includes expenditures in the following categories: i) communications, roads, and
transportation facilities; ii) agriculture, agrarian reform, and natural resources; iii) water resources development and
flood control; iv) trade and industry; v) power and energy; and vi) tourism.
14You can also read